Races in Fairmont, West Virginia (WV) Detailed Stats
Ancestries, Foreign-born residents, place of birth
Settings
X


Recent posts about races in Fairmont, West Virginia on our local forum with over 2,400,000 registered users:
 | Fairmont people, is this a good place? (17 replies) |
| Bridgeport/Fairmont safe apartments (2 replies) |
| Looking for house to Rent in Fairmont, Clarksburg, Bridgeport, WV area (1 reply) |
| WestRidge/UTC/Mall/Gateway Developments (1501 replies) |
| Clarksburg/Fairmont vs. Beckley vs. Lewisburg (General Areas) Which is growing fastest? (24 replies) |
| Morgantown Business News (1161 replies) |
Latest news about races in Fairmont, WV collected exclusively by city-data.com from local newspapers, TV, and radio stations
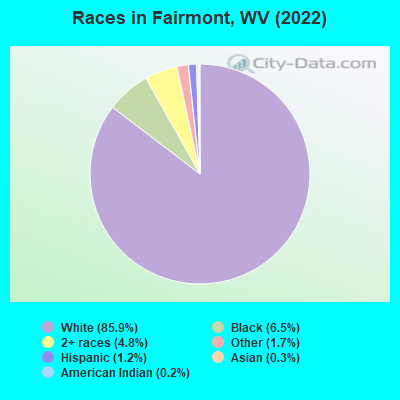
According to 2022 data, the most numerous races in Fairmont, WV are White alone (15,647 residents), Two or more races (883 residents), and Black alone (1,182 residents). 98.1% of Fairmont residents speak English at home. 0.9% of Fairmont, WV residents are foreign-born , which is 12.5% less than the foreign-born rate of 1.0% across the entire state of West Virginia.
Race distribution in Fairmont
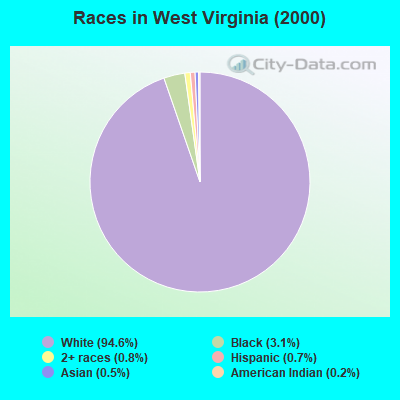
2000
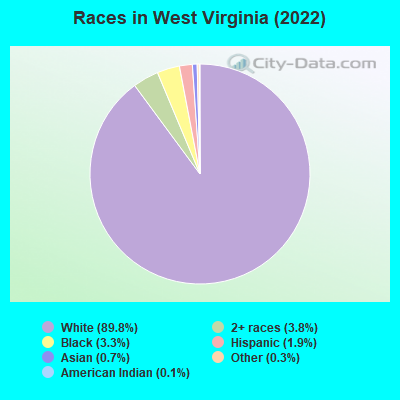
2022

- 17,09089.5%White alone
- 1,3817.2%Black alone
- 2771.5%Two or more races
- 1570.8%Hispanic
- 1160.6%Asian alone
- 490.3%American Indian alone
- 230.1%Other race alone
- 40.02%Native Hawaiian and Other
Pacific Islander alone

-
- 15,64785.9%White alone
- 1,1826.5%Black alone
- 8834.8%Two or more races
- 3101.7%Other race alone
- 2121.2%Hispanic
- 490.3%Asian alone
- 390.2%American Indian alone
- 10.01%Native Hawaiian and Other
Pacific Islander alone
2000
2022
-
- 1,709,96694.6%White alone
- 56,8253.1%Black alone
- 14,9830.8%Two or more races
- 12,2790.7%Hispanic
- 9,3560.5%Asian alone
- 3,4560.2%American Indian alone
- 1,1440.06%Other race alone
- 3350.02%Native Hawaiian and Other
Pacific Islander alone
-
- 1,594,12889.8%White alone
- 66,9323.8%Two or more races
- 59,3903.3%Black alone
- 34,3431.9%Hispanic
- 13,1340.7%Asian alone
- 5,2380.3%Other race alone
- 1,8800.1%American Indian alone
- 1110.01%Native Hawaiian and Other
Pacific Islander alone
Income and house value in Fairmont
- Median household income in 2022
- $57,498White non-Hispanic householders
- $17,569Black householders
- $16,012Some other race householders
- $29,301Two or more races householders
- $104,492Hispanic or Latino race householders
- Median 2022 house value
- $152,265White Non-Hispanic householders
- $113,956Black or African American householders
- $50,674American Indian or Alaska Native householders
- $429,397Asian householders
- $125,351Two or more races householders
- $153,477Hispanic or Latino householders
Household income for White non-Hispanic householders

Household income for Black householders

Household income for Asian householders

Household income for Some other race householders

Household income for Two or more races householders

Household income for Hispanic or Latino race householders

Median age by race in Fairmont
- 36.4Median age for White residents
- 35.2Males
- 37.5Females
- 41.7Median age for Black or African American residents
- 44.5Males
- 36.1Females
- 16.2Median age for American Indian / Alaska Native residents
- 14.2Males
- -723,367,696.9Females
- 63.0Median age for Asian residents
- 60.7Males
- 56.3Females
- -827,078,733.5Median age for Native Hawaiian / Pacific Islander residents
- -668,724,279.2Males
- -670,599,802.7Females
- 3.2Median age for Other race residents
- 3.3Males
- 3.1Females
- 27.2Median age for Two or more races residents
- 20.3Males
- 35.3Females
- 36.4Median age for White alone residents
- 35.4Males
- 37.3Females
- 28.4Median age for Hispanic or Latino residents
- 24.6Males
- 47.6Females
Owner/renter occupied households by race in Fairmont
- House owners and renters - White residents
- 4,72064.9%Owner occupied
- 2,54935.1%Renter occupied
- House owners and renters - Black or African American residents
- 15838.3%Owner occupied
- 25461.7%Renter occupied
- House owners and renters - American Indian / Alaska Native residents
- 2100.0%Renter occupied
- House owners and renters - Asian residents
- 1436.5%Owner occupied
- 2463.5%Renter occupied
- House owners and renters - Other race residents
- 1874.2%Owner occupied
- 625.8%Renter occupied
- House owners and renters - Two or more races residents
- 7526.4%Owner occupied
- 21073.6%Renter occupied
- House owners and renters - White alone residents
- 4,71164.9%Owner occupied
- 2,55135.1%Renter occupied
- House owners and renters - Hispanic or Latino residents
- 2656.1%Owner occupied
- 2043.9%Renter occupied
Language usage in Fairmont
- English speakers - Total
- 98.1% of residents of Fairmont speak English at home.
- 0.5% of residents speak Spanish at home
- 87100.0%Speak English very well
- 1.3% of residents speak other language at home
- 20694.9%Speak English very well
- 115.1%Speak English less than very well
- English speakers - Born in the United States
- 97.7% of residents of Fairmont speak English at home.
- 1.2% of residents speak Spanish at home
- 52100.0%Speak English very well
- 1.0% of residents speak other language at home
- 3678.3%Speak English very well
- 1021.7%Speak English less than very well
- English speakers - Native, born elsewhere
- 0.0% of residents of Fairmont speak English at home.
- 58.8% of residents speak other language at home
- 20100.0%Speak English very well
- English speakers - Foreign-born
- 71.3% of residents of Fairmont speak English at home.
- 7.3% of residents speak Spanish at home
- 13100.0%Speak English very well
- 22.5% of residents speak other language at home
- 3895.0%Speak English very well
- 25.0%Speak English less than very well
White (Caucasian) - Speak only English
| Native: | 98.7% (14,656) |
| Foreign-born: | 100.0% (48) |
White (Caucasian) - Speak another language
| Native: | 1.2% (184) |
| Foreign-born: | 8.5% (4) |
Black or African American - Speak only English
| Native: | 99.3% (1,098) |
| Foreign-born: | 83.2% (54) |
Black or African American - Speak another language
| Native: | 0.8% (9) |
| Foreign-born: | 6.2% (4) |
Asian - Speak only English
| Native: | 100.0% (3) |
| Foreign-born: | 25.9% (13) |
Two or more races - Speak another language
| Native: | 4.5% (41) |
| Foreign-born: | 100.0% (12) |
White alone - Speak only English
| Native: | 98.7% (14,635) |
| Foreign-born: | 100.0% (45) |
Hispanic or Latino - Speak another language
| Native: | 31.0% (51) |
| Foreign-born: | 100.0% (15) |
Foreign-born residents in Fairmont
162 residents are foreign born
| This city: | 0.9% |
| West Virginia: | 1.6% |


Marital status for residents in Fairmont
Marital status - White (Caucasian) population 15 years and over
- Males
- 41.8%Never married
- 44.1%Now married
- 0.8%Separated
- 2.3%Widowed
- 11.0%Divorced
- Females
- 33.0%Never married
- 43.8%Now married
- 0.8%Separated
- 10.3%Widowed
- 12.2%Divorced
Women who gave birth in the past 12 months
| Now married: | 55.9% (171) |
| Unmarried: | 44.1% (135) |
Women who did not give birth in the past 12 months
| Now married: | 37.2% (1,400) |
| Unmarried: | 62.8% (2,366) |
Marital status - Black or African American population 15 years and over
- Males
- 61.2%Never married
- 24.3%Now married
- 7.6%Separated
- 0.8%Widowed
- 6.0%Divorced
- Females
- 53.4%Never married
- 16.6%Now married
- 3.4%Separated
- 21.5%Widowed
- 5.1%Divorced
Women who gave birth in the past 12 months
| Now married: | 0.0% (0) |
| Unmarried: | 100.0% (37) |
Women who did not give birth in the past 12 months
| Now married: | 14.7% (40) |
| Unmarried: | 85.3% (236) |
Marital status - American Indian / Alaska Native population 15 years and over
- Males
- 96.4%Never married
- 0.0%Now married
- 0.0%Separated
- 3.6%Widowed
- 0.0%Divorced
- Females
- 0.0%Never married
- 100.0%Now married
- 0.0%Separated
- 0.0%Widowed
- 0.0%Divorced
Marital status - Asian population 15 years and over
- Males
- 4.3%Never married
- 47.8%Now married
- 43.5%Separated
- 0.0%Widowed
- 4.3%Divorced
- Females
- 36.0%Never married
- 64.0%Now married
- 0.0%Separated
- 0.0%Widowed
- 0.0%Divorced
Women who did not give birth in the past 12 months
| Now married: | 35.7% (5) |
| Unmarried: | 64.3% (9) |
Marital status - Other race population 15 years and over
- Males
- 83.3%Never married
- 16.7%Now married
- 0.0%Separated
- 0.0%Widowed
- 0.0%Divorced
- Females
- 91.7%Never married
- 8.3%Now married
- 0.0%Separated
- 0.0%Widowed
- 0.0%Divorced
Women who gave birth in the past 12 months
| Now married: | 99.1% (1) |
| Unmarried: | 0.0% (0) |
Women who did not give birth in the past 12 months
| Now married: | 11.1% (1) |
| Unmarried: | 88.9% (8) |
Marital status - Two or more races population 15 years and over
- Males
- 74.8%Never married
- 16.8%Now married
- 0.0%Separated
- 0.0%Widowed
- 8.4%Divorced
- Females
- 71.3%Never married
- 15.0%Now married
- 0.0%Separated
- 0.0%Widowed
- 13.8%Divorced
Women who gave birth in the past 12 months
| Now married: | 100.0% (10) |
| Unmarried: | 0.0% (0) |
Women who did not give birth in the past 12 months
| Now married: | 5.3% (14) |
| Unmarried: | 94.7% (256) |
Marital status - White alone, not Hispanic / Latino population 15 years and over
- Males
- 41.8%Never married
- 44.1%Now married
- 0.8%Separated
- 2.3%Widowed
- 11.0%Divorced
- Females
- 33.1%Never married
- 43.5%Now married
- 0.8%Separated
- 10.4%Widowed
- 12.2%Divorced
Women who gave birth in the past 12 months
| Now married: | 55.9% (171) |
| Unmarried: | 44.1% (135) |
Women who did not give birth in the past 12 months
| Now married: | 37.1% (1,391) |
| Unmarried: | 62.9% (2,355) |
Marital status - Hispanic or Latino population 15 years and over
- Males
- 82.5%Never married
- 16.2%Now married
- 0.0%Separated
- 1.2%Widowed
- 0.0%Divorced
- Females
- 17.2%Never married
- 61.3%Now married
- 0.0%Separated
- 0.0%Widowed
- 21.5%Divorced
Women who gave birth in the past 12 months
| Now married: | 99.0% (1) |
| Unmarried: | 0.0% (0) |
Women who did not give birth in the past 12 months
| Now married: | 30.4% (14) |
| Unmarried: | 69.6% (32) |
Ancestries in Fairmont

- 1,11814.8%English
- 1,10714.6%American
- 99813.2%German
- 86611.4%Italian
- 78810.4%Irish
- 1221.6%Scotch-Irish
- 1131.5%European
- 761.0%Scottish
- 640.8%West Indian
- 540.7%Polish
- 530.7%Canadian
- 490.6%French
- 370.5%French Canadian
- 350.5%Ukrainian
- 260.3%Haitian
- 220.3%Russian
- 150.2%Hungarian
- 110.1%Croatian
- 110.1%Greek
- 70.09%Swedish
- 70.09%Jamaican
- 60.08%British
- 60.08%Czech
- 60.08%Dutch
- 60.08%Estonian
- 60.08%African
- 50.07%Danish

Geographical mobility in Fairmont

- Same house 1 year ago
- 13,03383.8%White (Caucasian)
- 80768.0%Black or African American
- 815.2%American Indian / Alaska Native
- 4997.5%Asian
- 19387.0%Other race
- 80477.0%Two or more races
- 12,98183.7%White alone, not Hispanic / Latino
- 14770.5%Hispanic or Latino

-
- Moved within same county
- 1,0927.0%White / Caucasian
- 18115.3%Black or African American
- 2913.3%Other race
- 444.2%Two or more races
- 1,0987.1%White alone, not Hispanic / Latino
- 83.9%Hispanic or Latino

-
- Moved within same state
- 9406.0%White / Caucasian
- 342.8%Black or African American
- 2650.1%American Indian / Alaska Native
- 11.8%Asian
- 14513.9%Two or more races
- 9436.1%White alone, not Hispanic / Latino
- 3215.5%Hispanic or Latino

-
- Moved from different state
- 4232.7%White / Caucasian
- 12610.6%Black or African American
- 199.3%Native Hawaiian / Pacific Islander
- 10.6%Other race
- 424.0%Two or more races
- 4222.7%White alone, not Hispanic / Latino
- 178.2%Hispanic or Latino

Children Nativity (place of birth) in Fairmont
Place of birth for residents in Fairmont
![Place of birth for the foreign-born population - Regions]()
- 77Americas
- 57Latin America
- 57Caribbean
- 48Asia
- 30Eastern Asia
- 25Europe
- 25Northern Europe
- 25China
- 20Northern America
- 10South Eastern Asia
- 10Africa
- 10Western Africa
- 8South Central Asia

![Place of birth for the foreign-born population - Countries]()
- 41Trinidad and Tobago
- 25United Kingdom
- 25China
- 20Canada
- 12Cuba
- 10Malaysia
- 10Nigeria
- 8Bangladesh
- 5Japan
- 3Haiti

Grandparents responsible for own grandchildren in Fairmont
Zip codes: 26554.