Elizabeth, NJ (New Jersey) Houses and Residents
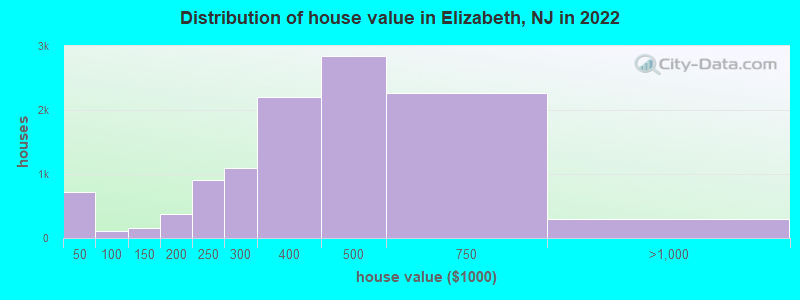
Estimated median house or condo value in 2022: $450,800 (it was $154,600 in 2000 )
Elizabeth:
$450,800New Jersey:
$428,900
Lower value quartile - upper value quartile: $317,900 - $606,900Mean price in 2022: Detached houses: $407,908 Here:
$407,908State:
$537,591
Townhouses or other attached units: $314,027 Here:
$314,027State:
$381,113
In 2-unit structures: $506,175 Here:
$506,175State:
$444,476
In 3-to-4-unit structures: $403,483 Here:
$403,483State:
$457,463
In 5-or-more-unit structures: $274,356 Here:
$274,356State:
$368,745
Total population: 128,705 (Urban population: 120,568, Rural population: 0)
Houses: 49,932 (47,280 occupied: 11,598 owner occupied, 35,682 renter occupied )
% of renters here:
75%State:
35%
Housing density: 4,086 houses/condos per square mile
Median price asked for vacant for-sale houses and condos in 2022: $383,716.
Median contract rent in 2022: $1,240 (lower quartile is $973, upper quartile is $1,580)
Median rent asked for vacant for-rent units in 2022: $1,443
Median gross rent in Elizabeth, NJ in 2022: $1,391
Housing units in Elizabeth with a mortgage: 6,457 (268 second mortgage, 5 home equity loan, 210 both second mortgage and home equity loan )Houses without a mortgage: 288
Median household income for houses/condos with a mortgage: $123,504
Median household income for apartments without a mortgage: $67,119
Median monthly housing costs: $1,471
Data:
Median house or condo value ($)
Median house or condo value ($ change since 2000)
Median house or condo value ($) - White
Median house or condo value ($) - Black or African American
Median house or condo value ($) - Asian
Median house or condo value ($) - Hispanic or Latino
Median house or condo value ($) - American Indian and Alaska Native
Median house or condo value ($) - Multirace
Median house or condo value ($) - Other Race
Median price asked for mobile homes ($)
Household density (households per square mile)
Mean house or condo value by units in structure - 1, detached ($)
Mean house or condo value by units in structure - 1, attached ($)
Mean house or condo value by units in structure - 2 ($)
Mean house or condo value by units in structure by units in structure - 3 or 4 ($)
Mean house or condo value by units in structure - 5 or more ($)
Mean house or condo value by units in structure - Boat, RV, van, etc. ($)
Mean house or condo value by units in structure - Mobile home ($)
Median contract rent ($)
Median contract rent - Lower quartile ($)
Median contract rent - Upper quartile ($)
Median gross rent ($)
Urban houses (%)
Rural houses (%)
Houses occupied (%)
Houses occupied (% change since 2000)
Houses owner occupied (%)
Houses owner occupied (% change since 2000)
Houses renter occupied (%)
Houses renter occupied (% change since 2000)
Vacant housing units - For rent (%)
Vacant housing units - For rent (% change since 2000)
Vacant housing units - For sale only (%)
Vacant housing units - For sale only (% change since 2000)
Vacant housing units - Rented or sold, not occupied (%)
Vacant housing units - Rented or sold, not occupied (% change since 2000)
Vacant housing units - For seasonal, recreational, or occasional use (%)
Vacant housing units - For seasonal, recreational, or occasional use (% change since 2000)
Vacant housing units - For migrant workers (%)
Vacant housing units - For migrant workers (% change since 2000)
Vacant housing units - Other vacant (%)
Vacant housing units - Other vacant (% change since 2000)
Median monthly housing costs ($)
Median household income for houses/condos with a mortgage ($)
Median household income for houses/condos without a mortgage ($)
Median household income ($)
Median household income ($) - White
Median household income ($) - Black or African American
Median household income ($) - Asian
Median household income ($) - Hispanic or Latino
Median household income ($) - American Indian and Alaska Native
Median household income ($) - Multirace
Median household income ($) - Other Race
Mortgage status - with mortgage (%)
Mortgage status - with second mortgage (%)
Mortgage status - with home equity loan (%)
Mortgage status - with both second mortgage and home equity loan (%)
Mortgage status - without a mortgage (%)
Median year house/condo built
Median year apartment built
Household type by relationship - Male householder living alone (%)
Household type by relationship - Male householder not living alone (%)
Household type by relationship - Female householder living alone (%)
Household type by relationship - Female householder not living alone (%)
Household type by relationship - Opposite-Sex spouse (%)
Household type by relationship - Same-Sex spouse (%)
Household type by relationship - Opposite-Sex unmarried partner (%)
Household type by relationship - Same-Sex unmarried partner (%)
Household type by relationship - In group quarters (%)
Size of family households - 2-person household (%)
Size of family households - 3-person household (%)
Size of family households - 4-person household (%)
Size of family households - 5-person household (%)
Size of family households - 6-person household (%)
Size of family households - 7-or-more-person household (%)
Size of nonfamily households - 1-person household (%)
Size of nonfamily households - 2-person household (%)
Size of nonfamily households - 3-person household (%)
Size of nonfamily households - 4-person household (%)
Size of nonfamily households - 5-person household (%)
Size of nonfamily households - 6-person household (%)
Size of nonfamily households - 7-or-moreperson household (%)
Year house built - Built 2010 or later (%)
Year house built - Built 2000 to 2009 (%)
Year house built - Built 1990 to 1999 (%)
Year house built - Built 1980 to 1989 (%)
Year house built - Built 1970 to 1979 (%)
Year house built - Built 1960 to 1969 (%)
Year house built - Built 1950 to 1959 (%)
Year house built - Built 1940 to 1949 (%)
Year house built - Built 1939 or earlier (%)
Median number of rooms in houses and condos
Median number of rooms in apartments
Median number of bedrooms in owner occupied houses
Mean number of bedrooms in owner occupied houses
Median number of bedrooms in renter occupied houses
Mean number of bedrooms in renter occupied houses
Median number of vehichles in owner occupied houses
Mean number of vehichles in owner occupied houses
Median number of vehichles in renter occupied houses
Mean number of vehichles in renter occupied houses
Rooms in owner-occupied houses - 1 room (%)
Rooms in owner-occupied houses - 2 rooms (%)
Rooms in owner-occupied houses - 3 rooms (%)
Rooms in owner-occupied houses - 4 rooms (%)
Rooms in owner-occupied houses - 5 rooms (%)
Rooms in owner-occupied houses - 6 rooms (%)
Rooms in owner-occupied houses - 7 rooms (%)
Rooms in owner-occupied houses - 8 rooms (%)
Rooms in owner-occupied houses - 9+ rooms (%)
Rooms in renter-occupied houses - 1 room (%)
Rooms in renter-occupied houses - 2 rooms (%)
Rooms in renter-occupied houses - 3 rooms (%)
Rooms in renter-occupied houses - 4 rooms (%)
Rooms in renter-occupied houses - 5 rooms (%)
Rooms in renter-occupied houses - 6 rooms (%)
Rooms in renter-occupied houses - 7 rooms (%)
Rooms in renter-occupied houses - 8 rooms (%)
Rooms in renter-occupied houses - 9+ rooms (%)
Bedrooms in owner-occupied houses - no bedrooms (%)
Bedrooms in owner-occupied houses - 1 bedroom (%)
Bedrooms in owner-occupied houses - 2 bedrooms (%)
Bedrooms in owner-occupied houses - 3 bedrooms (%)
Bedrooms in owner-occupied houses - 4 bedrooms (%)
Bedrooms in owner-occupied houses - 5+ bedrooms (%)
Bedrooms in renter-occupied houses - no bedrooms (%)
Bedrooms in renter-occupied houses - 1 bedroom (%)
Bedrooms in renter-occupied houses - 2 bedrooms (%)
Bedrooms in renter-occupied houses - 3 bedrooms (%)
Bedrooms in renter-occupied houses - 4 bedrooms (%)
Bedrooms in renter-occupied houses - 5+ bedrooms (%)
Vehicles available in owner-occupied houses - no vehicle available (%)
Vehicles available in owner-occupied houses - 1 vehicle available(%)
Vehicles available in owner-occupied houses - 2 Vehicles available (%)
Vehicles available in owner-occupied houses - 3 Vehicles available (%)
Vehicles available in owner-occupied houses - 4 Vehicles available (%)
Vehicles available in owner-occupied houses - 5+ Vehicles available (%)
Vehicles available in renter-occupied houses - no vehicle available (%)
Vehicles available in renter-occupied houses - 1 vehicle available (%)
Vehicles available in renter-occupied houses - 2 Vehicles available (%)
Vehicles available in renter-occupied houses - 3 Vehicles available (%)
Vehicles available in renter-occupied houses - 4 Vehicles available (%)
Vehicles available in renter-occupied houses - 5+ Vehicles available (%)
Housing units in structures - 1, detached (%)
Housing units in structures - 1, attached (%)
Housing units in structures - 2 (%)
Housing units in structures - 3 or 4 (%)
Housing units in structures - 5 to 9 (%)
Housing units in structures - 10 to 19 (%)
Housing units in structures - 20 to 49 (%)
Housing units in structures - 50 or more (%)
Housing units in structures - Mobile home (%)
Housing units in structures - Boat, RV, van, etc. (%)
Housing units in structures - Owners - 1, detached (%)
Housing units in structures - Owners - 1, attached (%)
Housing units in structures - Owners - 2 (%)
Housing units in structures - Owners - 3 or 4 (%)
Housing units in structures - Owners - 5 to 9 (%)
Housing units in structures - Owners - 10 to 19 (%)
Housing units in structures - Owners - 20 to 49 (%)
Housing units in structures - Owners - 50 or more (%)
Housing units in structures - Owners - Mobile home (%)
Housing units in structures - Owners - Boat, RV, van, etc. (%)
Housing units in structures - Renters - 1, detached (%)
Housing units in structures - Renters - 1, attached (%)
Housing units in structures - Renters - 2 (%)
Housing units in structures - Renters - 3 or 4 (%)
Housing units in structures - Renters - 5 to 9 (%)
Housing units in structures - Renters - 10 to 19 (%)
Housing units in structures - Renters - 20 to 49 (%)
Housing units in structures - Renters - 50 or more (%)
Housing units in structures - Renters - Mobile home (%)
Housing units in structures - Renters - Boat, RV, van, etc. (%)
House/condo owner moved in on average (years ago)
Renter moved in on average (years ago)
Year householder moved into unit - Moved in 1999 to March 2000 (%)
Year householder moved into unit - Moved in 1999 to March 2000 (%) - White
Year householder moved into unit - Moved in 1999 to March 2000 (%) - Black or African American
Year householder moved into unit - Moved in 1999 to March 2000 (%) - Asian
Year householder moved into unit - Moved in 1999 to March 2000 (%) - Hispanic or Latino
Year householder moved into unit - Moved in 1999 to March 2000 (%) - American Indian and Alaska Native
Year householder moved into unit - Moved in 1999 to March 2000 (%) - Multirace
Year householder moved into unit - Moved in 1999 to March 2000 (%) - Other Race
Year householder moved into unit - Moved in 1995 to 1998 (%)
Year householder moved into unit - Moved in 1995 to 1998 (%) - White
Year householder moved into unit - Moved in 1995 to 1998 (%) - Black or African American
Year householder moved into unit - Moved in 1995 to 1998 (%) - Asian
Year householder moved into unit - Moved in 1995 to 1998 (%) - Hispanic or Latino
Year householder moved into unit - Moved in 1995 to 1998 (%) - American Indian and Alaska Native
Year householder moved into unit - Moved in 1995 to 1998 (%) - Multirace
Year householder moved into unit - Moved in 1995 to 1998 (%) - Other Race
Year householder moved into unit - Moved in 1990 to 1994 (%)
Year householder moved into unit - Moved in 1990 to 1994 (%) - White
Year householder moved into unit - Moved in 1990 to 1994 (%) - Black or African American
Year householder moved into unit - Moved in 1990 to 1994 (%) - Asian
Year householder moved into unit - Moved in 1990 to 1994 (%) - Hispanic or Latino
Year householder moved into unit - Moved in 1990 to 1994 (%) - American Indian and Alaska Native
Year householder moved into unit - Moved in 1990 to 1994 (%) - Multirace
Year householder moved into unit - Moved in 1990 to 1994 (%) - Other Race
Year householder moved into unit - Moved in 1980 to 1989 (%)
Year householder moved into unit - Moved in 1980 to 1989 (%) - White
Year householder moved into unit - Moved in 1980 to 1989 (%) - Black or African American
Year householder moved into unit - Moved in 1980 to 1989 (%) - Asian
Year householder moved into unit - Moved in 1980 to 1989 (%) - Hispanic or Latino
Year householder moved into unit - Moved in 1980 to 1989 (%) - American Indian and Alaska Native
Year householder moved into unit - Moved in 1980 to 1989 (%) - Multirace
Year householder moved into unit - Moved in 1980 to 1989 (%) - Other Race
Year householder moved into unit - Moved in 1970 to 1979 (%)
Year householder moved into unit - Moved in 1970 to 1979 (%) - White
Year householder moved into unit - Moved in 1970 to 1979 (%) - Black or African American
Year householder moved into unit - Moved in 1970 to 1979 (%) - Asian
Year householder moved into unit - Moved in 1970 to 1979 (%) - Hispanic or Latino
Year householder moved into unit - Moved in 1970 to 1979 (%) - American Indian and Alaska Native
Year householder moved into unit - Moved in 1970 to 1979 (%) - Multirace
Year householder moved into unit - Moved in 1970 to 1979 (%) - Other Race
Year householder moved into unit - Moved in 1969 or earlier (%)
Year householder moved into unit - Moved in 1969 or earlier (%) - White
Year householder moved into unit - Moved in 1969 or earlier (%) - Black or African American
Year householder moved into unit - Moved in 1969 or earlier (%) - Asian
Year householder moved into unit - Moved in 1969 or earlier (%) - Hispanic or Latino
Year householder moved into unit - Moved in 1969 or earlier (%) - American Indian and Alaska Native
Year householder moved into unit - Moved in 1969 or earlier (%) - Multirace
Year householder moved into unit - Moved in 1969 or earlier (%) - Other Race
Housing units lacking complete plumbing facilities (%)
Housing units lacking complete kitchen facilities (%)
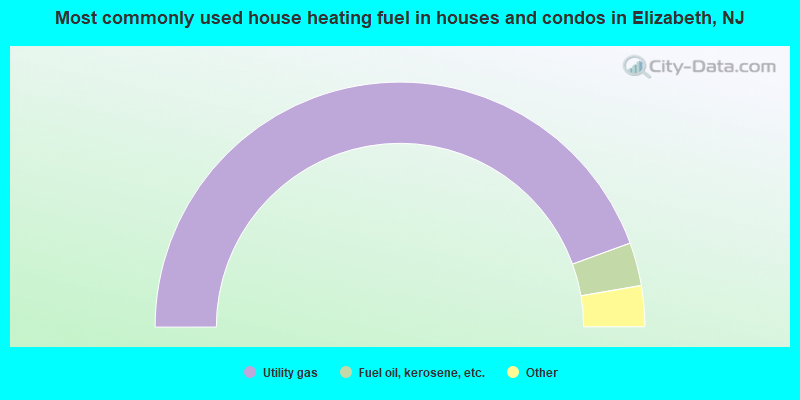
House heating fuel used in houses and condos - Utility gas (%)
House heating fuel used in houses and condos - Bottled, tank, or LP gas (%)
House heating fuel used in houses and condos - Electricity (%)
House heating fuel used in houses and condos - Fuel oil, kerosene, etc. (%)
House heating fuel used in houses and condos - Coal or coke (%)
House heating fuel used in houses and condos - Wood (%)
House heating fuel used in houses and condos - Solar energy (%)
House heating fuel used in houses and condos - Other fuel (%)
House heating fuel used in houses and condos - No fuel used (%)
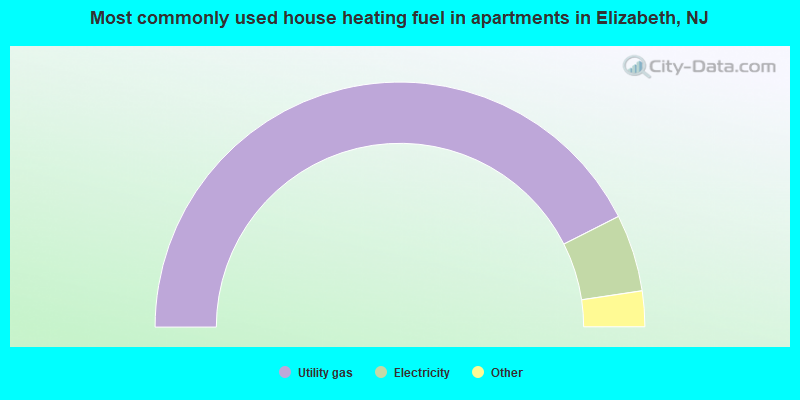
House heating fuel used in apartments - Utility gas (%)
House heating fuel used in apartments - Bottled, tank, or LP gas (%)
House heating fuel used in apartments - Electricity (%)
House heating fuel used in apartments - Fuel oil, kerosene, etc. (%)
House heating fuel used in apartments - Coal or coke (%)
House heating fuel used in apartments - Wood (%)
House heating fuel used in apartments - Solar energy (%)
House heating fuel used in apartments - Other fuel (%)
House heating fuel used in apartments - No fuel used (%)
Latest news about housing in Elizabeth, NJ collected exclusively by city-data.com from local newspapers, TV, and radio stations
Median year house/condo built: 1948Median year apartment built: 1965Household type by relationship:
Households: 134,274
Male householders: 25,574 (5,055 living alone ), Female householders: 21,706 (4,880 living alone )19,641 spouses (19,498 opposite-sex spouses ), 7,090 unmarried partners , (6,805 opposite-sex unmarried partners ), 42,165 children (40,136 natural , 575 adopted , 1,454 stepchildren ), 852 grandchildren , 2,193 brothers or sisters , 2,893 parents , 161 foster children , 5,375 other relatives , 5,298 non-relatives In group quarters: 1,326
Size of family households: 9,384 2-persons , 8,304 3-persons , 8,053 4-persons , 4,139 5-persons , 1,790 6-persons , 1,156 7-or-more-persons .
Size of nonfamily households: 9,935 1-person , 4,139 2-persons , 159 3-persons , 132 4-persons , 89 5-persons .
15,639 married couples with children. single-parent households (6,645 men , 7,594 women ).
23.1% of residents of Elizabeth speak English at home. of residents speak Spanish at home (35% speak English very well , 18% speak English well , 28% speak English not well , 18% don't speak English at all ).of residents speak other Indo-European language at home (46% speak English very well , 26% speak English well , 21% speak English not well , 7% don't speak English at all ).of residents speak Asian or Pacific Island language at home (56% speak English very well , 35% speak English well , 9% speak English not well ).of residents speak other language at home (63% speak English very well , 25% speak English well , 11% speak English not well , 1% don't speak English at all ).
Foreign born population: 71,390 (53.2%)of them are naturalized citizens )
Median number of rooms in houses and condos:
Median number of rooms in apartments
Owner-occupied Renter-occupied
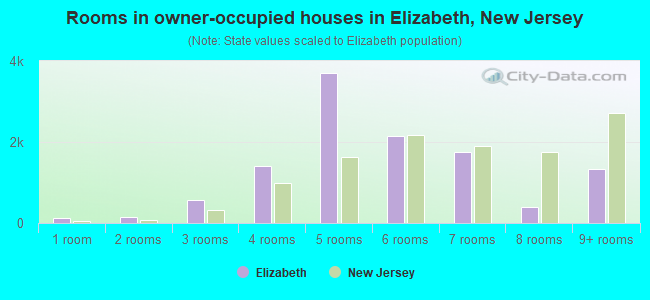
Rooms in owner-occupied houses in Elizabeth, New Jersey
127 1 room 153 2 rooms 559 3 rooms 1,410 4 rooms 3,713 5 rooms 2,143 6 rooms 1,757 7 rooms 404 8 rooms 1,332 9+ rooms
Rooms in renter-occupied apartments in Elizabeth, New Jersey
2,346 1 room 2,446 2 rooms 6,495 3 rooms 10,222 4 rooms 10,664 5 rooms 2,223 6 rooms 940 7 rooms 68 8 rooms 278 9+ rooms
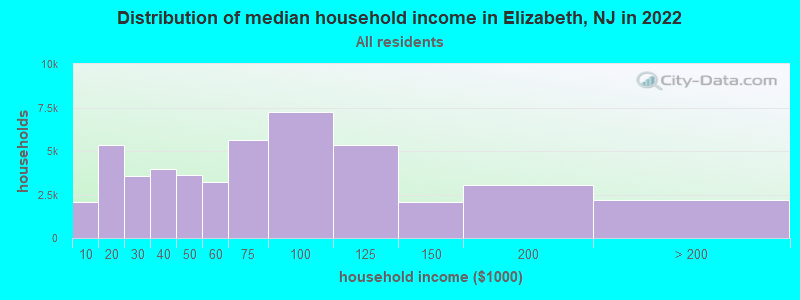
Elizabeth, NJ household income distribution 2,081 Less than $10,0005,329 $10,000 to $19,9993,553 $20,000 to $29,9993,939 $30,000 to $39,9993,604 $40,000 to $49,9993,240 $50,000 to $59,9995,652 $60,000 to $74,9997,255 $75,000 to $99,9995,343 $100,000 to $124,9992,088 $125,000 to $149,9993,027 $150,000 to $199,9992,169 $200,000 or more
Home value of owner - occupied houses in 2022 in Elizabeth, NJ 429 Less than $10,00035 $10,000 to $14,99950 $15,000 to $19,999104 $25,000 to $29,99991 $40,000 to $49,99915 $80,000 to $89,99968 $100,000 to $124,99995 $125,000 to $149,999107 $150,000 to $174,999259 $175,000 to $199,999912 $200,000 to $249,9991,091 $250,000 to $299,9992,196 $300,000 to $399,9992,840 $400,000 to $499,9992,266 $500,000 to $749,999264 $750,000 to $999,99934 $1,000,000 to $1,499,999Rent paid by renters in 2022 in Elizabeth, NJ 163 Less than $100167 $100 to $149141 $150 to $199419 $200 to $249232 $250 to $299297 $300 to $349198 $350 to $39987 $400 to $44964 $450 to $499236 $500 to $54973 $550 to $599464 $600 to $649281 $650 to $699141 $700 to $749577 $750 to $7991,704 $800 to $8993,233 $900 to $9997,631 $1,000 to $1,2497,863 $1,250 to $1,4997,343 $1,500 to $1,9991,821 $2,000 to $2,499319 $2,500 to $2,999583 No cash rent
Percentage of workers working in this county: 61.1%Number of people working at home: 3,538 (5.7% of all workers )
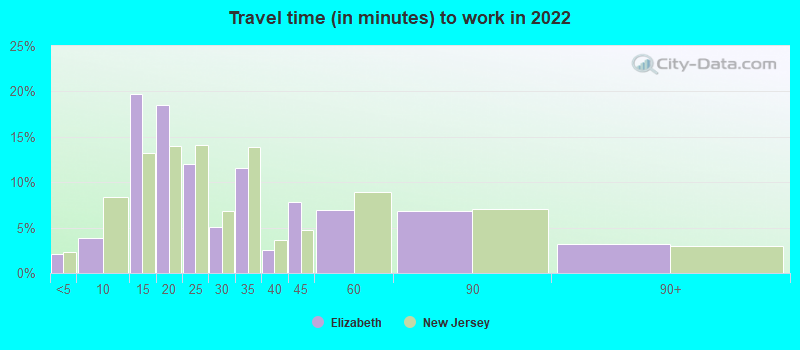
Travel time to work (commute)
Less than 5 minutes: 1,2105 to 9 minutes: 2,63910 to 14 minutes: 10,53115 to 19 minutes: 9,70920 to 24 minutes: 6,72625 to 29 minutes: 4,32630 to 34 minutes: 6,78235 to 39 minutes: 1,63540 to 44 minutes: 4,74845 to 59 minutes: 3,74260 to 89 minutes: 4,21690 or more minutes: 2,250
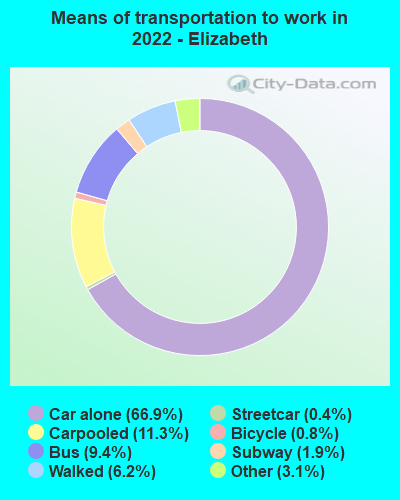
Means of transportation to work:
Drove a car alone: 32,143 (62.3%)Carpooled: 5,414 (10.5%)Bus : 4,526 (8.8%)Subway or elevated rail : 197 (0.4%)Long-distance train or commuter rail : 907 (1.8%)Taxi: 1,467 (2.8%)Bicycle: 394 (0.8%)Walked: 2,971 (5.8%)Worked at home: 3,538 (6.9%)
Unemployment by race in 2022
Unemployment rate for White non-Hispanic residents 7.5% Males19.9% FemalesUnemployment rate for Black residents 4.5% Males8.8% FemalesUnemployment rate for American Indian and Alaska Native residents 14.2% FemalesUnemployment rate for Asian residents 2.9% Males6.2% FemalesUnemployment rate for other race residents 2.8% Males6.3% FemalesUnemployment rate for two or more race residents 4.5% Males12.6% FemalesUnemployment rate for Hispanic or Latino residents 2.3% Males8.1% Females
Year of entry for the foreign-born population in Elizabeth, New Jersey
30,958 2010 or later 17,607 2000 to 2009 12,063 1990 to 1999 16,174 1980 to 1989 7,489 1970 to 1979 5,521 Before 1970
First ancestries reported:
Portuguese: 4,003 (4.0%)
Haitian: 3,370 (3.4%)
Brazilian: 2,757 (2.7%)
Italian: 1,537 (1.5%)
American: 1,526 (1.5%)
Jamaican: 887 (0.9%)
Ghanaian: 763 (0.8%)
Polish: 726 (0.7%)
Egyptian: 561 (0.6%)
African: 461 (0.5%)
Irish: 431 (0.4%)
Guyanese: 335 (0.3%)
Syrian: 312 (0.3%)
Trinidadian and Tobagonian: 294 (0.3%)
Nigerian: 244 (0.2%)
German: 230 (0.2%)
Barbadian: 208 (0.2%)
Turkish: 134 (0.1%)
Greek: 133 (0.1%)
Afghan: 130 (0.1%)
European: 110 (0.1%)
Hungarian: 109 (0.1%)
Albanian: 97 (0.10%)
Jordanian: 88 (0.09%)
Russian: 85 (0.08%)
Palestinian: 72 (0.07%)
Eastern European: 62 (0.06%)
West Indian: 56 (0.06%)
Ukrainian: 55 (0.05%)
Cypriot: 46 (0.05%)
British West Indian: 41 (0.04%)
Romanian: 40 (0.04%)
Moroccan: 40 (0.04%)
Sudanese: 32 (0.03%)
Dutch: 25 (0.02%)
Austrian: 24 (0.02%)
Slovak: 23 (0.02%)
Norwegian: 22 (0.02%)
Arab: 19 (0.02%)
Swedish: 16 (0.02%)
Carpatho Rusyn: 15 (0.01%)
English: 13 (0.01%)
Senegalese: 13 (0.01%)
Iranian: 11 (0.01%)
Basque: 11 (0.01%)
Kenyan: 8 (0.01%)
Scotch-Irish: 7 (0.01%)
Most common places of birth for foreign-born residents (%): Colombia Elizabeth:
16.5% (11,173)New Jersey:
4.2% (90,817)
Dominican Republic Elizabeth:
13.1% (8,929)New Jersey:
9.7% (209,055)
Ecuador Elizabeth:
10.8% (7,305)New Jersey:
4.4% (95,275)
El Salvador Elizabeth:
10.3% (6,983)New Jersey:
2.3% (48,885)
Cuba Elizabeth:
5.9% (4,023)New Jersey:
2.1% (45,435)
Peru Elizabeth:
5.8% (3,963)New Jersey:
2.7% (58,563)
Portugal Elizabeth:
4.4% (2,967)New Jersey:
1.3% (28,871)
Mexico Elizabeth:
4.2% (2,822)New Jersey:
4.8% (102,527)
Brazil Elizabeth:
4.1% (2,775)New Jersey:
2.1% (46,020)
Haiti Elizabeth:
4.0% (2,729)New Jersey:
2.3% (49,491)
Honduras Elizabeth:
3.3% (2,245)New Jersey:
1.7% (37,335)
Guatemala Elizabeth:
2.2% (1,466)New Jersey:
2.2% (46,813)
Uruguay Elizabeth:
2.1% (1,414)New Jersey:
0.3% (6,972)
Place of birth for U.S.-born residents:
This state: 45,461Other state: 11,560Northeast: 8,326Midwest: 546South: 2,449West: 239 90.5% of Elizabeth residents lived in the same house 1 years ago.
Out of people who lived in different houses, 39.9% lived in this county.
Out of people who lived in different counties, 57.4% lived in New Jersey.
Elizabeth:
90.5%State average:
90.4%
Education attainment for males 25 years and older:
No schooling: 2,111Nursery to 4th grade: 2,2305th and 6th grade: 2,2087th and 8th grade: 1,5009th grade: 2,12510th grade: 1,14811th grade: 1,97212th grade, no diploma: 1,569High school graduate (or equivalency): 17,409Less than 1 year of college: 1,619Some college more than 1 year, no degree: 6,007Associate degree: 1,339Bachelor's degree: 3,494Master's degree: 1,113Professional school degree: 558Doctorate degree: 0
Education attainment for females 25 years and older:
No schooling: 2,141Nursery to 4th grade: 1,7115th and 6th grade: 8167th and 8th grade: 1,8989th grade: 2,92510th grade: 75711th grade: 1,46612th grade, no diploma: 1,577High school graduate (or equivalency): 15,008Less than 1 year of college: 1,757Some college more than 1 year, no degree: 4,945Associate degree: 2,042Bachelor's degree: 4,615Master's degree: 1,181Professional school degree: 194Doctorate degree: 212
Housing units in structures:
One, detached: 7,264One, attached: 3,498Two: 15,0713 or 4: 7,0805 to 9: 2,33510 to 19: 5,00020 to 49: 5,43350 or more: 4,006Mobile homes: 245Housing units lacking complete plumbing facilities in 2022: 2.2%Housing units lacking complete kitchen facilities in 2022: 3.5%House/condo owner moved in on average 13 years ago
Renter moved in on average 5 years ago
Private vs. public school enrollment:
Students in private schools in grades 1 to 8 (elementary and middle school): 138 Here:
1.0%New Jersey:
12.3%
Students in private schools in grades 9 to 12 (high school): 330 Here:
4.6%New Jersey:
13.1%
Students in private undergraduate colleges: 924 Here:
24.4%New Jersey:
33.2%