Races in Elizabeth, New Jersey (NJ) Detailed Stats
Data:
Races - White alone (%)
Races - White alone (% change since 2000)
Races - Black alone (%)
Races - Black alone (% change since 2000)
Races - American Indian alone (%)
Races - American Indian alone (% change since 2000)
Races - Asian alone (%)
Races - Asian alone (% change since 2000)
Races - Hispanic (%)
Races - Hispanic (% change since 2000)
Races - Native Hawaiian and Other Pacific Islander alone (%)
Races - Native Hawaiian and Other Pacific Islander alone (% change since 2000)
Races - Two or more races(%)
Races - Two or more races(% change since 2000)
Races - Other race alone (%)
Races - Other race alone (% change since 2000)
Racial diversity
Place of birth - Born in state of residence (%)
Place of birth - Born in state of residence (%) - White
Place of birth - Born in state of residence (%) - Black or African American
Place of birth - Born in state of residence (%) - Asian
Place of birth - Born in state of residence (%) - Hispanic or Latino
Place of birth - Born in state of residence (%) - American Indian and Alaska Native
Place of birth - Born in state of residence (%) - Multirace
Place of birth - Born in state of residence (%) - Other Race
Place of birth - Born in other state (%)
Place of birth - Born in other state (%) - White
Place of birth - Born in other state (%) - Black or African American
Place of birth - Born in other state (%) - Asian
Place of birth - Born in other state (%) - Hispanic or Latino
Place of birth - Born in other state (%) - American Indian and Alaska Native
Place of birth - Born in other state (%) - Multirace
Place of birth - Born in other state (%) - Other Race
Place of birth - Native, outside of US (%)
Place of birth - Native, outside of US (%) - White
Place of birth - Native, outside of US (%) - Black or African American
Place of birth - Native, outside of US (%) - Asian
Place of birth - Native, outside of US (%) - Hispanic or Latino
Place of birth - Native, outside of US (%) - American Indian and Alaska Native
Place of birth - Native, outside of US (%) - Multirace
Place of birth - Native, outside of US (%) - Other Race
Place of birth - Foreign born (%)
Place of birth - Foreign born (%) - White
Place of birth - Foreign born (%) - Black or African American
Place of birth - Foreign born (%) - Asian
Place of birth - Foreign born (%) - Hispanic or Latino
Place of birth - Foreign born (%) - American Indian and Alaska Native
Place of birth - Foreign born (%) - Multirace
Place of birth - Foreign born (%) - Other Race
Residents speaking English at home (%)
Residents speaking English at home - Born in the United States (%)
Residents speaking English at home - Native, born elsewhere (%)
Residents speaking English at home - Foreign born (%)
Residents speaking Spanish at home (%)
Residents speaking Spanish at home - Born in the United States (%)
Residents speaking Spanish at home - Native, born elsewhere (%)
Residents speaking Spanish at home - Foreign born (%)
Residents speaking other language at home (%)
Residents speaking other language at home - Born in the United States (%)
Residents speaking other language at home - Native, born elsewhere (%)
Residents speaking other language at home - Foreign born (%)
Marital status - Never married (%)
Marital status - Now married (%)
Marital status - Separated (%)
Marital status - Widowed (%)
Marital status - Divorced (%)
Ancestries Reported - Arab (%)
Ancestries Reported - Czech (%)
Ancestries Reported - Danish (%)
Ancestries Reported - Dutch (%)
Ancestries Reported - English (%)
Ancestries Reported - French (%)
Ancestries Reported - French Canadian (%)
Ancestries Reported - German (%)
Ancestries Reported - Greek (%)
Ancestries Reported - Hungarian (%)
Ancestries Reported - Irish (%)
Ancestries Reported - Italian (%)
Ancestries Reported - Lithuanian (%)
Ancestries Reported - Norwegian (%)
Ancestries Reported - Polish (%)
Ancestries Reported - Portuguese (%)
Ancestries Reported - Russian (%)
Ancestries Reported - Scotch-Irish (%)
Ancestries Reported - Scottish (%)
Ancestries Reported - Slovak (%)
Ancestries Reported - Subsaharan African (%)
Ancestries Reported - Swedish (%)
Ancestries Reported - Swiss (%)
Ancestries Reported - Ukrainian (%)
Ancestries Reported - United States (%)
Ancestries Reported - Welsh (%)
Ancestries Reported - West Indian (%)
Ancestries Reported - Other (%)
Geographical mobility - Same house 1 year ago (%)
Geographical mobility - Same house 1 year ago (%) - White
Geographical mobility - Same house 1 year ago (%) - Black or African American
Geographical mobility - Same house 1 year ago (%) - Asian
Geographical mobility - Same house 1 year ago (%) - Hispanic or Latino
Geographical mobility - Same house 1 year ago (%) - American Indian and Alaska Native
Geographical mobility - Same house 1 year ago (%) - Multirace
Geographical mobility - Same house 1 year ago (%) - Other Race
Geographical mobility - Moved within same county (%)
Geographical mobility - Moved within same county (%) - White
Geographical mobility - Moved within same county (%) - Black or African American
Geographical mobility - Moved within same county (%) - Asian
Geographical mobility - Moved within same county (%) - Hispanic or Latino
Geographical mobility - Moved within same county (%) - American Indian and Alaska Native
Geographical mobility - Moved within same county (%) - Multirace
Geographical mobility - Moved within same county (%) - Other Race
Geographical mobility - Moved from different county within same state (%)
Geographical mobility - Moved from different county within same state (%) - White
Geographical mobility - Moved from different county within same state (%) - Black or African American
Geographical mobility - Moved from different county within same state (%) - Asian
Geographical mobility - Moved from different county within same state (%) - Hispanic or Latino
Geographical mobility - Moved from different county within same state (%) - American Indian and Alaska Native
Geographical mobility - Moved from different county within same state (%) - Multirace
Geographical mobility - Moved from different county within same state (%) - Other Race
Geographical mobility - Moved from different state (%)
Geographical mobility - Moved from different state (%) - White
Geographical mobility - Moved from different state (%) - Black or African American
Geographical mobility - Moved from different state (%) - Asian
Geographical mobility - Moved from different state (%) - Hispanic or Latino
Geographical mobility - Moved from different state (%) - American Indian and Alaska Native
Geographical mobility - Moved from different state (%) - Multirace
Geographical mobility - Moved from different state (%) - Other Race
Geographical mobility - Moved from abroad (%)
Geographical mobility - Moved from abroad (%) - White
Geographical mobility - Moved from abroad (%) - Black or African American
Geographical mobility - Moved from abroad (%) - Asian
Geographical mobility - Moved from abroad (%) - Hispanic or Latino
Geographical mobility - Moved from abroad (%) - American Indian and Alaska Native
Geographical mobility - Moved from abroad (%) - Multirace
Geographical mobility - Moved from abroad (%) - Other Race
Place of birth for the foreign-born population - Ireland (%)
Place of birth for the foreign-born population - Denmark (%)
Place of birth for the foreign-born population - Norway (%)
Place of birth for the foreign-born population - Sweden (%)
Place of birth for the foreign-born population - United Kingdom (%)
Place of birth for the foreign-born population - England (%)
Place of birth for the foreign-born population - Scotland (%)
Place of birth for the foreign-born population - Other Northern Europe (%)
Place of birth for the foreign-born population - Austria (%)
Place of birth for the foreign-born population - Belgium (%)
Place of birth for the foreign-born population - France (%)
Place of birth for the foreign-born population - Germany (%)
Place of birth for the foreign-born population - Netherlands (%)
Place of birth for the foreign-born population - Switzerland (%)
Place of birth for the foreign-born population - Other Western Europe (%)
Place of birth for the foreign-born population - Greece (%)
Place of birth for the foreign-born population - Italy (%)
Place of birth for the foreign-born population - Portugal (%)
Place of birth for the foreign-born population - Spain (%)
Place of birth for the foreign-born population - Other Southern Europe (%)
Place of birth for the foreign-born population - Albania (%)
Place of birth for the foreign-born population - Belarus (%)
Place of birth for the foreign-born population - Bosnia and Herzegovina (%)
Place of birth for the foreign-born population - Bulgaria (%)
Place of birth for the foreign-born population - Croatia (%)
Place of birth for the foreign-born population - Czechoslovakia (%)
Place of birth for the foreign-born population - Hungary (%)
Place of birth for the foreign-born population - Latvia (%)
Place of birth for the foreign-born population - Lithuania (%)
Place of birth for the foreign-born population - North Macedonia (Macedonia) (%)
Place of birth for the foreign-born population - Moldova (%)
Place of birth for the foreign-born population - Poland (%)
Place of birth for the foreign-born population - Romania (%)
Place of birth for the foreign-born population - Russia (%)
Place of birth for the foreign-born population - Serbia (%)
Place of birth for the foreign-born population - Ukraine (%)
Place of birth for the foreign-born population - Other Eastern Europe (%)
Place of birth for the foreign-born population - China (%)
Place of birth for the foreign-born population - Hong Kong (%)
Place of birth for the foreign-born population - Taiwan (%)
Place of birth for the foreign-born population - Japan (%)
Place of birth for the foreign-born population - Korea (%)
Place of birth for the foreign-born population - Other Eastern Asia (%)
Place of birth for the foreign-born population - Afghanistan (%)
Place of birth for the foreign-born population - Bangladesh (%)
Place of birth for the foreign-born population - India (%)
Place of birth for the foreign-born population - Iran (%)
Place of birth for the foreign-born population - Kazakhstan (%)
Place of birth for the foreign-born population - Nepal (%)
Place of birth for the foreign-born population - Pakistan (%)
Place of birth for the foreign-born population - Sri Lanka (%)
Place of birth for the foreign-born population - Uzbekistan (%)
Place of birth for the foreign-born population - Other South Central Asia (%)
Place of birth for the foreign-born population - Burma (%)
Place of birth for the foreign-born population - Cambodia (%)
Place of birth for the foreign-born population - Indonesia (%)
Place of birth for the foreign-born population - Laos (%)
Place of birth for the foreign-born population - Malaysia (%)
Place of birth for the foreign-born population - Philippines (%)
Place of birth for the foreign-born population - Singapore (%)
Place of birth for the foreign-born population - Thailand (%)
Place of birth for the foreign-born population - Vietnam (%)
Place of birth for the foreign-born population - Other South Eastern Asia (%)
Place of birth for the foreign-born population - Armenia (%)
Place of birth for the foreign-born population - Iraq (%)
Place of birth for the foreign-born population - Israel (%)
Place of birth for the foreign-born population - Jordan (%)
Place of birth for the foreign-born population - Kuwait (%)
Place of birth for the foreign-born population - Lebanon (%)
Place of birth for the foreign-born population - Saudi Arabia (%)
Place of birth for the foreign-born population - Syria (%)
Place of birth for the foreign-born population - Turkey (%)
Place of birth for the foreign-born population - Yemen (%)
Place of birth for the foreign-born population - Other Western Asia (%)
Place of birth for the foreign-born population - Eritrea (%)
Place of birth for the foreign-born population - Ethiopia (%)
Place of birth for the foreign-born population - Kenya (%)
Place of birth for the foreign-born population - Somalia (%)
Place of birth for the foreign-born population - Uganda (%)
Place of birth for the foreign-born population - Zimbabwe (%)
Place of birth for the foreign-born population - Other Eastern Africa (%)
Place of birth for the foreign-born population - Cameroon (%)
Place of birth for the foreign-born population - Congo (%)
Place of birth for the foreign-born population - Democratic Republic of Congo (Zaire) (%)
Place of birth for the foreign-born population - Other Middle Africa (%)
Place of birth for the foreign-born population - Egypt (%)
Place of birth for the foreign-born population - Morocco (%)
Place of birth for the foreign-born population - Sudan (%)
Place of birth for the foreign-born population - Other Northern Africa (%)
Place of birth for the foreign-born population - South Africa (%)
Place of birth for the foreign-born population - Other Southern Africa (%)
Place of birth for the foreign-born population - Cabo Verde (%)
Place of birth for the foreign-born population - Ghana (%)
Place of birth for the foreign-born population - Liberia (%)
Place of birth for the foreign-born population - Nigeria (%)
Place of birth for the foreign-born population - Senegal (%)
Place of birth for the foreign-born population - Sierra Leone (%)
Place of birth for the foreign-born population - Other Western Africa (%)
Place of birth for the foreign-born population - Australia (%)
Place of birth for the foreign-born population - New Zealand (%)
Place of birth for the foreign-born population - Fiji (%)
Place of birth for the foreign-born population - Micronesia (%)
Place of birth for the foreign-born population - Bahamas (%)
Place of birth for the foreign-born population - Barbados (%)
Place of birth for the foreign-born population - Cuba (%)
Place of birth for the foreign-born population - Dominica (%)
Place of birth for the foreign-born population - Dominican Republic (%)
Place of birth for the foreign-born population - Grenada (%)
Place of birth for the foreign-born population - Haiti (%)
Place of birth for the foreign-born population - Jamaica (%)
Place of birth for the foreign-born population - St. Vincent and the Grenadines (%)
Place of birth for the foreign-born population - Trinidad and Tobago (%)
Place of birth for the foreign-born population - West Indies (%)
Place of birth for the foreign-born population - Other Caribbean (%)
Place of birth for the foreign-born population - Belize (%)
Place of birth for the foreign-born population - Costa Rica (%)
Place of birth for the foreign-born population - El Salvador (%)
Place of birth for the foreign-born population - Guatemala (%)
Place of birth for the foreign-born population - Honduras (%)
Place of birth for the foreign-born population - Mexico (%)
Place of birth for the foreign-born population - Nicaragua (%)
Place of birth for the foreign-born population - Panama (%)
Place of birth for the foreign-born population - Other Central America (%)
Place of birth for the foreign-born population - Argentina (%)
Place of birth for the foreign-born population - Bolivia (%)
Place of birth for the foreign-born population - Brazil (%)
Place of birth for the foreign-born population - Chile (%)
Place of birth for the foreign-born population - Colombia (%)
Place of birth for the foreign-born population - Ecuador (%)
Place of birth for the foreign-born population - Guyana (%)
Place of birth for the foreign-born population - Peru (%)
Place of birth for the foreign-born population - Uruguay (%)
Place of birth for the foreign-born population - Venezuela (%)
Place of birth for the foreign-born population - Other South America (%)
Place of birth for the foreign-born population - Canada (%)
Place of birth for the foreign-born population - Other Northern America (%)
Place of birth for the foreign-born population - Other (%)
Latest news about races in Elizabeth, NJ collected exclusively by city-data.com from local newspapers, TV, and radio stations
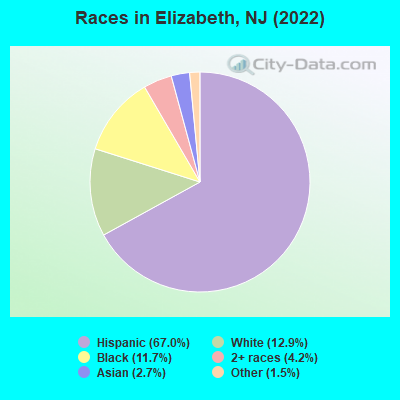
According to 2022 data, the most numerous races in Elizabeth, NJ are White alone (17,285 residents), Hispanic (89,999 residents), and Black alone (15,753 residents). 23.0% of Elizabeth residents speak English at home. 50.3% of Elizabeth, NJ residents are foreign-born (42.7% born in Latin America), which is 54.2% greater than the foreign-born rate of 23.0% across the entire state of New Jersey.
Race distribution in Elizabeth
2000 2022
59,627 49.5% Hispanic 32,338 26.8% White alone 22,329 18.5% Black alone 2,870 2.4% Two or more races 2,745 2.3% Asian alone 496 0.4% Other race alone 145 0.1% American Indian alone 18 0.01% Native Hawaiian and Other
89,999 67.0% Hispanic 17,285 12.9% White alone 15,753 11.7% Black alone 5,573 4.2% Two or more races 3,597 2.7% Asian alone 2,010 1.5% Other race alone 57 0.04% Native Hawaiian and Other
2000 2022
5,557,209 66.0% White alone 1,117,191 13.3% Hispanic 1,096,171 13.0% Black alone 477,012 5.7% Asian alone 133,689 1.6% Two or more races 19,565 0.2% Other race alone 11,338 0.1% American Indian alone 2,175 0.03% Native Hawaiian and Other
4,766,476 51.5% White alone 2,028,470 21.9% Hispanic 1,111,632 12.0% Black alone 923,546 10.0% Asian alone 332,237 3.6% Two or more races 89,847 1.0% Other race alone 8,557 0.09% American Indian alone 934 0.01% Native Hawaiian and Other
Income and house value in Elizabeth Median household income in 2022 $57,350 White non-Hispanic householders$49,081 Black householders$56,841 American Indian and Alaska Native householders$94,413 Asian householders$67,434 Some other race householders$71,820 Two or more races householders$65,037 Hispanic or Latino race householdersMedian 2022 house value $428,639 White Non-Hispanic householders$353,116 Black or African American householders $412,893 Asian householders$400,937 Native Hawaiian and other Pacific Islander householders$397,438 Some other race householders$410,560 Two or more races householders$408,227 Hispanic or Latino householders
Median age by race in Elizabeth
35.1 Median age for White residents35.0 36.0 46.7 Median age for Black or African American residents46.0 47.7 39.9 Median age for American Indian / Alaska Native residents51.3 29.7 34.0 Median age for Asian residents36.7 27.9 -666,666,666.0 Median age for Native Hawaiian / Pacific Islander residents-666,666,666.0 -666,666,666.0 36.9 Median age for Other race residents35.0 41.1 35.5 Median age for Two or more races residents38.0 34.2 39.8 Median age for White alone residents40.4 39.2 36.1 Median age for Hispanic or Latino residents35.2 38.2
Owner/renter occupied households by race in Elizabeth
House owners and renters - White residents 2,756 31.2% Owner occupied6,072 68.8% Renter occupiedHouse owners and renters - Black or African American residents 1,320 15.7% Owner occupied7,072 84.3% Renter occupiedHouse owners and renters - American Indian / Alaska Native residents 124 29.7% Owner occupied295 70.3% Renter occupiedHouse owners and renters - Asian residents 416 25.8% Owner occupied1,196 74.2% Renter occupiedHouse owners and renters - Other race residents 3,910 21.3% Owner occupied14,416 78.7% Renter occupiedHouse owners and renters - Two or more races residents 2,915 30.3% Owner occupied6,721 69.7% Renter occupiedHouse owners and renters - White alone residents 2,330 40.6% Owner occupied3,407 59.4% Renter occupiedHouse owners and renters - Hispanic or Latino residents 6,987 23.2% Owner occupied23,100 76.8% Renter occupied
Language usage in Elizabeth
English speakers - Total 23.0% of residents of Elizabeth speak English at home.
63.2% of residents speak Spanish at home 27,275 34.6% Speak English very well51,499 65.4% Speak English less than very well13.8% of residents speak other language at home 6,649 38.6% Speak English very well10,559 61.4% Speak English less than very well
English speakers - Born in the United States 63.7% of residents of Elizabeth speak English at home.
29.2% of residents speak Spanish at home 3,016 92.5% Speak English very well243 7.5% Speak English less than very well7.1% of residents speak other language at home 588 74.5% Speak English very well201 25.5% Speak English less than very well
English speakers - Native, born elsewhere 4.7% of residents of Elizabeth speak English at home.
86.2% of residents speak Spanish at home 2,965 60.0% Speak English very well1,976 40.0% Speak English less than very well9.1% of residents speak other language at home 206 39.5% Speak English very well316 60.5% Speak English less than very well
English speakers - Foreign-born 5.6% of residents of Elizabeth speak English at home.
75.0% of residents speak Spanish at home 6,769 12.9% Speak English very well45,595 87.1% Speak English less than very well19.4% of residents speak other language at home 3,799 28.0% Speak English very well9,776 72.0% Speak English less than very well
White (Caucasian) - Speak only English Native:
64.0% (8,451)Foreign-born:
1.7% (178)
White (Caucasian) - Speak another language Native:
36.0% (4,762)Foreign-born:
98.3% (10,392)
Black or African American - Speak only English Native:
88.1% (10,071)Foreign-born:
18.6% (1,060)
Black or African American - Speak another language Native:
11.9% (1,365)Foreign-born:
81.4% (4,628)
American Indian / Alaska Native - Speak another language Native:
100.0% (744)Foreign-born:
97.6% (886)
Asian - Speak only English Native:
50.6% (514)Foreign-born:
15.0% (253)
Asian - Speak another language Native:
43.8% (445)Foreign-born:
85.0% (1,433)
Other race - Speak only English Native:
11.3% (1,866)Foreign-born:
4.0% (1,393)
Other race - Speak another language Native:
88.7% (14,575)Foreign-born:
96.0% (33,523)
Two or more races - Speak only English Native:
27.3% (3,403)Foreign-born:
5.4% (854)
Two or more races - Speak another language Native:
72.7% (9,067)Foreign-born:
94.6% (14,928)
White alone - Speak only English Native:
74.1% (7,627)Foreign-born:
2.0% (115)
White alone - Speak another language Native:
25.9% (2,671)Foreign-born:
98.0% (5,704)
Hispanic or Latino - Speak only English Native:
15.0% (4,420)Foreign-born:
3.8% (2,079)
Hispanic or Latino - Speak another language Native:
85.0% (25,079)Foreign-born:
96.2% (52,354)
Foreign-born residents in Elizabeth 67,916 residents are foreign born (42.7% Latin America ).
This city:
50.3%New Jersey:
23.2%
Marital status for residents in Elizabeth Marital status - White (Caucasian) population 15 years and over
Males 41.9% Never married43.8% Now married6.5% Separated0.1% Widowed7.7% DivorcedFemales 34.1% Never married44.6% Now married4.1% Separated8.4% Widowed8.7% DivorcedWomen who gave birth in the past 12 months Now married:
86.2% (257)Unmarried:
13.8% (41)
Women who did not give birth in the past 12 months Now married:
49.1% (2,665)Unmarried:
50.9% (2,764)
Marital status - Black or African American population 15 years and over
Males 50.9% Never married29.1% Now married0.0% Separated4.6% Widowed15.4% DivorcedFemales 52.4% Never married26.6% Now married5.6% Separated4.6% Widowed10.8% DivorcedWomen who gave birth in the past 12 months Now married:
61.4% (201)Unmarried:
38.6% (126)
Women who did not give birth in the past 12 months Now married:
30.3% (1,738)Unmarried:
69.7% (4,006)
Marital status - American Indian / Alaska Native population 15 years and over
Males 64.7% Never married31.8% Now married3.4% Separated0.0% Widowed0.0% DivorcedFemales 39.3% Never married36.6% Now married12.4% Separated0.0% Widowed11.8% DivorcedWomen who gave birth in the past 12 months Now married:
100.0% (20)Unmarried:
0.0% (0)
Women who did not give birth in the past 12 months Now married:
27.8% (77)Unmarried:
72.2% (201)
Marital status - Asian population 15 years and over
Males 43.2% Never married49.7% Now married0.0% Separated3.8% Widowed3.3% DivorcedFemales 31.0% Never married48.9% Now married6.7% Separated10.6% Widowed2.8% DivorcedWomen who gave birth in the past 12 months Now married:
100.0% (33)Unmarried:
0.0% (0)
Women who did not give birth in the past 12 months Now married:
51.6% (355)Unmarried:
48.4% (333)
Marital status - Other race population 15 years and over
Males 56.6% Never married38.9% Now married0.9% Separated2.1% Widowed1.5% DivorcedFemales 43.1% Never married38.6% Now married2.8% Separated6.9% Widowed8.5% DivorcedWomen who gave birth in the past 12 months Now married:
24.0% (186)Unmarried:
76.0% (589)
Women who did not give birth in the past 12 months Now married:
38.0% (4,472)Unmarried:
62.0% (7,298)
Marital status - Two or more races population 15 years and over
Males 39.0% Never married45.5% Now married0.0% Separated4.9% Widowed10.5% DivorcedFemales 32.2% Never married48.8% Now married5.2% Separated2.7% Widowed11.1% DivorcedWomen who gave birth in the past 12 months Now married:
85.0% (261)Unmarried:
15.0% (46)
Women who did not give birth in the past 12 months Now married:
41.2% (2,716)Unmarried:
58.8% (3,874)
Marital status - White alone, not Hispanic / Latino population 15 years and over
Males 45.0% Never married44.7% Now married0.0% Separated0.1% Widowed10.2% DivorcedFemales 31.3% Never married47.8% Now married2.7% Separated7.7% Widowed10.5% DivorcedWomen who gave birth in the past 12 months Now married:
72.2% (136)Unmarried:
27.8% (53)
Women who did not give birth in the past 12 months Now married:
39.4% (1,236)Unmarried:
60.6% (1,900)
Marital status - Hispanic or Latino population 15 years and over
Males 49.8% Never married41.0% Now married2.3% Separated2.6% Widowed4.3% DivorcedFemales 40.6% Never married40.5% Now married4.0% Separated5.7% Widowed9.2% DivorcedWomen who gave birth in the past 12 months Now married:
49.4% (659)Unmarried:
50.6% (676)
Women who did not give birth in the past 12 months Now married:
38.4% (7,904)Unmarried:
61.6% (12,667)
Ancestries in Elizabeth
4,003 4.0% Portuguese3,370 3.4% Haitian2,757 2.7% Brazilian1,537 1.5% Italian1,526 1.5% American887 0.9% Jamaican763 0.8% Ghanaian726 0.7% Polish561 0.6% Egyptian461 0.5% African431 0.4% Irish335 0.3% Guyanese312 0.3% Syrian294 0.3% Trinidadian and Tobagonian244 0.2% Nigerian230 0.2% German208 0.2% Barbadian134 0.1% Turkish133 0.1% Greek130 0.1% Afghan110 0.1% European109 0.1% Hungarian97 0.10% Albanian88 0.09% Jordanian85 0.08% Russian72 0.07% Palestinian62 0.06% Eastern European56 0.06% West Indian55 0.05% Ukrainian46 0.05% Cypriot41 0.04% British West Indian40 0.04% Romanian40 0.04% Moroccan32 0.03% Sudanese25 0.02% Dutch24 0.02% Austrian23 0.02% Slovak22 0.02% Norwegian19 0.02% Arab16 0.02% Swedish15 0.01% Carpatho Rusyn13 0.01% English13 0.01% Senegalese11 0.01% Iranian11 0.01% Basque8 0.01% Kenyan7 0.01% Scotch-Irish
Geographical mobility in Elizabeth Same house 1 year ago 23,913 91.6% White (Caucasian)20,989 91.0% Black or African American1,527 92.4% American Indian / Alaska Native2,501 83.4% Asian49,368 91.5% Other race28,361 93.5% Two or more races16,099 94.6% White alone, not Hispanic / Latino81,466 91.6% Hispanic or LatinoMoved within same county 376 1.4% White / Caucasian1,250 5.4% Black or African American62 3.7% American Indian / Alaska Native146 4.9% Asian10 94.6% Native Hawaiian / Pacific Islander1,492 2.8% Other race1,025 3.4% Two or more races66 0.4% White alone, not Hispanic / Latino3,052 3.4% Hispanic or LatinoMoved within same state 699 2.7% White / Caucasian494 2.1% Black or African American36 2.2% American Indian / Alaska Native155 5.2% Asian385 0.7% Other race11 0.0% Two or more races81 0.5% White alone, not Hispanic / Latino823 0.9% Hispanic or LatinoMoved from different state 356 1.4% White / Caucasian275 1.2% Black or African American127 4.2% Asian567 1.9% Two or more races237 1.4% White alone, not Hispanic / Latino218 0.2% Hispanic or LatinoMoved from abroad 768 2.9% White261 1.1% Black or African American3 0.2% American Indian / Alaska Native71 2.4% Asian2,707 5.0% Other race382 1.3% Two or more races543 3.2% White alone, not Hispanic / Latino3,368 3.8% Hispanic or Latino
Children Nativity (place of birth) in Elizabeth
Children under 6 years - Living with two parents Both parents native 781 100.0% NativeBoth parents foreign-born 2,499 71.1% Native1,018 28.9% Foreign-bornOne native, one foreign-born parent 985 100.0% NativeChildren under 6 years - Living with one parent Native parent 2,562 100.0% NativeForeign-born parent 2,757 88.8% Native347 11.2% Foreign-bornChildren 6 to 17 years - Living with two parents Both parents native 938 100.0% NativeBoth parents foreign-born 4,541 60.8% Native2,929 39.2% Foreign-bornOne native, one foreign-born parent 2,209 100.0% NativeChildren 6 to 17 years - Living with one parent Native parent 2,171 100.0% NativeForeign-born parent 5,531 58.3% Native3,949 41.7% Foreign-born
Place of birth for residents in Elizabeth 58,967 Americas58,861 Latin America26,701 South America17,101 Caribbean15,058 Central America4,582 Europe3,796 Southern Europe2,323 Africa2,023 Asia1,103 South Central Asia968 Western Africa639 Northern Africa605 Eastern Europe586 Western Asia245 Middle Africa213 South Eastern Asia109 Western Europe105 Northern America102 Eastern Africa98 Eastern Asia70 Northern Europe54 Southern Africa37 China20 Oceania20 Australia and New Zealand Subregion10,637 Colombia8,885 Dominican Republic6,976 El Salvador6,681 Ecuador4,195 Cuba4,082 Peru3,022 Portugal2,853 Haiti2,699 Mexico2,563 Brazil2,403 Honduras1,386 Guatemala1,159 Uruguay835 Costa Rica737 Venezuela696 Jamaica531 Nicaragua529 India449 Egypt445 Ghana400 Italy393 Argentina361 Poland326 Spain305 Guyana294 Syria230 Nigeria224 Trinidad and Tobago208 Philippines205 Panama169 Afghanistan161 Turkey159 Democratic Republic of Congo (Zaire)144 Bangladesh140 Pakistan140 Barbados138 Azores Islands132 Chile105 Canada104 Ivory Coast93 Sri Lanka88 Sudan77 Germany76 Algeria66 Togo56 Israel54 South Africa54 Russia51 Korea49 St. Vincent and the Grenadines46 Greece41 Hungary39 Lebanon36 China35 Romania32 England31 Ireland30 Albania25 Morocco23 Ukraine23 Czechoslovakia20 Australia18 Kenya18 Senegal18 Grenada17 United Arab Emirates15 Uzbekistan15 Belarus14 Netherlands13 Belgium10 Iran9 Japan6 Congo6 United Kingdom5 France4 Indonesia2 Uganda2 Moldova1 Vietnam1 Taiwan1 Tanzania
Grandparents responsible for own grandchildren in Elizabeth
Grandparents (30 to 59 years) White / Caucasian 20 14.3% Responsible for grandchildren121 85.7% Not responsible for grandchildrenBlack or African American 69 19.3% Responsible for grandchildren288 80.7% Not responsible for grandchildrenOther race 322 50.5% Responsible for grandchildren316 49.5% Not responsible for grandchildrenTwo or more races 120 55.4% Responsible for grandchildren97 44.6% Not responsible for grandchildrenWhite alone, not Hispanic / Latino 33 100.0% Not responsible for grandchildrenHispanic or Latino 158 18.8% Responsible for grandchildren684 81.2% Not responsible for grandchildrenGrandparents (60 years and over) White / Caucasian 19 3.8% Responsible for grandchildren477 96.2% Not responsible for grandchildrenBlack or African American 113 21.7% Responsible for grandchildren409 78.3% Not responsible for grandchildrenOther race 38 3.1% Responsible for grandchildren1,178 96.9% Not responsible for grandchildrenTwo or more races 486 100.0% Not responsible for grandchildrenWhite alone, not Hispanic / Latino 21 8.7% Responsible for grandchildren224 91.3% Not responsible for grandchildrenHispanic or Latino 16 1.1% Responsible for grandchildren1,347 98.9% Not responsible for grandchildren