Dickinson, TX (Texas) Houses and Residents
| Dickinson: | $243,338 |
| Texas: | $275,400 |
Total population: 19,595 (Urban population: 16,679, Rural population: 267 (all nonfarm))
Houses: 9,364 (8,378 occupied: 6,798 owner occupied, 1,811 renter occupied)
| % of renters here: | 21% |
| State: | 38% |
Housing density: 970 houses/condos per square mile
Median price asked for vacant for-sale houses and condos in 2022: $325,256.
Median contract rent in 2022: $1,007 (lower quartile is $831, upper quartile is $1,214)
Median rent asked for vacant for-rent units in 2022: $1,165
Median gross rent in Dickinson, TX in 2022: $1,179
Housing units in Dickinson with a mortgage: 4,235 (105 second mortgage, 0 home equity loan, 48 both second mortgage and home equity loan)
Houses without a mortgage: 85
Median household income for houses/condos with a mortgage: $91,769
Median household income for apartments without a mortgage: $58,250
Median monthly housing costs: $1,340
Compare current foreclosures in Dickinson, TX:
| Photo | Address | Area | Beds / Baths | Price | Details |
|---|---|---|---|---|---|

|
#1
Wincrest
Dickinson, TX 77539
|
3,450 sq. feet
|
3 baths 4 beds |
$699,900
|
show details |

|
#2
Laurel Springs Ln
Dickinson, TX 77539
|
- sq. feet
|
2 baths 3 beds |
show details | |

|
#3
Fm 646 Rd N
Dickinson, TX 77539
|
- sq. feet
|
3 baths 4 beds |
show details | |

|
#4
Peach Mill Ln
Dickinson, TX 77539
|
- sq. feet
|
3 baths 4 beds |
show details | |

|
#5
Mammoth Springs Ln
Dickinson, TX 77539
|
1,915 sq. feet
|
2 baths 3 beds |
show details | |

|
#6
Edwards Dr
Dickinson, TX 77539
|
1,424 sq. feet
|
3 baths 4 beds |
show details | |

|
#7
Red Oak Dr
Dickinson, TX 77539
|
3,518 sq. feet
|
3 baths 5 beds |
show details | |

|
#8
2nd St
Dickinson, TX 77539
|
1,244 sq. feet
|
2 baths - beds |
show details | |

|
#9
31st St
Dickinson, TX 77539
|
1,928 sq. feet
|
2 baths - beds |
show details | |

|
#10
8th St
Dickinson, TX 77539
|
2,115 sq. feet
|
2 baths - beds |
show details |
| Photo | Address | Area | Beds / Baths | Price | Details |
|---|---|---|---|---|---|

|
#11
Avenue H
Dickinson, TX 77539
|
1,118 sq. feet
|
1 baths - beds |
show details | |

|
#12
Thistle Dr
Dickinson, TX 77539
|
1,502 sq. feet
|
2 baths - beds |
show details | |

|
#13
Brigid Ct
Dickinson, TX 77539
|
2,032 sq. feet
|
2 baths - beds |
show details | |

|
#14
Avenue H
Dickinson, TX 77539
|
1,118 sq. feet
|
1 baths - beds |
show details | |

|
#15
4th St
Dickinson, TX 77539
|
720 sq. feet
|
1 baths - beds |
show details | |

|
#16
Colony Creek Dr
Dickinson, TX 77539
|
2,328 sq. feet
|
2 baths - beds |
show details | |

|
#17
Overland Trl
Dickinson, TX 77539
|
1,171 sq. feet
|
2 baths - beds |
show details | |

|
#18
Capella Oaks Ln
Dickinson, TX 77539
|
1,433 sq. feet
|
2 baths - beds |
show details | |

|
#19
Smokey Lake Ln
Dickinson, TX 77539
|
2,880 sq. feet
|
2 baths - beds |
show details | |

|
#20
37th St
Dickinson, TX 77539
|
1,173 sq. feet
|
1 baths - beds |
show details |
| Photo | Address | Area | Beds / Baths | Price | Details |
|---|---|---|---|---|---|

|
#21
Avenue H
Dickinson, TX 77539
|
1,402 sq. feet
|
1 baths - beds |
show details | |

|
#22
Arbor Hollow Ln
Dickinson, TX 77539
|
1,373 sq. feet
|
2 baths - beds |
show details | |

|
#23
Ridgewood Ln
Dickinson, TX 77539
|
2,121 sq. feet
|
2 baths - beds |
show details | |

|
#24
River Ridge Ln
Dickinson, TX 77539
|
1,723 sq. feet
|
2 baths - beds |
show details | |

|
#25
E Bayou Dr
Dickinson, TX 77539
|
1,732 sq. feet
|
2 baths - beds |
show details | |

|
#26
Caroline St
Dickinson, TX 77539
|
1,504 sq. feet
|
2 baths - beds |
show details | |

|
#27
Live Oak Dr
Dickinson, TX 77539
|
2,299 sq. feet
|
2 baths - beds |
show details | |

|
#28
16th St
Dickinson, TX 77539
|
- sq. feet
|
- baths - beds |
show details | |

|
#29
Mammoth Springs Ln
Dickinson, TX 77539
|
1,553 sq. feet
|
- baths - beds |
show details | |

|
#30
Pepper Stone Ct
Dickinson, TX 77539
|
- sq. feet
|
- baths - beds |
show details |
| Photo | Address | Area | Beds / Baths | Price | Details |
|---|---|---|---|---|---|

|
#31
Kilgarney Keep St
Dickinson, TX 77539
|
2,673 sq. feet
|
- baths - beds |
show details | |

|
#32
Fm 517 Rd W, Apt 816
Dickinson, TX 77539
|
- sq. feet
|
- baths - beds |
show details | |

|
#33
Avenue C
Dickinson, TX 77539
|
1,960 sq. feet
|
- baths - beds |
show details | |

|
#34
Fm 517 Rd W, Apt 401
Dickinson, TX 77539
|
- sq. feet
|
- baths - beds |
show details | |

|
#35
6th St
Dickinson, TX 77539
|
- sq. feet
|
- baths - beds |
show details | |

|
#36
E Bayshore Dr
Dickinson, TX 77539
|
- sq. feet
|
- baths - beds |
show details | |

|
#37
Deats Rd Apt G5
Dickinson, TX 77539
|
- sq. feet
|
- baths - beds |
show details | |

|
#38
Farm To Market 646
Dickinson, TX 77539
|
- sq. feet
|
- baths - beds |
show details | |

|
Check over 1 million property listings on Foreclosure.com!
|
browse all offers | |||

Latest news about housing in Dickinson, TX collected exclusively by city-data.com from local newspapers, TV, and radio stations


Median year apartment built: 1983
Household type by relationship:
Households: 21,861- Male householders: 4,460 (1,259 living alone), Female householders: 3,789 (820 living alone)
4,349 spouses (4,220 opposite-sex spouses), 480 unmarried partners, (480 opposite-sex unmarried partners), 7,385 children (6,774 natural, 190 adopted, 420 stepchildren), 447 grandchildren, 156 brothers or sisters, 240 parents, 0 foster children, 173 other relatives, 205 non-relatives
- In group quarters: 172
Size of family households: 2,631 2-persons, 1,059 3-persons, 1,113 4-persons, 963 5-persons, 238 6-persons, 61 7-or-more-persons.
Size of nonfamily households: 2,142 1-person, 363 2-persons, 51 3-persons.
4,116 married couples with children.
1,272 single-parent households (193 men, 1,079 women).
69.8% of residents of Dickinson speak English at home.
26.6% of residents speak Spanish at home (63% speak English very well, 19% speak English well, 12% speak English not well, 5% don't speak English at all).
2.2% of residents speak other Indo-European language at home (84% speak English very well, 8% speak English well, 8% speak English not well).
1.0% of residents speak Asian or Pacific Island language at home (100% speak English very well).
Foreign born population: 3,449 (15.8%)
(44.9% of them are naturalized citizens)
| Here: | 6.1 |
| State: | 6.3 |
| Here: | 4.5 |
| State: | 4.0 |

- Bedrooms in owner-occupied houses and condos in Dickinson, Texas
- 186no bedroom
- 541 bedroom
- 9002 bedrooms
- 3,5553 bedrooms
- 1,8414 bedrooms
- 2625+ bedrooms

- Bedrooms in renter-occupied apartments in Dickinson, Texas
- 103no bedroom
- 3671 bedroom
- 5912 bedrooms
- 4713 bedrooms
- 2804 bedrooms
- 05+ bedrooms

- Cars and other vehicles available in Dickinson in owner-occupied houses/condos
- 516no vehicle
- 1,5531 vehicle
- 3,0482 vehicles
- 9133 vehicles
- 6844 vehicles
- 845+ vehicles

- Cars and other vehicles available in Dickinson in renter-occupied apartments
- 217no vehicle
- 8071 vehicle
- 5242 vehicles
- 2113 vehicles
- 04 vehicles
- 525+ vehicles

- Rooms in owner-occupied houses in Dickinson, Texas
- 1861 room
- 182 rooms
- 883 rooms
- 6174 rooms
- 1,4095 rooms
- 1,5596 rooms
- 1,0377 rooms
- 1,1168 rooms
- 7699+ rooms

- Rooms in renter-occupied apartments in Dickinson, Texas
- 1031 room
- 782 rooms
- 2663 rooms
- 3764 rooms
- 5435 rooms
- 1246 rooms
- 1937 rooms
- 468 rooms
- 839+ rooms


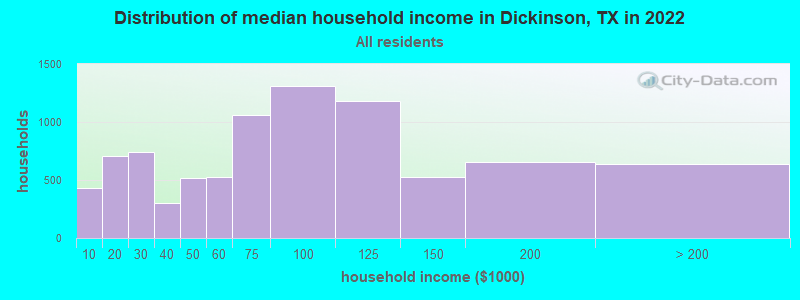
Dickinson, TX household income distribution

- 433Less than $10,000
- 705$10,000 to $19,999
- 745$20,000 to $29,999
- 306$30,000 to $39,999
- 518$40,000 to $49,999
- 527$50,000 to $59,999
- 1,063$60,000 to $74,999
- 1,312$75,000 to $99,999
- 1,180$100,000 to $124,999
- 528$125,000 to $149,999
- 653$150,000 to $199,999
- 640$200,000 or more
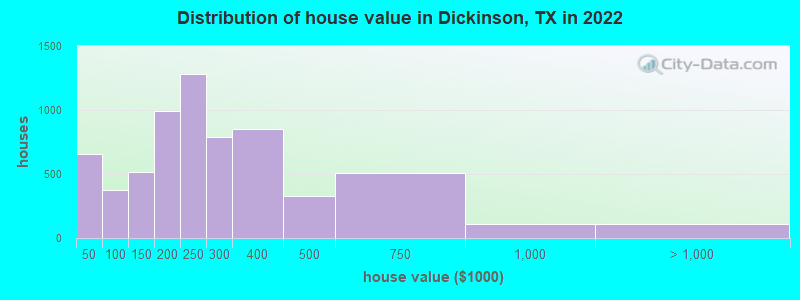
Home value of owner - occupied houses in 2022 in Dickinson, TX
-
- 116Less than $10,000
- 81$10,000 to $14,999
- 198$15,000 to $19,999
- 128$20,000 to $24,999
- 50$25,000 to $29,999
- 24$30,000 to $34,999
- 15$35,000 to $39,999
- 41$40,000 to $49,999
- 115$50,000 to $59,999
- 41$60,000 to $69,999
- 57$70,000 to $79,999
- 65$80,000 to $89,999
- 55$90,000 to $99,999
- 123$100,000 to $124,999
- 390$125,000 to $149,999
- 476$150,000 to $174,999
- 512$175,000 to $199,999
- 1,278$200,000 to $249,999
- 791$250,000 to $299,999
- 850$300,000 to $399,999
- 325$400,000 to $499,999
- 505$500,000 to $749,999
- 109$750,000 to $999,999
- 106$1,500,000 to $1,999,999
Rent paid by renters in 2022 in Dickinson, TX
-
- 57Less than $100
- 11$300 to $349
- 26$350 to $399
- 33$400 to $449
- 76$500 to $549
- 5$550 to $599
- 93$600 to $649
- 17$700 to $749
- 72$750 to $799
- 181$800 to $899
- 235$900 to $999
- 471$1,000 to $1,249
- 60$1,250 to $1,499
- 309$1,500 to $1,999
- 147No cash rent

Percentage of workers working in this county: 64.8%
Number of people working at home: 972 (9.3% of all workers)
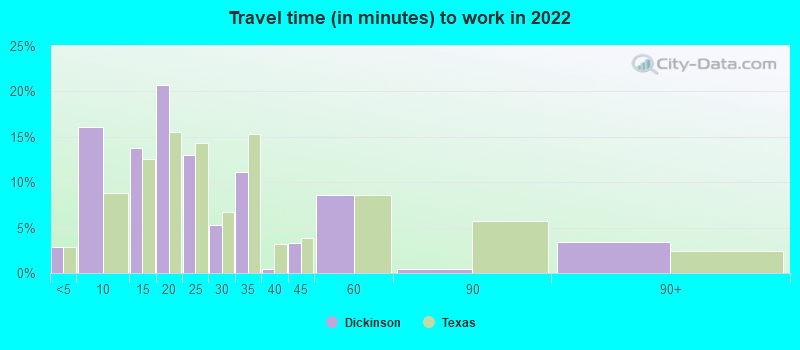
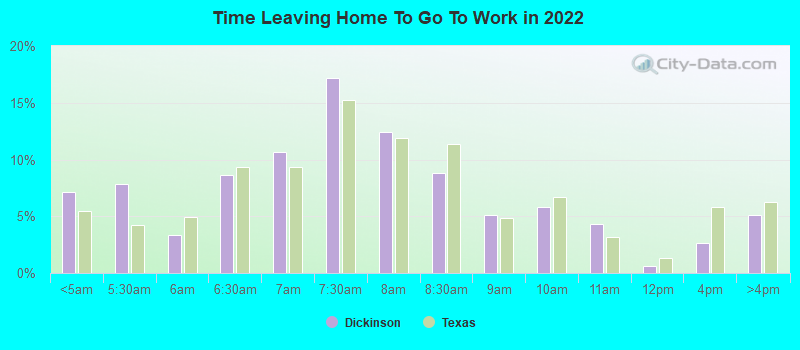
Travel time to work (commute)
- Less than 5 minutes: 321
- 5 to 9 minutes: 716
- 10 to 14 minutes: 1,085
- 15 to 19 minutes: 1,294
- 20 to 24 minutes: 1,373
- 25 to 29 minutes: 498
- 30 to 34 minutes: 1,199
- 35 to 39 minutes: 176
- 40 to 44 minutes: 377
- 45 to 59 minutes: 1,670
- 60 to 89 minutes: 606
- 90 or more minutes: 255
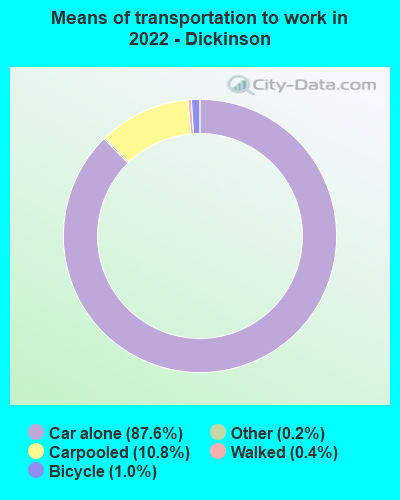
Means of transportation to work:
- Drove a car alone: 4,012 (69.6%)
- Carpooled: 622 (10.8%)
- Taxi: 24 (0.4%)
- Bicycle: 20 (0.3%)
- Walked: 22 (0.4%)
- Worked at home: 972 (16.9%)
- Unemployment by race in 2022
- Unemployment rate for White non-Hispanic residents
- 3.3%Males
- 1.8%Females
- Unemployment rate for Black residents
- 30.2%Females
- Unemployment rate for other race residents
- 1.4%Males
- Unemployment rate for two or more race residents
- 12.6%Females
- Unemployment rate for Hispanic or Latino residents
- 0.2%Males
- 4.1%Females

- Year of entry for the foreign-born population in Dickinson, Texas
- 3742010 or later
- 1,6862000 to 2009
- 6791990 to 1999
- 3861980 to 1989
- 3001970 to 1979
- 158Before 1970

First ancestries reported:
- German: 1,286 (10.9%)
- English: 659 (5.6%)
- American: 494 (4.2%)
- Irish: 426 (3.6%)
- Italian: 411 (3.5%)
- African: 195 (1.7%)
- European: 172 (1.5%)
- Czech: 146 (1.2%)
- Moroccan: 140 (1.2%)
- French Canadian: 106 (0.9%)
- Scotch-Irish: 65 (0.6%)
- Polish: 58 (0.5%)
- French: 48 (0.4%)
- Northern European: 35 (0.3%)
- Hungarian: 32 (0.3%)
- British: 31 (0.3%)
- Welsh: 15 (0.1%)
- Russian: 13 (0.1%)
- Czechoslovakian: 12 (0.1%)
- Dutch: 11 (0.09%)
- Norwegian: 8 (0.07%)
- Scottish: 7 (0.06%)
Most common places of birth for foreign-born residents (%):
| Dickinson: | 63.8% (2,028) |
| Texas: | 48.4% (2,411,723) |
| Dickinson: | 14.8% (469) |
| Texas: | 4.5% (224,455) |
| Dickinson: | 6.8% (217) |
| Texas: | 0.1% (4,638) |
| Dickinson: | 3.9% (124) |
| Texas: | 1.8% (87,382) |
| Dickinson: | 2.1% (67) |
| Texas: | 2.1% (103,148) |
| Dickinson: | 1.9% (60) |
| Texas: | 0.2% (11,402) |
| Dickinson: | 1.5% (49) |
| Texas: | 0.4% (20,885) |
Place of birth for U.S.-born residents:
- This state: 13,268
- Other state: 4,524
- Northeast: 620
- Midwest: 1,004
- South: 1,641
- West: 1,263
85.4% of Dickinson residents lived in the same house 1 years ago.
Out of people who lived in different houses, 36.6% lived in this county.
Out of people who lived in different counties, 74.6% lived in Texas.
| Dickinson: | 85.4% |
| State average: | 85.7% |
Education attainment for males 25 years and older:
- No schooling: 291
- Nursery to 4th grade: 40
- 5th and 6th grade: 59
- 7th and 8th grade: 84
- 9th grade: 192
- 10th grade: 139
- 11th grade: 163
- 12th grade, no diploma: 117
- High school graduate (or equivalency): 1,696
- Less than 1 year of college: 659
- Some college more than 1 year, no degree: 1,416
- Associate degree: 689
- Bachelor's degree: 995
- Master's degree: 356
- Professional school degree: 97
- Doctorate degree: 25

Education attainment for females 25 years and older:
- No schooling: 208
- Nursery to 4th grade: 36
- 5th and 6th grade: 308
- 7th and 8th grade: 139
- 9th grade: 70
- 10th grade: 34
- 11th grade: 97
- 12th grade, no diploma: 69
- High school graduate (or equivalency): 1,738
- Less than 1 year of college: 687
- Some college more than 1 year, no degree: 757
- Associate degree: 436
- Bachelor's degree: 1,672
- Master's degree: 448
- Professional school degree: 18
- Doctorate degree: 0


Housing units in structures:
- One, detached: 7,160
- One, attached: 50
- 3 or 4: 385
- 5 to 9: 246
- 10 to 19: 288
- 20 to 49: 36
- 50 or more: 325
- Mobile homes: 853
- Boats, RVs, vans, etc.: 17
Median worth of mobile homes: $33,421
Housing units lacking complete kitchen facilities in 2022: 6.7%
House/condo owner moved in on average 11 years ago
Renter moved in on average 3 years ago

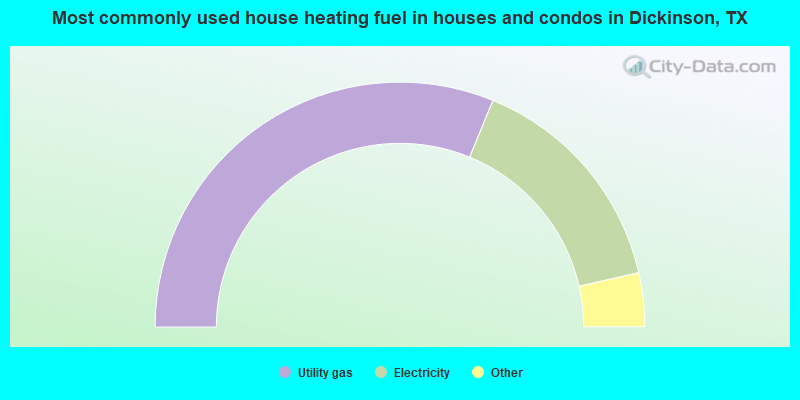
- 62.4%Utility gas
- 30.5%Electricity
- 3.0%No fuel used
- 2.5%Bottled, tank, or LP gas
- 1.0%Solar energy
- 0.4%Wood
- 0.3%Other fuel
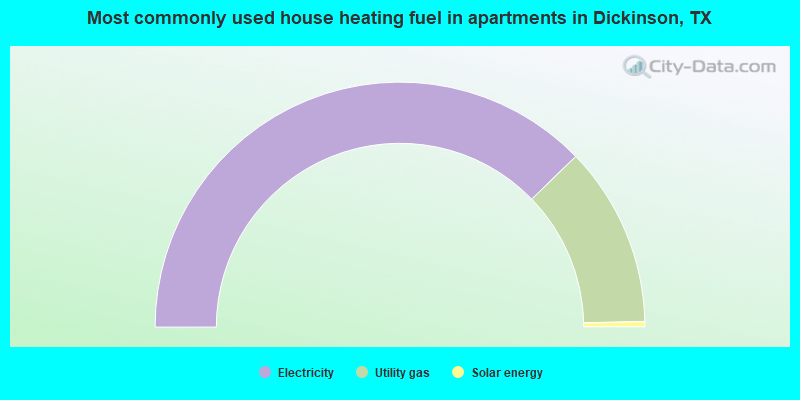
- 75.5%Electricity
- 23.8%Utility gas
- 0.7%Solar energy
Private vs. public school enrollment:
| Here: | 5.8% |
| Texas: | 8.8% |
| Here: | 6.0% |
| Texas: | 8.0% |
| Here: | 21.9% |
| Texas: | 16.2% |


