Races in Dickinson, Texas (TX) Detailed Stats
Data:
Races - White alone (%)
Races - White alone (% change since 2000)
Races - Black alone (%)
Races - Black alone (% change since 2000)
Races - American Indian alone (%)
Races - American Indian alone (% change since 2000)
Races - Asian alone (%)
Races - Asian alone (% change since 2000)
Races - Hispanic (%)
Races - Hispanic (% change since 2000)
Races - Native Hawaiian and Other Pacific Islander alone (%)
Races - Native Hawaiian and Other Pacific Islander alone (% change since 2000)
Races - Two or more races(%)
Races - Two or more races(% change since 2000)
Races - Other race alone (%)
Races - Other race alone (% change since 2000)
Racial diversity
Place of birth - Born in state of residence (%)
Place of birth - Born in state of residence (%) - White
Place of birth - Born in state of residence (%) - Black or African American
Place of birth - Born in state of residence (%) - Asian
Place of birth - Born in state of residence (%) - Hispanic or Latino
Place of birth - Born in state of residence (%) - American Indian and Alaska Native
Place of birth - Born in state of residence (%) - Multirace
Place of birth - Born in state of residence (%) - Other Race
Place of birth - Born in other state (%)
Place of birth - Born in other state (%) - White
Place of birth - Born in other state (%) - Black or African American
Place of birth - Born in other state (%) - Asian
Place of birth - Born in other state (%) - Hispanic or Latino
Place of birth - Born in other state (%) - American Indian and Alaska Native
Place of birth - Born in other state (%) - Multirace
Place of birth - Born in other state (%) - Other Race
Place of birth - Native, outside of US (%)
Place of birth - Native, outside of US (%) - White
Place of birth - Native, outside of US (%) - Black or African American
Place of birth - Native, outside of US (%) - Asian
Place of birth - Native, outside of US (%) - Hispanic or Latino
Place of birth - Native, outside of US (%) - American Indian and Alaska Native
Place of birth - Native, outside of US (%) - Multirace
Place of birth - Native, outside of US (%) - Other Race
Place of birth - Foreign born (%)
Place of birth - Foreign born (%) - White
Place of birth - Foreign born (%) - Black or African American
Place of birth - Foreign born (%) - Asian
Place of birth - Foreign born (%) - Hispanic or Latino
Place of birth - Foreign born (%) - American Indian and Alaska Native
Place of birth - Foreign born (%) - Multirace
Place of birth - Foreign born (%) - Other Race
Residents speaking English at home (%)
Residents speaking English at home - Born in the United States (%)
Residents speaking English at home - Native, born elsewhere (%)
Residents speaking English at home - Foreign born (%)
Residents speaking Spanish at home (%)
Residents speaking Spanish at home - Born in the United States (%)
Residents speaking Spanish at home - Native, born elsewhere (%)
Residents speaking Spanish at home - Foreign born (%)
Residents speaking other language at home (%)
Residents speaking other language at home - Born in the United States (%)
Residents speaking other language at home - Native, born elsewhere (%)
Residents speaking other language at home - Foreign born (%)
Marital status - Never married (%)
Marital status - Now married (%)
Marital status - Separated (%)
Marital status - Widowed (%)
Marital status - Divorced (%)
Ancestries Reported - Arab (%)
Ancestries Reported - Czech (%)
Ancestries Reported - Danish (%)
Ancestries Reported - Dutch (%)
Ancestries Reported - English (%)
Ancestries Reported - French (%)
Ancestries Reported - French Canadian (%)
Ancestries Reported - German (%)
Ancestries Reported - Greek (%)
Ancestries Reported - Hungarian (%)
Ancestries Reported - Irish (%)
Ancestries Reported - Italian (%)
Ancestries Reported - Lithuanian (%)
Ancestries Reported - Norwegian (%)
Ancestries Reported - Polish (%)
Ancestries Reported - Portuguese (%)
Ancestries Reported - Russian (%)
Ancestries Reported - Scotch-Irish (%)
Ancestries Reported - Scottish (%)
Ancestries Reported - Slovak (%)
Ancestries Reported - Subsaharan African (%)
Ancestries Reported - Swedish (%)
Ancestries Reported - Swiss (%)
Ancestries Reported - Ukrainian (%)
Ancestries Reported - United States (%)
Ancestries Reported - Welsh (%)
Ancestries Reported - West Indian (%)
Ancestries Reported - Other (%)
Geographical mobility - Same house 1 year ago (%)
Geographical mobility - Same house 1 year ago (%) - White
Geographical mobility - Same house 1 year ago (%) - Black or African American
Geographical mobility - Same house 1 year ago (%) - Asian
Geographical mobility - Same house 1 year ago (%) - Hispanic or Latino
Geographical mobility - Same house 1 year ago (%) - American Indian and Alaska Native
Geographical mobility - Same house 1 year ago (%) - Multirace
Geographical mobility - Same house 1 year ago (%) - Other Race
Geographical mobility - Moved within same county (%)
Geographical mobility - Moved within same county (%) - White
Geographical mobility - Moved within same county (%) - Black or African American
Geographical mobility - Moved within same county (%) - Asian
Geographical mobility - Moved within same county (%) - Hispanic or Latino
Geographical mobility - Moved within same county (%) - American Indian and Alaska Native
Geographical mobility - Moved within same county (%) - Multirace
Geographical mobility - Moved within same county (%) - Other Race
Geographical mobility - Moved from different county within same state (%)
Geographical mobility - Moved from different county within same state (%) - White
Geographical mobility - Moved from different county within same state (%) - Black or African American
Geographical mobility - Moved from different county within same state (%) - Asian
Geographical mobility - Moved from different county within same state (%) - Hispanic or Latino
Geographical mobility - Moved from different county within same state (%) - American Indian and Alaska Native
Geographical mobility - Moved from different county within same state (%) - Multirace
Geographical mobility - Moved from different county within same state (%) - Other Race
Geographical mobility - Moved from different state (%)
Geographical mobility - Moved from different state (%) - White
Geographical mobility - Moved from different state (%) - Black or African American
Geographical mobility - Moved from different state (%) - Asian
Geographical mobility - Moved from different state (%) - Hispanic or Latino
Geographical mobility - Moved from different state (%) - American Indian and Alaska Native
Geographical mobility - Moved from different state (%) - Multirace
Geographical mobility - Moved from different state (%) - Other Race
Geographical mobility - Moved from abroad (%)
Geographical mobility - Moved from abroad (%) - White
Geographical mobility - Moved from abroad (%) - Black or African American
Geographical mobility - Moved from abroad (%) - Asian
Geographical mobility - Moved from abroad (%) - Hispanic or Latino
Geographical mobility - Moved from abroad (%) - American Indian and Alaska Native
Geographical mobility - Moved from abroad (%) - Multirace
Geographical mobility - Moved from abroad (%) - Other Race
Place of birth for the foreign-born population - Ireland (%)
Place of birth for the foreign-born population - Denmark (%)
Place of birth for the foreign-born population - Norway (%)
Place of birth for the foreign-born population - Sweden (%)
Place of birth for the foreign-born population - United Kingdom (%)
Place of birth for the foreign-born population - England (%)
Place of birth for the foreign-born population - Scotland (%)
Place of birth for the foreign-born population - Other Northern Europe (%)
Place of birth for the foreign-born population - Austria (%)
Place of birth for the foreign-born population - Belgium (%)
Place of birth for the foreign-born population - France (%)
Place of birth for the foreign-born population - Germany (%)
Place of birth for the foreign-born population - Netherlands (%)
Place of birth for the foreign-born population - Switzerland (%)
Place of birth for the foreign-born population - Other Western Europe (%)
Place of birth for the foreign-born population - Greece (%)
Place of birth for the foreign-born population - Italy (%)
Place of birth for the foreign-born population - Portugal (%)
Place of birth for the foreign-born population - Spain (%)
Place of birth for the foreign-born population - Other Southern Europe (%)
Place of birth for the foreign-born population - Albania (%)
Place of birth for the foreign-born population - Belarus (%)
Place of birth for the foreign-born population - Bosnia and Herzegovina (%)
Place of birth for the foreign-born population - Bulgaria (%)
Place of birth for the foreign-born population - Croatia (%)
Place of birth for the foreign-born population - Czechoslovakia (%)
Place of birth for the foreign-born population - Hungary (%)
Place of birth for the foreign-born population - Latvia (%)
Place of birth for the foreign-born population - Lithuania (%)
Place of birth for the foreign-born population - North Macedonia (Macedonia) (%)
Place of birth for the foreign-born population - Moldova (%)
Place of birth for the foreign-born population - Poland (%)
Place of birth for the foreign-born population - Romania (%)
Place of birth for the foreign-born population - Russia (%)
Place of birth for the foreign-born population - Serbia (%)
Place of birth for the foreign-born population - Ukraine (%)
Place of birth for the foreign-born population - Other Eastern Europe (%)
Place of birth for the foreign-born population - China (%)
Place of birth for the foreign-born population - Hong Kong (%)
Place of birth for the foreign-born population - Taiwan (%)
Place of birth for the foreign-born population - Japan (%)
Place of birth for the foreign-born population - Korea (%)
Place of birth for the foreign-born population - Other Eastern Asia (%)
Place of birth for the foreign-born population - Afghanistan (%)
Place of birth for the foreign-born population - Bangladesh (%)
Place of birth for the foreign-born population - India (%)
Place of birth for the foreign-born population - Iran (%)
Place of birth for the foreign-born population - Kazakhstan (%)
Place of birth for the foreign-born population - Nepal (%)
Place of birth for the foreign-born population - Pakistan (%)
Place of birth for the foreign-born population - Sri Lanka (%)
Place of birth for the foreign-born population - Uzbekistan (%)
Place of birth for the foreign-born population - Other South Central Asia (%)
Place of birth for the foreign-born population - Burma (%)
Place of birth for the foreign-born population - Cambodia (%)
Place of birth for the foreign-born population - Indonesia (%)
Place of birth for the foreign-born population - Laos (%)
Place of birth for the foreign-born population - Malaysia (%)
Place of birth for the foreign-born population - Philippines (%)
Place of birth for the foreign-born population - Singapore (%)
Place of birth for the foreign-born population - Thailand (%)
Place of birth for the foreign-born population - Vietnam (%)
Place of birth for the foreign-born population - Other South Eastern Asia (%)
Place of birth for the foreign-born population - Armenia (%)
Place of birth for the foreign-born population - Iraq (%)
Place of birth for the foreign-born population - Israel (%)
Place of birth for the foreign-born population - Jordan (%)
Place of birth for the foreign-born population - Kuwait (%)
Place of birth for the foreign-born population - Lebanon (%)
Place of birth for the foreign-born population - Saudi Arabia (%)
Place of birth for the foreign-born population - Syria (%)
Place of birth for the foreign-born population - Turkey (%)
Place of birth for the foreign-born population - Yemen (%)
Place of birth for the foreign-born population - Other Western Asia (%)
Place of birth for the foreign-born population - Eritrea (%)
Place of birth for the foreign-born population - Ethiopia (%)
Place of birth for the foreign-born population - Kenya (%)
Place of birth for the foreign-born population - Somalia (%)
Place of birth for the foreign-born population - Uganda (%)
Place of birth for the foreign-born population - Zimbabwe (%)
Place of birth for the foreign-born population - Other Eastern Africa (%)
Place of birth for the foreign-born population - Cameroon (%)
Place of birth for the foreign-born population - Congo (%)
Place of birth for the foreign-born population - Democratic Republic of Congo (Zaire) (%)
Place of birth for the foreign-born population - Other Middle Africa (%)
Place of birth for the foreign-born population - Egypt (%)
Place of birth for the foreign-born population - Morocco (%)
Place of birth for the foreign-born population - Sudan (%)
Place of birth for the foreign-born population - Other Northern Africa (%)
Place of birth for the foreign-born population - South Africa (%)
Place of birth for the foreign-born population - Other Southern Africa (%)
Place of birth for the foreign-born population - Cabo Verde (%)
Place of birth for the foreign-born population - Ghana (%)
Place of birth for the foreign-born population - Liberia (%)
Place of birth for the foreign-born population - Nigeria (%)
Place of birth for the foreign-born population - Senegal (%)
Place of birth for the foreign-born population - Sierra Leone (%)
Place of birth for the foreign-born population - Other Western Africa (%)
Place of birth for the foreign-born population - Australia (%)
Place of birth for the foreign-born population - New Zealand (%)
Place of birth for the foreign-born population - Fiji (%)
Place of birth for the foreign-born population - Micronesia (%)
Place of birth for the foreign-born population - Bahamas (%)
Place of birth for the foreign-born population - Barbados (%)
Place of birth for the foreign-born population - Cuba (%)
Place of birth for the foreign-born population - Dominica (%)
Place of birth for the foreign-born population - Dominican Republic (%)
Place of birth for the foreign-born population - Grenada (%)
Place of birth for the foreign-born population - Haiti (%)
Place of birth for the foreign-born population - Jamaica (%)
Place of birth for the foreign-born population - St. Vincent and the Grenadines (%)
Place of birth for the foreign-born population - Trinidad and Tobago (%)
Place of birth for the foreign-born population - West Indies (%)
Place of birth for the foreign-born population - Other Caribbean (%)
Place of birth for the foreign-born population - Belize (%)
Place of birth for the foreign-born population - Costa Rica (%)
Place of birth for the foreign-born population - El Salvador (%)
Place of birth for the foreign-born population - Guatemala (%)
Place of birth for the foreign-born population - Honduras (%)
Place of birth for the foreign-born population - Mexico (%)
Place of birth for the foreign-born population - Nicaragua (%)
Place of birth for the foreign-born population - Panama (%)
Place of birth for the foreign-born population - Other Central America (%)
Place of birth for the foreign-born population - Argentina (%)
Place of birth for the foreign-born population - Bolivia (%)
Place of birth for the foreign-born population - Brazil (%)
Place of birth for the foreign-born population - Chile (%)
Place of birth for the foreign-born population - Colombia (%)
Place of birth for the foreign-born population - Ecuador (%)
Place of birth for the foreign-born population - Guyana (%)
Place of birth for the foreign-born population - Peru (%)
Place of birth for the foreign-born population - Uruguay (%)
Place of birth for the foreign-born population - Venezuela (%)
Place of birth for the foreign-born population - Other South America (%)
Place of birth for the foreign-born population - Canada (%)
Place of birth for the foreign-born population - Other Northern America (%)
Place of birth for the foreign-born population - Other (%)
Latest news about races in Dickinson, TX collected exclusively by city-data.com from local newspapers, TV, and radio stations
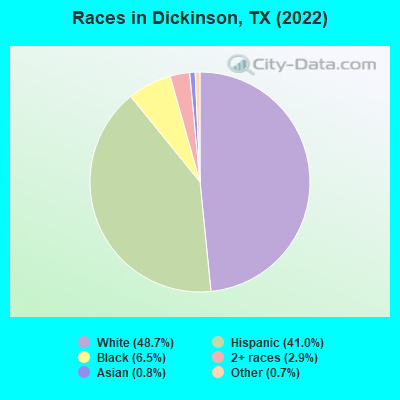
According to 2022 data, the most numerous races in Dickinson, TX are Hispanic (8,965 residents), White alone (10,657 residents), and Black alone (1,411 residents). 68.7% of Dickinson residents speak English at home. 14.5% of Dickinson, TX residents are foreign-born (12.3% born in Latin America), which is 17.0% less than the foreign-born rate of 17.0% across the entire state of Texas.
Race distribution in Dickinson
2000 2022
10,933,313 52.4% White alone 6,669,666 32.0% Hispanic 2,364,255 11.3% Black alone 554,445 2.7% Asian alone 230,567 1.1% Two or more races 68,859 0.3% American Indian alone 19,958 0.10% Other race alone 10,757 0.05% Native Hawaiian and Other
12,070,642 40.2% Hispanic 11,683,430 38.9% White alone 3,508,706 11.7% Black alone 1,608,173 5.4% Asian alone 956,560 3.2% Two or more races 125,763 0.4% Other race alone 47,023 0.2% American Indian alone 29,275 0.10% Native Hawaiian and Other
Income and house value in Dickinson Median household income in 2022 $86,395 White non-Hispanic householders$52,730 Black householders$54,928 Some other race householders$68,040 Two or more races householders$66,514 Hispanic or Latino race householdersMedian 2022 house value $265,069 White Non-Hispanic householders$181,508 Black or African American householders$232,318 American Indian or Alaska Native householders $265,681 Asian householders$214,871 Some other race householders$275,476 Two or more races householders$201,097 Hispanic or Latino householders
Median age by race in Dickinson
38.9 Median age for White residents43.7 35.0 51.4 Median age for Black or African American residents46.3 59.9 -668,041,236.4 Median age for American Indian / Alaska Native residents-513,227,512.7 -673,582,295.3 55.6 Median age for Asian residents47.9 70.8 -581,560,283.1 Median age for Native Hawaiian / Pacific Islander residents-612,729,233.5 -577,777,777.2 32.1 Median age for Other race residents34.2 30.2 23.7 Median age for Two or more races residents23.2 23.9 44.2 Median age for White alone residents47.2 38.3 25.5 Median age for Hispanic or Latino residents26.1 25.7
Owner/renter occupied households by race in Dickinson
House owners and renters - White residents 4,805 84.5% Owner occupied882 15.5% Renter occupiedHouse owners and renters - Black or African American residents 309 43.5% Owner occupied401 56.5% Renter occupiedHouse owners and renters - Asian residents 81 100.0% Owner occupiedHouse owners and renters - Other race residents 358 47.8% Owner occupied391 52.2% Renter occupiedHouse owners and renters - Two or more races residents 1,425 82.8% Owner occupied296 17.2% Renter occupiedHouse owners and renters - White alone residents 4,208 82.0% Owner occupied924 18.0% Renter occupiedHouse owners and renters - Hispanic or Latino residents 2,028 83.1% Owner occupied414 16.9% Renter occupied
Language usage in Dickinson
English speakers - Total 68.7% of residents of Dickinson speak English at home.
29.4% of residents speak Spanish at home 3,561 59.0% Speak English very well2,474 41.0% Speak English less than very well3.0% of residents speak other language at home 530 86.5% Speak English very well83 13.5% Speak English less than very well
English speakers - Born in the United States 89.9% of residents of Dickinson speak English at home.
9.1% of residents speak Spanish at home 328 80.8% Speak English very well78 19.2% Speak English less than very well1.6% of residents speak other language at home 59 80.8% Speak English very well14 19.2% Speak English less than very well
English speakers - Native, born elsewhere 46.2% of residents of Dickinson speak English at home.
22.5% of residents speak Spanish at home 127 100.0% Speak English very well34.7% of residents speak other language at home 196 100.0% Speak English very well
English speakers - Foreign-born 14.8% of residents of Dickinson speak English at home.
81.6% of residents speak Spanish at home 1,015 36.1% Speak English very well1,800 63.9% Speak English less than very well4.2% of residents speak other language at home 122 84.1% Speak English very well23 15.9% Speak English less than very well
White (Caucasian) - Speak only English Native:
90.6% (10,293)Foreign-born:
32.0% (340)
White (Caucasian) - Speak another language Native:
7.6% (865)Foreign-born:
61.1% (651)
Black or African American - Speak only English Native:
99.5% (1,495)Foreign-born:
90.7% (5)
Asian - Speak only English Native:
12.6% (14)Foreign-born:
23.7% (19)
Asian - Speak another language Native:
85.4% (92)Foreign-born:
73.9% (59)
Other race - Speak only English Native:
46.8% (503)Foreign-born:
6.8% (84)
Other race - Speak another language Native:
52.7% (567)Foreign-born:
92.2% (1,146)
Two or more races - Speak only English Native:
36.4% (1,229)Foreign-born:
11.9% (149)
Two or more races - Speak another language Native:
72.4% (2,446)Foreign-born:
86.8% (1,086)
White alone - Speak only English Native:
96.5% (9,565)Foreign-born:
94.8% (348)
White alone - Speak another language Native:
3.4% (334)Foreign-born:
4.7% (17)
Hispanic or Latino - Speak only English Native:
41.0% (2,113)Foreign-born:
6.9% (205)
Hispanic or Latino - Speak another language Native:
59.8% (3,082)Foreign-born:
93.1% (2,780)
Foreign-born residents in Dickinson 3,177 residents are foreign born (12.3% Latin America ).
This city:
14.5%Texas:
17.1%
Marital status for residents in Dickinson Marital status - White (Caucasian) population 15 years and over
Males 23.4% Never married60.7% Now married0.0% Separated1.3% Widowed14.7% DivorcedFemales 27.0% Never married58.3% Now married0.8% Separated5.4% Widowed8.5% DivorcedWomen who gave birth in the past 12 months Now married:
28.7% (24)Unmarried:
71.3% (59)
Women who did not give birth in the past 12 months Now married:
56.7% (1,702)Unmarried:
43.3% (1,300)
Marital status - Black or African American population 15 years and over
Males 43.3% Never married21.7% Now married1.9% Separated2.8% Widowed30.3% DivorcedFemales 34.9% Never married29.4% Now married2.8% Separated10.7% Widowed22.3% DivorcedWomen who gave birth in the past 12 months Now married:
0.0% (0)Unmarried:
100.0% (7)
Women who did not give birth in the past 12 months Now married:
47.6% (104)Unmarried:
52.4% (115)
Marital status - American Indian / Alaska Native population 15 years and over
Males 0.0% Never married0.0% Now married0.0% Separated0.0% Widowed100.0% DivorcedFemales 0.0% Never married100.0% Now married0.0% Separated0.0% Widowed0.0% DivorcedWomen who did not give birth in the past 12 months Now married:
100.0% (53)Unmarried:
0.0% (0)
Marital status - Asian population 15 years and over
Males 17.1% Never married82.9% Now married0.0% Separated0.0% Widowed0.0% DivorcedFemales 12.5% Never married61.7% Now married0.0% Separated17.2% Widowed8.6% DivorcedWomen who did not give birth in the past 12 months Now married:
32.5% (14)Unmarried:
67.5% (29)
Marital status - Other race population 15 years and over
Males 44.2% Never married42.0% Now married7.4% Separated0.0% Widowed6.3% DivorcedFemales 42.5% Never married43.2% Now married0.0% Separated3.8% Widowed10.6% DivorcedWomen who gave birth in the past 12 months Now married:
0.0% (0)Unmarried:
100.0% (64)
Women who did not give birth in the past 12 months Now married:
50.7% (236)Unmarried:
49.3% (229)
Marital status - Two or more races population 15 years and over
Males 39.4% Never married52.2% Now married0.0% Separated3.6% Widowed4.8% DivorcedFemales 38.4% Never married48.5% Now married3.6% Separated3.1% Widowed6.4% DivorcedWomen who gave birth in the past 12 months Now married:
77.7% (280)Unmarried:
22.3% (80)
Women who did not give birth in the past 12 months Now married:
39.0% (404)Unmarried:
61.0% (632)
Marital status - White alone, not Hispanic / Latino population 15 years and over
Males 21.1% Never married61.9% Now married0.0% Separated1.5% Widowed15.4% DivorcedFemales 20.6% Never married61.9% Now married1.1% Separated7.1% Widowed9.4% DivorcedWomen who gave birth in the past 12 months Now married:
28.7% (27)Unmarried:
71.3% (66)
Women who did not give birth in the past 12 months Now married:
62.5% (1,286)Unmarried:
37.5% (772)
Marital status - Hispanic or Latino population 15 years and over
Males 39.8% Never married48.8% Now married1.8% Separated1.4% Widowed8.3% DivorcedFemales 40.4% Never married47.9% Now married2.2% Separated2.2% Widowed7.3% DivorcedWomen who gave birth in the past 12 months Now married:
67.3% (196)Unmarried:
32.7% (95)
Women who did not give birth in the past 12 months Now married:
48.0% (1,071)Unmarried:
52.0% (1,161)
Ancestries in Dickinson
1,286 10.9% German659 5.6% English494 4.2% American426 3.6% Irish411 3.5% Italian195 1.7% African172 1.5% European146 1.2% Czech140 1.2% Moroccan106 0.9% French Canadian65 0.6% Scotch-Irish58 0.5% Polish48 0.4% French35 0.3% Northern European32 0.3% Hungarian31 0.3% British15 0.1% Welsh13 0.1% Russian12 0.1% Czechoslovakian11 0.09% Dutch8 0.07% Norwegian7 0.06% Scottish
Geographical mobility in Dickinson Same house 1 year ago 11,720 89.7% White (Caucasian)1,314 90.5% Black or African American182 99.3% Asian2,218 86.9% Other race3,463 65.2% Two or more races9,179 86.8% White alone, not Hispanic / Latino7,381 83.1% Hispanic or LatinoMoved within same county 574 4.4% White / Caucasian84 5.8% Black or African American11 15.9% American Indian / Alaska Native291 11.4% Other race1,485 28.0% Two or more races635 6.0% White alone, not Hispanic / Latino1,003 11.3% Hispanic or LatinoMoved within same state 536 4.1% White / Caucasian66 4.5% Black or African American47 70.2% American Indian / Alaska Native239 4.5% Two or more races556 5.3% White alone, not Hispanic / Latino198 2.2% Hispanic or LatinoMoved from different state 268 2.1% White / Caucasian125 1.2% White alone, not Hispanic / Latino239 2.7% Hispanic or LatinoMoved from abroad 163 3.1% Two or more races40 0.5% Hispanic or Latino
Children Nativity (place of birth) in Dickinson
Children under 6 years - Living with two parents Both parents native 1,108 100.0% NativeBoth parents foreign-born 31 100.0% NativeOne native, one foreign-born parent 318 100.0% NativeChildren under 6 years - Living with one parent Native parent 233 100.0% NativeForeign-born parent 181 100.0% NativeChildren 6 to 17 years - Living with two parents Both parents native 1,409 97.7% Native33 2.3% Foreign-bornBoth parents foreign-born 628 83.4% Native125 16.6% Foreign-bornOne native, one foreign-born parent 523 92.7% Native41 7.3% Foreign-bornChildren 6 to 17 years - Living with one parent Native parent 37 100.0% NativeForeign-born parent 1,096 52.1% Native1,010 47.9% Foreign-born
Grandparents responsible for own grandchildren in Dickinson
Grandparents (30 to 59 years) White / Caucasian 17 80.6% Responsible for grandchildren4 19.4% Not responsible for grandchildrenBlack or African American 8 37.0% Responsible for grandchildren13 63.0% Not responsible for grandchildrenOther race 20 14.8% Responsible for grandchildren116 85.2% Not responsible for grandchildrenTwo or more races 23 50.1% Responsible for grandchildren23 49.9% Not responsible for grandchildrenWhite alone, not Hispanic / Latino 17 74.9% Responsible for grandchildren6 25.1% Not responsible for grandchildrenHispanic or Latino 36 28.1% Responsible for grandchildren91 71.9% Not responsible for grandchildrenGrandparents (60 years and over) White / Caucasian 39 44.9% Responsible for grandchildren47 55.1% Not responsible for grandchildrenBlack or African American 55 100.0% Not responsible for grandchildrenTwo or more races 26 66.4% Responsible for grandchildren13 33.6% Not responsible for grandchildrenWhite alone, not Hispanic / Latino 24 29.3% Responsible for grandchildren59 70.7% Not responsible for grandchildrenHispanic or Latino 53 100.0% Responsible for grandchildren