Des Plaines, IL (Illinois) Houses and Residents
| Des Plaines: | $312,073 |
| Illinois: | $251,600 |
Mean price in 2022:
Detached houses: $342,053
Here: $342,053 State: $310,164 Townhouses or other attached units: $318,047
Here: $318,047 State: $286,230 In 2-unit structures: $101,817
Here: $101,817 State: $299,638 In 3-to-4-unit structures: $253,728
Here: $253,728 State: $330,907 In 5-or-more-unit structures: $191,562
Here: $191,562 State: $318,887 Mobile homes: $36,342
Here: $36,342 State: $78,855
Total population: 58,947 (Urban population: 58,695, Rural population: 0)
Houses: 24,247 (22,984 occupied: 18,385 owner occupied, 4,991 renter occupied)
| % of renters here: | 21% |
| State: | 33% |
Housing density: 1,681 houses/condos per square mile
Median price asked for vacant for-sale houses and condos in 2022: $195,622.
Median contract rent in 2022: $1,160 (lower quartile is $923, upper quartile is $1,716)
Median rent asked for vacant for-rent units in 2022: $1,641
Median gross rent in Des Plaines, IL in 2022: $1,294
Housing units in Des Plaines with a mortgage: 11,229 (937 second mortgage, 67 home equity loan, 660 both second mortgage and home equity loan)
Houses without a mortgage: 533
Median household income for houses/condos with a mortgage: $108,734
Median household income for apartments without a mortgage: $75,126
Median monthly housing costs: $1,458
Compare current foreclosures in Des Plaines, IL:
| Photo | Address | Area | Beds / Baths | Price | Details |
|---|---|---|---|---|---|

|
#1
S Lyman Ave
Des Plaines, IL 60016
|
2,233 sq. feet
|
2 baths 4 beds |
$330,000
|
show details |

|
#2
Webster Ln
Des Plaines, IL 60018
|
1,608 sq. feet
|
3 baths 3 beds |
$515,000
|
show details |

|
#3
N 4th Ave
Des Plaines, IL 60016
|
1,381 sq. feet
|
1 baths 3 beds |
$335,000
|
show details |

|
#4
Avenida Serra Test
Des Plaines, IL 60018
|
- sq. feet
|
2 baths 3 beds |
$100,000
|
show details |

|
#5
E Church St
Des Plaines, IL 60016
|
- sq. feet
|
- baths - beds |
$185,500
|
show details |

|
#6
Rockwell Ln
Des Plaines, IL 60016
|
- sq. feet
|
2 baths 3 beds |
show details | |

|
#7
Dee Rd
Des Plaines, IL 60016
|
1,500 sq. feet
|
2 baths 3 beds |
show details | |

|
#8
S River Rd
Des Plaines, IL 60016
|
1,100 sq. feet
|
1 baths 2 beds |
show details | |

|
#9
Grove Ave
Des Plaines, IL 60016
|
1,072 sq. feet
|
1 baths 3 beds |
show details | |

|
#10
S Western Ave Unit 208
Des Plaines, IL 60016
|
1,571 sq. feet
|
2 baths 2 beds |
show details |
| Photo | Address | Area | Beds / Baths | Price | Details |
|---|---|---|---|---|---|

|
#11
S Western Ave Unit 208
Des Plaines, IL 60016
|
1,571 sq. feet
|
2 baths 2 beds |
show details | |

|
#12
Potter Rd
Des Plaines, IL 60016
|
1,327 sq. feet
|
1 baths - beds |
show details | |

|
#13
Dover Dr
Des Plaines, IL 60018
|
1,488 sq. feet
|
1 baths - beds |
show details | |

|
#14
Robin Dr
Des Plaines, IL 60016
|
1,221 sq. feet
|
1 baths - beds |
show details | |

|
#15
E Lincoln Ave
Des Plaines, IL 60018
|
999 sq. feet
|
1 baths - beds |
show details | |

|
#16
Ruby St
Des Plaines, IL 60018
|
1,258 sq. feet
|
1 baths - beds |
show details | |

|
#17
E Villa Dr
Des Plaines, IL 60016
|
1,222 sq. feet
|
1 baths - beds |
show details | |

|
#18
Terrace Pl
Des Plaines, IL 60016
|
1,547 sq. feet
|
1 baths - beds |
show details | |

|
#19
Marshall Dr
Des Plaines, IL 60016
|
1,334 sq. feet
|
1 baths - beds |
show details | |

|
#20
Sherry Ln
Des Plaines, IL 60016
|
1,550 sq. feet
|
1 baths - beds |
show details |
| Photo | Address | Area | Beds / Baths | Price | Details |
|---|---|---|---|---|---|

|
#21
Cambridge Rd
Des Plaines, IL 60016
|
1,013 sq. feet
|
1 baths - beds |
show details | |

|
#22
Stockton Ave
Des Plaines, IL 60018
|
1,042 sq. feet
|
1 baths - beds |
show details | |

|
#23
S Golf Cul De Sac St
Des Plaines, IL 60016
|
1,213 sq. feet
|
1 baths - beds |
show details | |

|
#24
Lillian Ln
Des Plaines, IL 60016
|
1,168 sq. feet
|
1 baths - beds |
show details | |

|
#25
Vassar Ln
Des Plaines, IL 60016
|
1,005 sq. feet
|
2 baths - beds |
show details | |

|
#26
N Warrington Rd
Des Plaines, IL 60016
|
1,069 sq. feet
|
1 baths - beds |
show details | |

|
#27
Alfini Dr
Des Plaines, IL 60016
|
1,138 sq. feet
|
1 baths - beds |
show details | |

|
#28
Polynesian Dr
Des Plaines, IL 60016
|
2,255 sq. feet
|
2 baths - beds |
show details | |

|
#29
Leahy Cir S
Des Plaines, IL 60016
|
2,431 sq. feet
|
2 baths - beds |
show details | |

|
#30
Greenview Ave
Des Plaines, IL 60016
|
1,250 sq. feet
|
1 baths - beds |
show details |
| Photo | Address | Area | Beds / Baths | Price | Details |
|---|---|---|---|---|---|

|
#31
Byron St
Des Plaines, IL 60018
|
1,344 sq. feet
|
1 baths - beds |
show details | |

|
#32
Rusty Dr
Des Plaines, IL 60018
|
1,197 sq. feet
|
1 baths - beds |
show details | |

|
#33
Jeffery Ln
Des Plaines, IL 60018
|
1,295 sq. feet
|
1 baths - beds |
show details | |

|
#34
E Lincoln Ave
Des Plaines, IL 60018
|
1,685 sq. feet
|
2 baths - beds |
show details | |

|
#35
Maple St
Des Plaines, IL 60018
|
905 sq. feet
|
1 baths - beds |
show details | |

|
#36
W Emerson St
Des Plaines, IL 60016
|
1,501 sq. feet
|
1 baths - beds |
show details | |

|
#37
Joseph Ave
Des Plaines, IL 60018
|
1,840 sq. feet
|
2 baths - beds |
show details | |

|
#38
Farwell Ave
Des Plaines, IL 60018
|
1,550 sq. feet
|
1 baths - beds |
show details | |

|
#39
Rancho Ln
Des Plaines, IL 60016
|
1,163 sq. feet
|
1 baths - beds |
show details | |

|
#40
Bedford Ln
Des Plaines, IL 60016
|
1,251 sq. feet
|
1 baths - beds |
show details |
| Photo | Address | Area | Beds / Baths | Price | Details |
|---|---|---|---|---|---|

|
#41
Alles St
Des Plaines, IL 60016
|
1,080 sq. feet
|
1 baths - beds |
show details | |

|
#42
Elmira Ave
Des Plaines, IL 60018
|
1,485 sq. feet
|
2 baths - beds |
show details | |

|
#43
S Wolf Rd
Des Plaines, IL 60018
|
1,137 sq. feet
|
1 baths - beds |
show details | |

|
#44
Oakwood Ave
Des Plaines, IL 60016
|
1,165 sq. feet
|
2 baths - beds |
show details | |

|
#45
Marshall Dr
Des Plaines, IL 60018
|
1,040 sq. feet
|
1 baths - beds |
show details | |

|
#46
Spruce Ave
Des Plaines, IL 60018
|
1,110 sq. feet
|
1 baths - beds |
show details | |

|
#47
Oakwood Ct
Des Plaines, IL 60016
|
1,020 sq. feet
|
1 baths - beds |
show details | |

|
#48
Oakwood Ave
Des Plaines, IL 60016
|
1,128 sq. feet
|
1 baths - beds |
show details | |

|
#49
Graceland Ave # 1d
Des Plaines, IL 60016
|
5,458 sq. feet
|
7 baths - beds |
show details | |

|
Check over 1 million property listings on Foreclosure.com!
|
browse all offers | |||


 | Des Plaines Neighborhoods Home (5 replies) |
| Very frustrating snow plow problem in front of my home in Des Plaines (7 replies) |
| Best areas to rent in Des Plaines (3 replies) |
| Cheapest entry level housing (NW suburbs pref) (9 replies) |
| Relocating /// NYC to CHICAGO. Safe Suburban Home Commutable to Downtown. (72 replies) |
| top 3 areas to avoid in nw suburbs (84 replies) |

Median year apartment built: 1977
Household type by relationship:
Households: 58,752- Male householders: 11,438 (2,776 living alone), Female householders: 10,940 (3,656 living alone)
11,324 spouses (11,246 opposite-sex spouses), 1,262 unmarried partners, (1,240 opposite-sex unmarried partners), 17,063 children (16,501 natural, 191 adopted, 370 stepchildren), 1,218 grandchildren, 528 brothers or sisters, 1,763 parents, 21 foster children, 1,038 other relatives, 1,080 non-relatives
- In group quarters: 1,072
Size of family households: 6,273 2-persons, 3,642 3-persons, 3,250 4-persons, 1,346 5-persons, 477 6-persons, 296 7-or-more-persons.
Size of nonfamily households: 6,911 1-person, 903 2-persons, 72 3-persons, 47 4-persons, 27 5-persons.
7,782 married couples with children.
2,477 single-parent households (870 men, 1,607 women).
54.9% of residents of Des Plaines speak English at home.
15.2% of residents speak Spanish at home (65% speak English very well, 17% speak English well, 13% speak English not well, 4% don't speak English at all).
21.4% of residents speak other Indo-European language at home (57% speak English very well, 24% speak English well, 16% speak English not well, 3% don't speak English at all).
7.3% of residents speak Asian or Pacific Island language at home (64% speak English very well, 21% speak English well, 12% speak English not well, 4% don't speak English at all).
2.0% of residents speak other language at home (65% speak English very well, 22% speak English well, 12% speak English not well).
Foreign born population: 18,384 (31.3%)
(67.0% of them are naturalized citizens)
| Here: | 5.9 |
| State: | 6.4 |
| Here: | 3.9 |
| State: | 4.1 |

- Bedrooms in owner-occupied houses and condos in Des Plaines, Illinois
- 56no bedroom
- 8951 bedroom
- 4,5502 bedrooms
- 8,8873 bedrooms
- 3,2604 bedrooms
- 7365+ bedrooms

- Bedrooms in renter-occupied apartments in Des Plaines, Illinois
- 372no bedroom
- 1,7791 bedroom
- 1,5002 bedrooms
- 1,1743 bedrooms
- 1304 bedrooms
- 375+ bedrooms

- Cars and other vehicles available in Des Plaines in owner-occupied houses/condos
- 705no vehicle
- 6,0051 vehicle
- 7,7062 vehicles
- 2,8633 vehicles
- 8144 vehicles
- 2935+ vehicles

- Cars and other vehicles available in Des Plaines in renter-occupied apartments
- 541no vehicle
- 2,5211 vehicle
- 1,4782 vehicles
- 3453 vehicles
- 804 vehicles
- 275+ vehicles

- Rooms in owner-occupied houses in Des Plaines, Illinois
- 431 room
- 1312 rooms
- 8893 rooms
- 2,3124 rooms
- 4,2255 rooms
- 4,0366 rooms
- 2,5247 rooms
- 1,9598 rooms
- 2,2689+ rooms

- Rooms in renter-occupied apartments in Des Plaines, Illinois
- 3551 room
- 3852 rooms
- 1,1923 rooms
- 1,1934 rooms
- 8685 rooms
- 6156 rooms
- 2197 rooms
- 798 rooms
- 869+ rooms


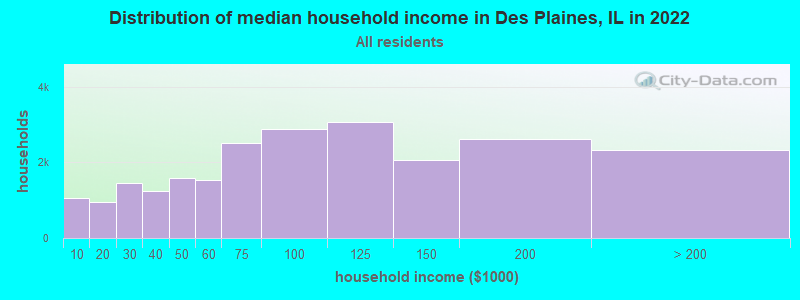
Des Plaines, IL household income distribution

- 1,056Less than $10,000
- 960$10,000 to $19,999
- 1,458$20,000 to $29,999
- 1,239$30,000 to $39,999
- 1,586$40,000 to $49,999
- 1,533$50,000 to $59,999
- 2,525$60,000 to $74,999
- 2,894$75,000 to $99,999
- 3,070$100,000 to $124,999
- 2,077$125,000 to $149,999
- 2,616$150,000 to $199,999
- 2,333$200,000 or more
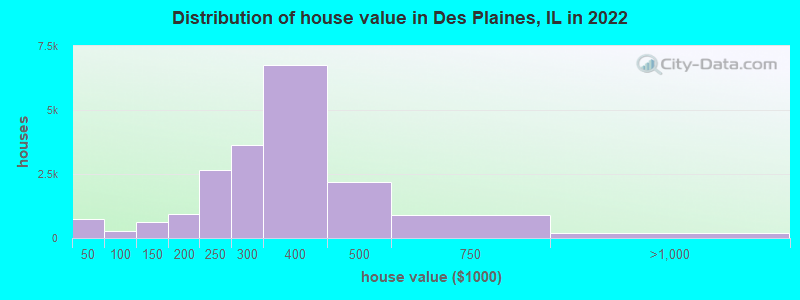
Home value of owner - occupied houses in 2022 in Des Plaines, IL
-
- 180Less than $10,000
- 154$10,000 to $14,999
- 22$15,000 to $19,999
- 95$20,000 to $24,999
- 78$25,000 to $29,999
- 116$30,000 to $34,999
- 24$35,000 to $39,999
- 56$40,000 to $49,999
- 4$50,000 to $59,999
- 83$70,000 to $79,999
- 53$80,000 to $89,999
- 80$90,000 to $99,999
- 340$100,000 to $124,999
- 281$125,000 to $149,999
- 335$150,000 to $174,999
- 618$175,000 to $199,999
- 2,658$200,000 to $249,999
- 3,644$250,000 to $299,999
- 6,762$300,000 to $399,999
- 2,190$400,000 to $499,999
- 908$500,000 to $749,999
- 105$750,000 to $999,999
- 15$1,000,000 to $1,499,999
- 54$2,000,000 or more
Rent paid by renters in 2022 in Des Plaines, IL
-
- 98$150 to $199
- 94$200 to $249
- 27$250 to $299
- 22$300 to $349
- 63$350 to $399
- 33$450 to $499
- 31$500 to $549
- 31$550 to $599
- 48$600 to $649
- 41$650 to $699
- 74$700 to $749
- 72$750 to $799
- 294$800 to $899
- 906$900 to $999
- 814$1,000 to $1,249
- 475$1,250 to $1,499
- 1,020$1,500 to $1,999
- 490$2,000 to $2,499
- 78$2,500 to $2,999
- 30$3,000 to $3,499
- 210No cash rent


Percentage of workers working in this county: 86.3%
Number of people working at home: 4,119 (13.6% of all workers)
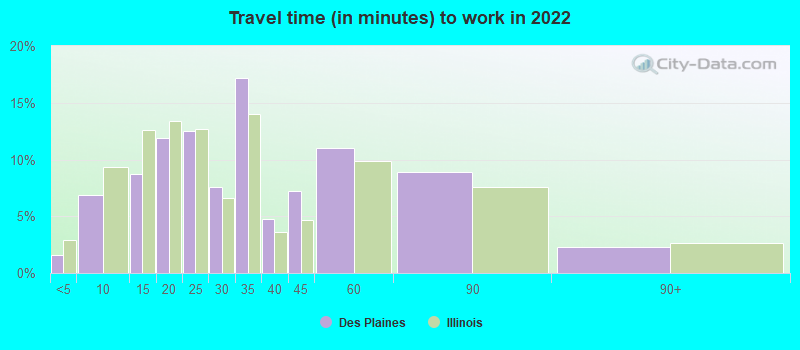
Travel time to work (commute)
- Less than 5 minutes: 401
- 5 to 9 minutes: 1,755
- 10 to 14 minutes: 2,251
- 15 to 19 minutes: 4,036
- 20 to 24 minutes: 3,923
- 25 to 29 minutes: 1,998
- 30 to 34 minutes: 4,051
- 35 to 39 minutes: 907
- 40 to 44 minutes: 1,395
- 45 to 59 minutes: 2,211
- 60 to 89 minutes: 2,256
- 90 or more minutes: 617
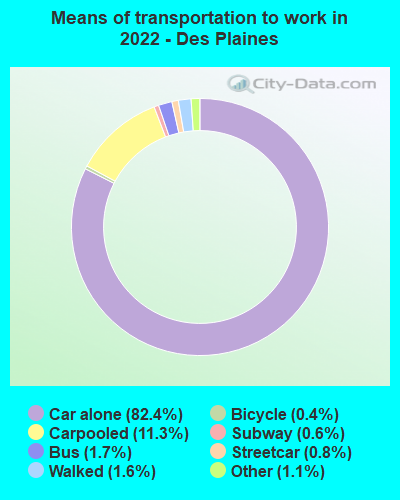
Means of transportation to work:
- Drove a car alone: 28,625 (73.6%)
- Carpooled: 4,220 (10.8%)
- Bus: 553 (1.4%)
- Subway or elevated rail: 220 (0.6%)
- Long-distance train or commuter rail: 140 (0.4%)
- Taxi: 386 (1.0%)
- Bicycle: 140 (0.4%)
- Walked: 581 (1.5%)
- Worked at home: 4,119 (10.6%)

- Unemployment by race in 2022
- Unemployment rate for White non-Hispanic residents
- 4.1%Males
- 2.7%Females
- Unemployment rate for Black residents
- 0.3%Males
- 12.2%Females
- Unemployment rate for Asian residents
- 2.2%Males
- 3.3%Females
- Unemployment rate for other race residents
- 13.7%Males
- 0.8%Females
- Unemployment rate for two or more race residents
- 0.3%Males
- 0.5%Females
- Unemployment rate for Hispanic or Latino residents
- 6.2%Males
- 1.7%Females

- Year of entry for the foreign-born population in Des Plaines, Illinois
- 4,2172010 or later
- 3,9632000 to 2009
- 4,4481990 to 1999
- 3,8481980 to 1989
- 2,3341970 to 1979
- 2,959Before 1970

First ancestries reported:
- Polish: 5,422 (16.6%)
- German: 2,072 (6.3%)
- Italian: 1,285 (3.9%)
- Irish: 1,189 (3.6%)
- American: 956 (2.9%)
- Greek: 687 (2.1%)
- Romanian: 638 (2.0%)
- Bulgarian: 568 (1.7%)
- European: 534 (1.6%)
- English: 525 (1.6%)
- Ukrainian: 465 (1.4%)
- Yugoslavian: 422 (1.3%)
- Iraqi: 351 (1.1%)
- Serbian: 264 (0.8%)
- Russian: 255 (0.8%)
- Assyrian: 254 (0.8%)
- Swedish: 188 (0.6%)
- Haitian: 169 (0.5%)
- Czech: 158 (0.5%)
- Jamaican: 141 (0.4%)
- Nigerian: 105 (0.3%)
- Arab: 87 (0.3%)
- Slovak: 87 (0.3%)
- Croatian: 80 (0.2%)
- Albanian: 79 (0.2%)
- Austrian: 67 (0.2%)
- Eastern European: 66 (0.2%)
- African: 65 (0.2%)
- Macedonian: 58 (0.2%)
- Scandinavian: 57 (0.2%)
- Norwegian: 56 (0.2%)
- Dutch: 54 (0.2%)
- Lithuanian: 51 (0.2%)
- Northern European: 51 (0.2%)
- Lebanese: 46 (0.1%)
- French: 45 (0.1%)
- Scottish: 44 (0.1%)
- Slavic: 43 (0.1%)
- Syrian: 41 (0.1%)
- Ugandan: 39 (0.1%)
- Slovene: 35 (0.1%)
- Armenian: 30 (0.09%)
- Palestinian: 27 (0.08%)
- Iranian: 26 (0.08%)
- British: 25 (0.08%)
- Swiss: 25 (0.08%)
- Hungarian: 21 (0.06%)
- Luxembourger: 17 (0.05%)
- Finnish: 17 (0.05%)
- Latvian: 15 (0.05%)
- Turkish: 14 (0.04%)
- Canadian: 12 (0.04%)
- French Canadian: 10 (0.03%)
- Czechoslovakian: 10 (0.03%)
- Moroccan: 10 (0.03%)
- New Zealander: 9 (0.03%)
- Egyptian: 6 (0.02%)
- Danish: 5 (0.02%)
- Belgian: 4 (0.01%)
- Jordanian: 3 (0.01%)
Most common places of birth for foreign-born residents (%):
| Des Plaines: | 19.2% (3,536) |
| Illinois: | 34.7% (626,958) |
| Des Plaines: | 17.8% (3,273) |
| Illinois: | 9.2% (166,409) |
| Des Plaines: | 13.9% (2,559) |
| Illinois: | 6.9% (124,474) |
| Des Plaines: | 7.2% (1,319) |
| Illinois: | 5.2% (93,003) |
| Des Plaines: | 3.9% (712) |
| Illinois: | 0.8% (14,165) |
| Des Plaines: | 2.9% (539) |
| Illinois: | 0.6% (10,776) |
| Des Plaines: | 2.2% (411) |
| Illinois: | 2.2% (40,393) |
| Des Plaines: | 2.1% (395) |
| Illinois: | 1.6% (29,316) |
| Des Plaines: | 2.1% (384) |
| Illinois: | 0.8% (14,736) |
| Des Plaines: | 1.8% (339) |
| Illinois: | 0.7% (13,214) |
Place of birth for U.S.-born residents:
- This state: 34,415
- Other state: 5,183
- Northeast: 1,249
- Midwest: 2,319
- South: 1,068
- West: 597
91.4% of Des Plaines residents lived in the same house 1 years ago.
Out of people who lived in different houses, 44.1% lived in this county.
Out of people who lived in different counties, 44.1% lived in Illinois.
| Des Plaines: | 91.4% |
| State average: | 88.3% |
Education attainment for males 25 years and older:
- No schooling: 924
- Nursery to 4th grade: 51
- 5th and 6th grade: 339
- 7th and 8th grade: 250
- 9th grade: 318
- 10th grade: 168
- 11th grade: 156
- 12th grade, no diploma: 440
- High school graduate (or equivalency): 4,642
- Less than 1 year of college: 1,183
- Some college more than 1 year, no degree: 2,759
- Associate degree: 1,554
- Bachelor's degree: 4,985
- Master's degree: 2,232
- Professional school degree: 651
- Doctorate degree: 121

Education attainment for females 25 years and older:
- No schooling: 832
- Nursery to 4th grade: 151
- 5th and 6th grade: 331
- 7th and 8th grade: 456
- 9th grade: 129
- 10th grade: 99
- 11th grade: 170
- 12th grade, no diploma: 382
- High school graduate (or equivalency): 4,488
- Less than 1 year of college: 1,293
- Some college more than 1 year, no degree: 2,911
- Associate degree: 2,194
- Bachelor's degree: 5,397
- Master's degree: 2,672
- Professional school degree: 617
- Doctorate degree: 141


Housing units in structures:
- One, detached: 14,162
- One, attached: 1,781
- Two: 267
- 3 or 4: 594
- 5 to 9: 772
- 10 to 19: 1,007
- 20 to 49: 2,414
- 50 or more: 2,703
- Mobile homes: 545
Median worth of mobile homes: $14,964
Housing units lacking complete kitchen facilities in 2022: 1.3%
House/condo owner moved in on average 15 years ago
Renter moved in on average 3 years ago

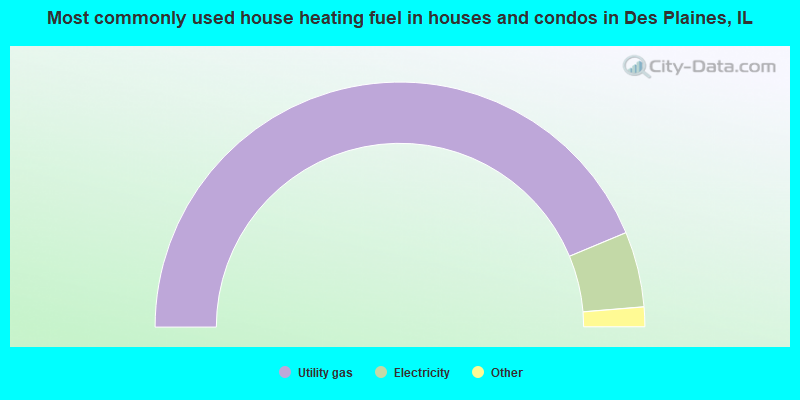
- 87.5%Utility gas
- 10.0%Electricity
- 0.9%Other fuel
- 0.8%Bottled, tank, or LP gas
- 0.5%No fuel used
- 0.3%Wood
- 0.1%Fuel oil, kerosene, etc.
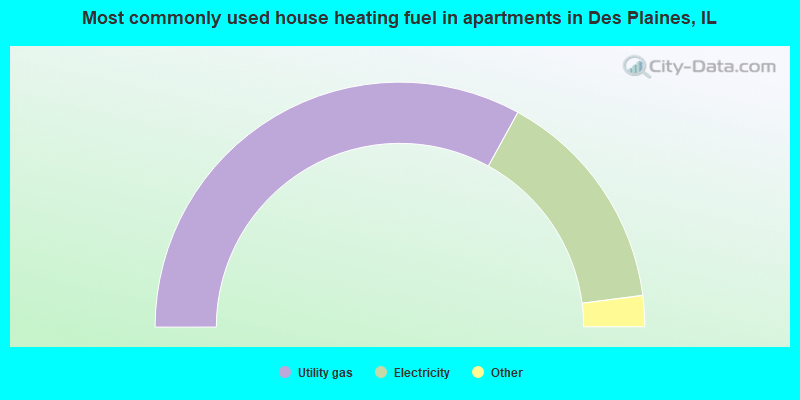
- 66.0%Utility gas
- 29.9%Electricity
- 1.8%Bottled, tank, or LP gas
- 1.5%Other fuel
- 0.2%Fuel oil, kerosene, etc.
- 0.2%No fuel used
- 0.2%Coal or coke
- 0.1%Solar energy
Private vs. public school enrollment:
| Here: | 14.7% |
| Illinois: | 13.3% |
| Here: | 7.6% |
| Illinois: | 9.9% |
| Here: | 25.6% |
| Illinois: | 27.4% |


