Races in Des Plaines, Illinois (IL) Detailed Stats
Data:
Races - White alone (%)
Races - White alone (% change since 2000)
Races - Black alone (%)
Races - Black alone (% change since 2000)
Races - American Indian alone (%)
Races - American Indian alone (% change since 2000)
Races - Asian alone (%)
Races - Asian alone (% change since 2000)
Races - Hispanic (%)
Races - Hispanic (% change since 2000)
Races - Native Hawaiian and Other Pacific Islander alone (%)
Races - Native Hawaiian and Other Pacific Islander alone (% change since 2000)
Races - Two or more races(%)
Races - Two or more races(% change since 2000)
Races - Other race alone (%)
Races - Other race alone (% change since 2000)
Racial diversity
Place of birth - Born in state of residence (%)
Place of birth - Born in state of residence (%) - White
Place of birth - Born in state of residence (%) - Black or African American
Place of birth - Born in state of residence (%) - Asian
Place of birth - Born in state of residence (%) - Hispanic or Latino
Place of birth - Born in state of residence (%) - American Indian and Alaska Native
Place of birth - Born in state of residence (%) - Multirace
Place of birth - Born in state of residence (%) - Other Race
Place of birth - Born in other state (%)
Place of birth - Born in other state (%) - White
Place of birth - Born in other state (%) - Black or African American
Place of birth - Born in other state (%) - Asian
Place of birth - Born in other state (%) - Hispanic or Latino
Place of birth - Born in other state (%) - American Indian and Alaska Native
Place of birth - Born in other state (%) - Multirace
Place of birth - Born in other state (%) - Other Race
Place of birth - Native, outside of US (%)
Place of birth - Native, outside of US (%) - White
Place of birth - Native, outside of US (%) - Black or African American
Place of birth - Native, outside of US (%) - Asian
Place of birth - Native, outside of US (%) - Hispanic or Latino
Place of birth - Native, outside of US (%) - American Indian and Alaska Native
Place of birth - Native, outside of US (%) - Multirace
Place of birth - Native, outside of US (%) - Other Race
Place of birth - Foreign born (%)
Place of birth - Foreign born (%) - White
Place of birth - Foreign born (%) - Black or African American
Place of birth - Foreign born (%) - Asian
Place of birth - Foreign born (%) - Hispanic or Latino
Place of birth - Foreign born (%) - American Indian and Alaska Native
Place of birth - Foreign born (%) - Multirace
Place of birth - Foreign born (%) - Other Race
Residents speaking English at home (%)
Residents speaking English at home - Born in the United States (%)
Residents speaking English at home - Native, born elsewhere (%)
Residents speaking English at home - Foreign born (%)
Residents speaking Spanish at home (%)
Residents speaking Spanish at home - Born in the United States (%)
Residents speaking Spanish at home - Native, born elsewhere (%)
Residents speaking Spanish at home - Foreign born (%)
Residents speaking other language at home (%)
Residents speaking other language at home - Born in the United States (%)
Residents speaking other language at home - Native, born elsewhere (%)
Residents speaking other language at home - Foreign born (%)
Marital status - Never married (%)
Marital status - Now married (%)
Marital status - Separated (%)
Marital status - Widowed (%)
Marital status - Divorced (%)
Ancestries Reported - Arab (%)
Ancestries Reported - Czech (%)
Ancestries Reported - Danish (%)
Ancestries Reported - Dutch (%)
Ancestries Reported - English (%)
Ancestries Reported - French (%)
Ancestries Reported - French Canadian (%)
Ancestries Reported - German (%)
Ancestries Reported - Greek (%)
Ancestries Reported - Hungarian (%)
Ancestries Reported - Irish (%)
Ancestries Reported - Italian (%)
Ancestries Reported - Lithuanian (%)
Ancestries Reported - Norwegian (%)
Ancestries Reported - Polish (%)
Ancestries Reported - Portuguese (%)
Ancestries Reported - Russian (%)
Ancestries Reported - Scotch-Irish (%)
Ancestries Reported - Scottish (%)
Ancestries Reported - Slovak (%)
Ancestries Reported - Subsaharan African (%)
Ancestries Reported - Swedish (%)
Ancestries Reported - Swiss (%)
Ancestries Reported - Ukrainian (%)
Ancestries Reported - United States (%)
Ancestries Reported - Welsh (%)
Ancestries Reported - West Indian (%)
Ancestries Reported - Other (%)
Geographical mobility - Same house 1 year ago (%)
Geographical mobility - Same house 1 year ago (%) - White
Geographical mobility - Same house 1 year ago (%) - Black or African American
Geographical mobility - Same house 1 year ago (%) - Asian
Geographical mobility - Same house 1 year ago (%) - Hispanic or Latino
Geographical mobility - Same house 1 year ago (%) - American Indian and Alaska Native
Geographical mobility - Same house 1 year ago (%) - Multirace
Geographical mobility - Same house 1 year ago (%) - Other Race
Geographical mobility - Moved within same county (%)
Geographical mobility - Moved within same county (%) - White
Geographical mobility - Moved within same county (%) - Black or African American
Geographical mobility - Moved within same county (%) - Asian
Geographical mobility - Moved within same county (%) - Hispanic or Latino
Geographical mobility - Moved within same county (%) - American Indian and Alaska Native
Geographical mobility - Moved within same county (%) - Multirace
Geographical mobility - Moved within same county (%) - Other Race
Geographical mobility - Moved from different county within same state (%)
Geographical mobility - Moved from different county within same state (%) - White
Geographical mobility - Moved from different county within same state (%) - Black or African American
Geographical mobility - Moved from different county within same state (%) - Asian
Geographical mobility - Moved from different county within same state (%) - Hispanic or Latino
Geographical mobility - Moved from different county within same state (%) - American Indian and Alaska Native
Geographical mobility - Moved from different county within same state (%) - Multirace
Geographical mobility - Moved from different county within same state (%) - Other Race
Geographical mobility - Moved from different state (%)
Geographical mobility - Moved from different state (%) - White
Geographical mobility - Moved from different state (%) - Black or African American
Geographical mobility - Moved from different state (%) - Asian
Geographical mobility - Moved from different state (%) - Hispanic or Latino
Geographical mobility - Moved from different state (%) - American Indian and Alaska Native
Geographical mobility - Moved from different state (%) - Multirace
Geographical mobility - Moved from different state (%) - Other Race
Geographical mobility - Moved from abroad (%)
Geographical mobility - Moved from abroad (%) - White
Geographical mobility - Moved from abroad (%) - Black or African American
Geographical mobility - Moved from abroad (%) - Asian
Geographical mobility - Moved from abroad (%) - Hispanic or Latino
Geographical mobility - Moved from abroad (%) - American Indian and Alaska Native
Geographical mobility - Moved from abroad (%) - Multirace
Geographical mobility - Moved from abroad (%) - Other Race
Place of birth for the foreign-born population - Ireland (%)
Place of birth for the foreign-born population - Denmark (%)
Place of birth for the foreign-born population - Norway (%)
Place of birth for the foreign-born population - Sweden (%)
Place of birth for the foreign-born population - United Kingdom (%)
Place of birth for the foreign-born population - England (%)
Place of birth for the foreign-born population - Scotland (%)
Place of birth for the foreign-born population - Other Northern Europe (%)
Place of birth for the foreign-born population - Austria (%)
Place of birth for the foreign-born population - Belgium (%)
Place of birth for the foreign-born population - France (%)
Place of birth for the foreign-born population - Germany (%)
Place of birth for the foreign-born population - Netherlands (%)
Place of birth for the foreign-born population - Switzerland (%)
Place of birth for the foreign-born population - Other Western Europe (%)
Place of birth for the foreign-born population - Greece (%)
Place of birth for the foreign-born population - Italy (%)
Place of birth for the foreign-born population - Portugal (%)
Place of birth for the foreign-born population - Spain (%)
Place of birth for the foreign-born population - Other Southern Europe (%)
Place of birth for the foreign-born population - Albania (%)
Place of birth for the foreign-born population - Belarus (%)
Place of birth for the foreign-born population - Bosnia and Herzegovina (%)
Place of birth for the foreign-born population - Bulgaria (%)
Place of birth for the foreign-born population - Croatia (%)
Place of birth for the foreign-born population - Czechoslovakia (%)
Place of birth for the foreign-born population - Hungary (%)
Place of birth for the foreign-born population - Latvia (%)
Place of birth for the foreign-born population - Lithuania (%)
Place of birth for the foreign-born population - North Macedonia (Macedonia) (%)
Place of birth for the foreign-born population - Moldova (%)
Place of birth for the foreign-born population - Poland (%)
Place of birth for the foreign-born population - Romania (%)
Place of birth for the foreign-born population - Russia (%)
Place of birth for the foreign-born population - Serbia (%)
Place of birth for the foreign-born population - Ukraine (%)
Place of birth for the foreign-born population - Other Eastern Europe (%)
Place of birth for the foreign-born population - China (%)
Place of birth for the foreign-born population - Hong Kong (%)
Place of birth for the foreign-born population - Taiwan (%)
Place of birth for the foreign-born population - Japan (%)
Place of birth for the foreign-born population - Korea (%)
Place of birth for the foreign-born population - Other Eastern Asia (%)
Place of birth for the foreign-born population - Afghanistan (%)
Place of birth for the foreign-born population - Bangladesh (%)
Place of birth for the foreign-born population - India (%)
Place of birth for the foreign-born population - Iran (%)
Place of birth for the foreign-born population - Kazakhstan (%)
Place of birth for the foreign-born population - Nepal (%)
Place of birth for the foreign-born population - Pakistan (%)
Place of birth for the foreign-born population - Sri Lanka (%)
Place of birth for the foreign-born population - Uzbekistan (%)
Place of birth for the foreign-born population - Other South Central Asia (%)
Place of birth for the foreign-born population - Burma (%)
Place of birth for the foreign-born population - Cambodia (%)
Place of birth for the foreign-born population - Indonesia (%)
Place of birth for the foreign-born population - Laos (%)
Place of birth for the foreign-born population - Malaysia (%)
Place of birth for the foreign-born population - Philippines (%)
Place of birth for the foreign-born population - Singapore (%)
Place of birth for the foreign-born population - Thailand (%)
Place of birth for the foreign-born population - Vietnam (%)
Place of birth for the foreign-born population - Other South Eastern Asia (%)
Place of birth for the foreign-born population - Armenia (%)
Place of birth for the foreign-born population - Iraq (%)
Place of birth for the foreign-born population - Israel (%)
Place of birth for the foreign-born population - Jordan (%)
Place of birth for the foreign-born population - Kuwait (%)
Place of birth for the foreign-born population - Lebanon (%)
Place of birth for the foreign-born population - Saudi Arabia (%)
Place of birth for the foreign-born population - Syria (%)
Place of birth for the foreign-born population - Turkey (%)
Place of birth for the foreign-born population - Yemen (%)
Place of birth for the foreign-born population - Other Western Asia (%)
Place of birth for the foreign-born population - Eritrea (%)
Place of birth for the foreign-born population - Ethiopia (%)
Place of birth for the foreign-born population - Kenya (%)
Place of birth for the foreign-born population - Somalia (%)
Place of birth for the foreign-born population - Uganda (%)
Place of birth for the foreign-born population - Zimbabwe (%)
Place of birth for the foreign-born population - Other Eastern Africa (%)
Place of birth for the foreign-born population - Cameroon (%)
Place of birth for the foreign-born population - Congo (%)
Place of birth for the foreign-born population - Democratic Republic of Congo (Zaire) (%)
Place of birth for the foreign-born population - Other Middle Africa (%)
Place of birth for the foreign-born population - Egypt (%)
Place of birth for the foreign-born population - Morocco (%)
Place of birth for the foreign-born population - Sudan (%)
Place of birth for the foreign-born population - Other Northern Africa (%)
Place of birth for the foreign-born population - South Africa (%)
Place of birth for the foreign-born population - Other Southern Africa (%)
Place of birth for the foreign-born population - Cabo Verde (%)
Place of birth for the foreign-born population - Ghana (%)
Place of birth for the foreign-born population - Liberia (%)
Place of birth for the foreign-born population - Nigeria (%)
Place of birth for the foreign-born population - Senegal (%)
Place of birth for the foreign-born population - Sierra Leone (%)
Place of birth for the foreign-born population - Other Western Africa (%)
Place of birth for the foreign-born population - Australia (%)
Place of birth for the foreign-born population - New Zealand (%)
Place of birth for the foreign-born population - Fiji (%)
Place of birth for the foreign-born population - Micronesia (%)
Place of birth for the foreign-born population - Bahamas (%)
Place of birth for the foreign-born population - Barbados (%)
Place of birth for the foreign-born population - Cuba (%)
Place of birth for the foreign-born population - Dominica (%)
Place of birth for the foreign-born population - Dominican Republic (%)
Place of birth for the foreign-born population - Grenada (%)
Place of birth for the foreign-born population - Haiti (%)
Place of birth for the foreign-born population - Jamaica (%)
Place of birth for the foreign-born population - St. Vincent and the Grenadines (%)
Place of birth for the foreign-born population - Trinidad and Tobago (%)
Place of birth for the foreign-born population - West Indies (%)
Place of birth for the foreign-born population - Other Caribbean (%)
Place of birth for the foreign-born population - Belize (%)
Place of birth for the foreign-born population - Costa Rica (%)
Place of birth for the foreign-born population - El Salvador (%)
Place of birth for the foreign-born population - Guatemala (%)
Place of birth for the foreign-born population - Honduras (%)
Place of birth for the foreign-born population - Mexico (%)
Place of birth for the foreign-born population - Nicaragua (%)
Place of birth for the foreign-born population - Panama (%)
Place of birth for the foreign-born population - Other Central America (%)
Place of birth for the foreign-born population - Argentina (%)
Place of birth for the foreign-born population - Bolivia (%)
Place of birth for the foreign-born population - Brazil (%)
Place of birth for the foreign-born population - Chile (%)
Place of birth for the foreign-born population - Colombia (%)
Place of birth for the foreign-born population - Ecuador (%)
Place of birth for the foreign-born population - Guyana (%)
Place of birth for the foreign-born population - Peru (%)
Place of birth for the foreign-born population - Uruguay (%)
Place of birth for the foreign-born population - Venezuela (%)
Place of birth for the foreign-born population - Other South America (%)
Place of birth for the foreign-born population - Canada (%)
Place of birth for the foreign-born population - Other Northern America (%)
Place of birth for the foreign-born population - Other (%)
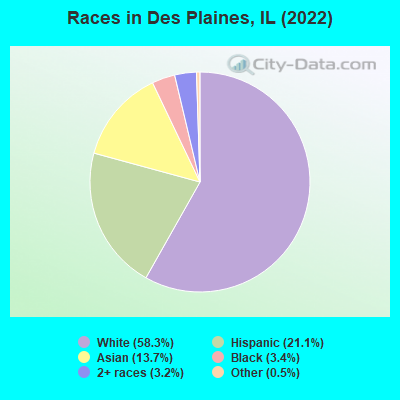
According to 2022 data, the most numerous races in Des Plaines, IL are White alone (34,275 residents), Hispanic (12,387 residents), and Black alone (1,996 residents). 54.6% of Des Plaines residents speak English at home. 31.3% of Des Plaines, IL residents are foreign-born (11.2% born in Europe, 10.9% born in Asia, 7.9% born in Latin America), which is 55.3% greater than the foreign-born rate of 14.0% across the entire state of Illinois.
Race distribution in Des Plaines
2000 2022
8,424,140 67.8% White alone 1,856,152 14.9% Black alone 1,530,262 12.3% Hispanic 419,916 3.4% Asian alone 153,996 1.2% Two or more races 13,479 0.1% Other race alone 18,232 0.1% American Indian alone 3,116 0.03% Native Hawaiian and Other
7,356,301 58.5% White alone 2,299,726 18.3% Hispanic 1,660,423 13.2% Black alone 747,296 5.9% Asian alone 458,599 3.6% Two or more races 45,386 0.4% Other race alone 10,405 0.08% American Indian alone 3,896 0.03% Native Hawaiian and Other
Income and house value in Des Plaines Median household income in 2022 $85,081 White non-Hispanic householders$70,993 Black householders$99,912 Asian householders$115,476 Some other race householders$70,140 Two or more races householders$74,138 Hispanic or Latino race householdersMedian 2022 house value $332,068 White Non-Hispanic householders$167,462 Black or African American householders$550,411 American Indian or Alaska Native householders $333,139 Asian householders$284,221 Some other race householders$289,756 Two or more races householders$293,862 Hispanic or Latino householders
Median age by race in Des Plaines
47.4 Median age for White residents46.2 48.6 37.3 Median age for Black or African American residents38.0 37.4 44.4 Median age for American Indian / Alaska Native residents45.2 46.9 43.9 Median age for Asian residents39.7 48.6 -687,999,999.3 Median age for Native Hawaiian / Pacific Islander residents-918,721,460.3 -610,229,276.3 43.1 Median age for Other race residents38.2 45.1 30.4 Median age for Two or more races residents28.5 31.3 48.9 Median age for White alone residents48.0 49.2 33.1 Median age for Hispanic or Latino residents32.3 34.2
Owner/renter occupied households by race in Des Plaines
House owners and renters - White residents 12,698 80.4% Owner occupied3,086 19.6% Renter occupiedHouse owners and renters - Black or African American residents 351 48.3% Owner occupied375 51.7% Renter occupiedHouse owners and renters - American Indian / Alaska Native residents 147 57.8% Owner occupied107 42.2% Renter occupiedHouse owners and renters - Asian residents 2,397 88.0% Owner occupied328 12.0% Renter occupiedHouse owners and renters - Other race residents 894 78.9% Owner occupied239 21.1% Renter occupiedHouse owners and renters - Two or more races residents 1,582 64.4% Owner occupied875 35.6% Renter occupiedHouse owners and renters - White alone residents 12,766 81.5% Owner occupied2,894 18.5% Renter occupiedHouse owners and renters - Hispanic or Latino residents 2,377 68.0% Owner occupied1,119 32.0% Renter occupied
Language usage in Des Plaines
English speakers - Total 54.6% of residents of Des Plaines speak English at home.
15.3% of residents speak Spanish at home 5,540 64.9% Speak English very well2,998 35.1% Speak English less than very well30.5% of residents speak other language at home 10,176 59.7% Speak English very well6,868 40.3% Speak English less than very well
English speakers - Born in the United States 85.2% of residents of Des Plaines speak English at home.
8.8% of residents speak Spanish at home 350 79.0% Speak English very well93 21.0% Speak English less than very well6.2% of residents speak other language at home 265 85.2% Speak English very well46 14.8% Speak English less than very well
English speakers - Native, born elsewhere 58.3% of residents of Des Plaines speak English at home.
23.8% of residents speak Spanish at home 107 57.2% Speak English very well80 42.8% Speak English less than very well18.0% of residents speak other language at home 114 80.3% Speak English very well28 19.7% Speak English less than very well
English speakers - Foreign-born 8.3% of residents of Des Plaines speak English at home.
22.9% of residents speak Spanish at home 1,885 44.9% Speak English very well2,314 55.1% Speak English less than very well68.6% of residents speak other language at home 6,287 50.0% Speak English very well6,279 50.0% Speak English less than very well
White (Caucasian) - Speak only English Native:
86.8% (22,294)Foreign-born:
9.8% (689)
White (Caucasian) - Speak another language Native:
12.6% (3,236)Foreign-born:
89.8% (6,300)
Black or African American - Speak only English Native:
97.7% (1,619)Foreign-born:
53.5% (236)
Black or African American - Speak another language Native:
2.3% (38)Foreign-born:
50.3% (222)
American Indian / Alaska Native - Speak another language Native:
75.5% (255)Foreign-born:
100.0% (400)
Asian - Speak only English Native:
49.4% (1,060)Foreign-born:
6.3% (353)
Asian - Speak another language Native:
50.6% (1,085)Foreign-born:
94.4% (5,304)
Other race - Speak only English Native:
28.3% (551)Foreign-born:
4.9% (73)
Other race - Speak another language Native:
72.0% (1,400)Foreign-born:
95.1% (1,427)
Two or more races - Speak only English Native:
62.5% (3,533)Foreign-born:
6.0% (134)
Two or more races - Speak another language Native:
36.6% (2,071)Foreign-born:
94.0% (2,105)
White alone - Speak only English Native:
86.6% (21,861)Foreign-born:
9.1% (697)
White alone - Speak another language Native:
14.0% (3,532)Foreign-born:
91.6% (7,036)
Hispanic or Latino - Speak only English Native:
44.8% (3,155)Foreign-born:
4.6% (206)
Hispanic or Latino - Speak another language Native:
55.9% (3,937)Foreign-born:
95.3% (4,216)
Foreign-born residents in Des Plaines 18,384 residents are foreign born (11.2% Europe , 10.9% Asia , 7.9% Latin America ).
This city:
31.3%Illinois:
14.1%
Marital status for residents in Des Plaines Marital status - White (Caucasian) population 15 years and over
Males 31.7% Never married54.6% Now married1.3% Separated4.4% Widowed8.0% DivorcedFemales 25.7% Never married47.8% Now married1.0% Separated12.1% Widowed13.4% DivorcedWomen who gave birth in the past 12 months Now married:
78.4% (256)Unmarried:
21.6% (70)
Women who did not give birth in the past 12 months Now married:
46.1% (3,010)Unmarried:
53.9% (3,521)
Marital status - Black or African American population 15 years and over
Males 53.7% Never married34.2% Now married1.2% Separated0.0% Widowed11.0% DivorcedFemales 60.8% Never married23.2% Now married9.0% Separated0.5% Widowed6.4% DivorcedWomen who gave birth in the past 12 months Now married:
100.0% (45)Unmarried:
0.0% (0)
Women who did not give birth in the past 12 months Now married:
13.5% (87)Unmarried:
86.5% (556)
Marital status - American Indian / Alaska Native population 15 years and over
Males 41.7% Never married46.6% Now married4.9% Separated2.5% Widowed4.3% DivorcedFemales 16.1% Never married35.5% Now married0.0% Separated46.2% Widowed2.2% DivorcedWomen who did not give birth in the past 12 months Now married:
57.0% (81)Unmarried:
43.0% (61)
Marital status - Asian population 15 years and over
Males 31.1% Never married66.1% Now married0.7% Separated0.5% Widowed1.5% DivorcedFemales 17.9% Never married65.2% Now married1.0% Separated11.7% Widowed4.1% DivorcedWomen who gave birth in the past 12 months Now married:
100.0% (56)Unmarried:
0.0% (0)
Women who did not give birth in the past 12 months Now married:
59.0% (908)Unmarried:
41.0% (630)
Marital status - Other race population 15 years and over
Males 41.3% Never married54.8% Now married0.0% Separated0.0% Widowed3.9% DivorcedFemales 26.9% Never married59.9% Now married2.3% Separated0.3% Widowed10.6% DivorcedWomen who gave birth in the past 12 months Now married:
0.0% (0)Unmarried:
100.0% (21)
Women who did not give birth in the past 12 months Now married:
57.6% (519)Unmarried:
42.4% (383)
Marital status - Two or more races population 15 years and over
Males 53.6% Never married40.4% Now married0.1% Separated1.9% Widowed4.0% DivorcedFemales 40.8% Never married39.7% Now married3.7% Separated5.3% Widowed10.5% DivorcedWomen who gave birth in the past 12 months Now married:
90.0% (125)Unmarried:
10.0% (14)
Women who did not give birth in the past 12 months Now married:
33.1% (650)Unmarried:
66.9% (1,316)
Marital status - White alone, not Hispanic / Latino population 15 years and over
Males 29.0% Never married56.3% Now married1.4% Separated4.7% Widowed8.6% DivorcedFemales 24.6% Never married48.2% Now married1.1% Separated12.4% Widowed13.7% DivorcedWomen who gave birth in the past 12 months Now married:
87.0% (243)Unmarried:
13.0% (36)
Women who did not give birth in the past 12 months Now married:
46.0% (2,926)Unmarried:
54.0% (3,436)
Marital status - Hispanic or Latino population 15 years and over
Males 48.1% Never married46.0% Now married0.3% Separated1.6% Widowed4.0% DivorcedFemales 34.8% Never married47.1% Now married2.7% Separated5.5% Widowed9.9% DivorcedWomen who gave birth in the past 12 months Now married:
46.0% (63)Unmarried:
54.0% (74)
Women who did not give birth in the past 12 months Now married:
45.0% (1,395)Unmarried:
55.0% (1,707)
Ancestries in Des Plaines
5,422 16.6% Polish2,072 6.3% German1,285 3.9% Italian1,189 3.6% Irish956 2.9% American687 2.1% Greek638 2.0% Romanian568 1.7% Bulgarian534 1.6% European525 1.6% English465 1.4% Ukrainian422 1.3% Yugoslavian351 1.1% Iraqi264 0.8% Serbian255 0.8% Russian254 0.8% Assyrian188 0.6% Swedish169 0.5% Haitian158 0.5% Czech141 0.4% Jamaican105 0.3% Nigerian87 0.3% Arab87 0.3% Slovak80 0.2% Croatian79 0.2% Albanian67 0.2% Austrian66 0.2% Eastern European65 0.2% African58 0.2% Macedonian57 0.2% Scandinavian56 0.2% Norwegian54 0.2% Dutch51 0.2% Lithuanian51 0.2% Northern European46 0.1% Lebanese45 0.1% French44 0.1% Scottish43 0.1% Slavic41 0.1% Syrian39 0.1% Ugandan35 0.1% Slovene30 0.09% Armenian27 0.08% Palestinian26 0.08% Iranian25 0.08% British25 0.08% Swiss21 0.06% Hungarian17 0.05% Luxembourger17 0.05% Finnish15 0.05% Latvian14 0.04% Turkish12 0.04% Canadian10 0.03% French Canadian10 0.03% Czechoslovakian10 0.03% Moroccan9 0.03% New Zealander6 0.02% Egyptian5 0.02% Danish4 0.01% Belgian3 0.01% Jordanian
Geographical mobility in Des Plaines Same house 1 year ago 31,731 92.7% White (Caucasian)1,825 82.0% Black or African American658 91.5% American Indian / Alaska Native7,204 89.0% Asian3,213 92.4% Other race7,145 83.0% Two or more races31,817 93.3% White alone, not Hispanic / Latino10,751 88.8% Hispanic or LatinoMoved within same county 1,621 4.7% White / Caucasian298 13.4% Black or African American61 8.5% American Indian / Alaska Native599 7.4% Asian230 6.6% Other race875 10.2% Two or more races1,495 4.4% White alone, not Hispanic / Latino1,056 8.7% Hispanic or LatinoMoved within same state 207 0.6% White / Caucasian44 2.0% Black or African American100 1.2% Asian12 0.3% Other race71 0.8% Two or more races204 0.6% White alone, not Hispanic / Latino98 0.8% Hispanic or LatinoMoved from different state 404 1.2% White / Caucasian8 0.4% Black or African American86 1.1% Asian12 0.4% Other race68 0.8% Two or more races398 1.2% White alone, not Hispanic / Latino62 0.5% Hispanic or LatinoMoved from abroad 66 0.2% White40 1.8% Black or African American61 0.8% Asian605 7.0% Two or more races47 0.1% White alone, not Hispanic / Latino110 0.9% Hispanic or Latino
Children Nativity (place of birth) in Des Plaines
Children under 6 years - Living with two parents Both parents native 1,257 100.0% NativeBoth parents foreign-born 762 91.5% Native71 8.5% Foreign-bornOne native, one foreign-born parent 293 100.0% NativeChildren under 6 years - Living with one parent Native parent 645 100.0% NativeForeign-born parent 126 70.7% Native53 29.3% Foreign-bornChildren 6 to 17 years - Living with two parents Both parents native 2,583 100.0% NativeBoth parents foreign-born 2,104 88.5% Native272 11.5% Foreign-bornOne native, one foreign-born parent 658 100.0% NativeChildren 6 to 17 years - Living with one parent Native parent 1,406 100.0% NativeForeign-born parent 832 57.1% Native626 42.9% Foreign-born
Place of birth for residents in Des Plaines 6,664 Europe6,515 Asia5,863 Eastern Europe4,778 Americas4,705 Latin America4,007 Central America3,383 South Central Asia1,728 South Eastern Asia872 Western Asia530 Eastern Asia423 South America417 Africa340 Western Europe325 Southern Europe274 Caribbean174 Northern Africa140 Western Africa135 Northern Europe79 China72 Northern America54 Eastern Africa30 Middle Africa7 Oceania7 Australia and New Zealand Subregion5 Southern Africa3,531 Mexico3,091 India2,652 Poland1,325 Philippines745 Bulgaria471 Bosnia and Herzegovina416 Korea389 Ukraine382 Romania362 Iraq267 Germany264 Vietnam252 El Salvador208 Belarus207 Serbia191 Greece184 Russia175 Pakistan164 Colombia150 Jamaica144 Syria140 Nigeria135 Ecuador133 Italy122 North Macedonia (Macedonia)118 Azerbaijan118 Guatemala117 Czechoslovakia107 Haiti105 Thailand87 Turkey72 Canada66 Jordan64 Venezuela61 China49 Saudi Arabia48 Honduras45 England36 Ireland36 Argentina35 Austria34 Uganda32 Bangladesh28 Panama24 Croatia24 Japan24 Hungary23 Iran23 Georgia22 Brazil21 Scotland20 France17 Kazakhstan17 Burma (Myanmar)16 Netherlands16 Cuba16 Nicaragua15 Albania12 Israel12 Moldova10 Lithuania10 United Kingdom10 Sweden10 Belize10 Indonesia9 Zimbabwe9 Morocco9 Taiwan8 Norway7 New Zealand7 Hong Kong6 United Arab Emirates5 South Africa4 Cambodia
Grandparents responsible for own grandchildren in Des Plaines
Grandparents (30 to 59 years) White / Caucasian 35 28.8% Responsible for grandchildren86 71.2% Not responsible for grandchildrenBlack or African American 35 100.0% Not responsible for grandchildrenAmerican Indian / Alaska Native 1 72.5% Not responsible for grandchildrenAsian 20 34.4% Responsible for grandchildren38 65.6% Not responsible for grandchildrenOther race 26 27.7% Responsible for grandchildren67 72.3% Not responsible for grandchildrenTwo or more races 14 8.0% Responsible for grandchildren160 92.0% Not responsible for grandchildrenWhite alone, not Hispanic / Latino 46 42.8% Responsible for grandchildren61 57.2% Not responsible for grandchildrenHispanic or Latino 29 13.3% Responsible for grandchildren192 86.7% Not responsible for grandchildrenGrandparents (60 years and over) White / Caucasian 47 11.6% Responsible for grandchildren360 88.4% Not responsible for grandchildrenAmerican Indian / Alaska Native 65 100.0% Not responsible for grandchildrenAsian 24 7.5% Responsible for grandchildren297 92.5% Not responsible for grandchildrenOther race 3 100.0% Not responsible for grandchildrenTwo or more races 61 55.6% Responsible for grandchildren49 44.4% Not responsible for grandchildrenWhite alone, not Hispanic / Latino 58 14.1% Responsible for grandchildren353 85.9% Not responsible for grandchildrenHispanic or Latino 37 20.4% Responsible for grandchildren143 79.6% Not responsible for grandchildren