Des Moines, WA (Washington) Houses and Residents
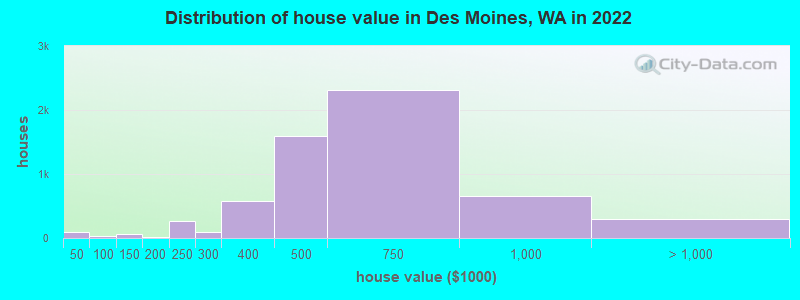
Estimated median house or condo value in 2022: $547,098 (it was $170,000 in 2000 )
Des Moines:
$547,098Washington:
$569,500
Lower value quartile - upper value quartile: $467,886 - $745,375Mean price in 2022: Detached houses: $657,038 Here:
$657,038State:
$734,307
Townhouses or other attached units: $454,869 Here:
$454,869State:
$657,697
In 2-unit structures: $914,352 Here:
$914,352State:
$534,634
In 3-to-4-unit structures: $919,975 Here:
$919,975State:
$510,239
In 5-or-more-unit structures: $454,428 Here:
$454,428State:
$503,183
Mobile homes: $245,377 Here:
$245,377State:
$218,362
Total population: 31,011 (Urban population: 29,409, Rural population: 0)
Houses: 13,437 (12,774 occupied: 7,573 owner occupied, 5,183 renter occupied )
% of renters here:
41%State:
36%
Housing density: 2,120 houses/condos per square mile
Median price asked for vacant for-sale houses and condos in 2022: $779,392.
Median contract rent in 2022: $1,506 (lower quartile is $1,269, upper quartile is $1,853)
Median rent asked for vacant for-rent units in 2022: $2,744
Median gross rent in Des Moines, WA in 2022: $1,633
Housing units in Des Moines with a mortgage: 5,207 (554 second mortgage, 9 home equity loan, 478 both second mortgage and home equity loan )Houses without a mortgage: 90
Median household income for houses/condos with a mortgage: $133,403
Median household income for apartments without a mortgage: $78,564
Median monthly housing costs: $1,692
Data:
Median house or condo value ($)
Median house or condo value ($ change since 2000)
Median house or condo value ($) - White
Median house or condo value ($) - Black or African American
Median house or condo value ($) - Asian
Median house or condo value ($) - Hispanic or Latino
Median house or condo value ($) - American Indian and Alaska Native
Median house or condo value ($) - Multirace
Median house or condo value ($) - Other Race
Median price asked for mobile homes ($)
Household density (households per square mile)
Mean house or condo value by units in structure - 1, detached ($)
Mean house or condo value by units in structure - 1, attached ($)
Mean house or condo value by units in structure - 2 ($)
Mean house or condo value by units in structure by units in structure - 3 or 4 ($)
Mean house or condo value by units in structure - 5 or more ($)
Mean house or condo value by units in structure - Boat, RV, van, etc. ($)
Mean house or condo value by units in structure - Mobile home ($)
Median contract rent ($)
Median contract rent - Lower quartile ($)
Median contract rent - Upper quartile ($)
Median gross rent ($)
Urban houses (%)
Rural houses (%)
Houses occupied (%)
Houses occupied (% change since 2000)
Houses owner occupied (%)
Houses owner occupied (% change since 2000)
Houses renter occupied (%)
Houses renter occupied (% change since 2000)
Vacant housing units - For rent (%)
Vacant housing units - For rent (% change since 2000)
Vacant housing units - For sale only (%)
Vacant housing units - For sale only (% change since 2000)
Vacant housing units - Rented or sold, not occupied (%)
Vacant housing units - Rented or sold, not occupied (% change since 2000)
Vacant housing units - For seasonal, recreational, or occasional use (%)
Vacant housing units - For seasonal, recreational, or occasional use (% change since 2000)
Vacant housing units - For migrant workers (%)
Vacant housing units - For migrant workers (% change since 2000)
Vacant housing units - Other vacant (%)
Vacant housing units - Other vacant (% change since 2000)
Median monthly housing costs ($)
Median household income for houses/condos with a mortgage ($)
Median household income for houses/condos without a mortgage ($)
Median household income ($)
Median household income ($) - White
Median household income ($) - Black or African American
Median household income ($) - Asian
Median household income ($) - Hispanic or Latino
Median household income ($) - American Indian and Alaska Native
Median household income ($) - Multirace
Median household income ($) - Other Race
Mortgage status - with mortgage (%)
Mortgage status - with second mortgage (%)
Mortgage status - with home equity loan (%)
Mortgage status - with both second mortgage and home equity loan (%)
Mortgage status - without a mortgage (%)
Median year house/condo built
Median year apartment built
Household type by relationship - Male householder living alone (%)
Household type by relationship - Male householder not living alone (%)
Household type by relationship - Female householder living alone (%)
Household type by relationship - Female householder not living alone (%)
Household type by relationship - Opposite-Sex spouse (%)
Household type by relationship - Same-Sex spouse (%)
Household type by relationship - Opposite-Sex unmarried partner (%)
Household type by relationship - Same-Sex unmarried partner (%)
Household type by relationship - In group quarters (%)
Size of family households - 2-person household (%)
Size of family households - 3-person household (%)
Size of family households - 4-person household (%)
Size of family households - 5-person household (%)
Size of family households - 6-person household (%)
Size of family households - 7-or-more-person household (%)
Size of nonfamily households - 1-person household (%)
Size of nonfamily households - 2-person household (%)
Size of nonfamily households - 3-person household (%)
Size of nonfamily households - 4-person household (%)
Size of nonfamily households - 5-person household (%)
Size of nonfamily households - 6-person household (%)
Size of nonfamily households - 7-or-moreperson household (%)
Year house built - Built 2010 or later (%)
Year house built - Built 2000 to 2009 (%)
Year house built - Built 1990 to 1999 (%)
Year house built - Built 1980 to 1989 (%)
Year house built - Built 1970 to 1979 (%)
Year house built - Built 1960 to 1969 (%)
Year house built - Built 1950 to 1959 (%)
Year house built - Built 1940 to 1949 (%)
Year house built - Built 1939 or earlier (%)
Median number of rooms in houses and condos
Median number of rooms in apartments
Median number of bedrooms in owner occupied houses
Mean number of bedrooms in owner occupied houses
Median number of bedrooms in renter occupied houses
Mean number of bedrooms in renter occupied houses
Median number of vehichles in owner occupied houses
Mean number of vehichles in owner occupied houses
Median number of vehichles in renter occupied houses
Mean number of vehichles in renter occupied houses
Rooms in owner-occupied houses - 1 room (%)
Rooms in owner-occupied houses - 2 rooms (%)
Rooms in owner-occupied houses - 3 rooms (%)
Rooms in owner-occupied houses - 4 rooms (%)
Rooms in owner-occupied houses - 5 rooms (%)
Rooms in owner-occupied houses - 6 rooms (%)
Rooms in owner-occupied houses - 7 rooms (%)
Rooms in owner-occupied houses - 8 rooms (%)
Rooms in owner-occupied houses - 9+ rooms (%)
Rooms in renter-occupied houses - 1 room (%)
Rooms in renter-occupied houses - 2 rooms (%)
Rooms in renter-occupied houses - 3 rooms (%)
Rooms in renter-occupied houses - 4 rooms (%)
Rooms in renter-occupied houses - 5 rooms (%)
Rooms in renter-occupied houses - 6 rooms (%)
Rooms in renter-occupied houses - 7 rooms (%)
Rooms in renter-occupied houses - 8 rooms (%)
Rooms in renter-occupied houses - 9+ rooms (%)
Bedrooms in owner-occupied houses - no bedrooms (%)
Bedrooms in owner-occupied houses - 1 bedroom (%)
Bedrooms in owner-occupied houses - 2 bedrooms (%)
Bedrooms in owner-occupied houses - 3 bedrooms (%)
Bedrooms in owner-occupied houses - 4 bedrooms (%)
Bedrooms in owner-occupied houses - 5+ bedrooms (%)
Bedrooms in renter-occupied houses - no bedrooms (%)
Bedrooms in renter-occupied houses - 1 bedroom (%)
Bedrooms in renter-occupied houses - 2 bedrooms (%)
Bedrooms in renter-occupied houses - 3 bedrooms (%)
Bedrooms in renter-occupied houses - 4 bedrooms (%)
Bedrooms in renter-occupied houses - 5+ bedrooms (%)
Vehicles available in owner-occupied houses - no vehicle available (%)
Vehicles available in owner-occupied houses - 1 vehicle available(%)
Vehicles available in owner-occupied houses - 2 Vehicles available (%)
Vehicles available in owner-occupied houses - 3 Vehicles available (%)
Vehicles available in owner-occupied houses - 4 Vehicles available (%)
Vehicles available in owner-occupied houses - 5+ Vehicles available (%)
Vehicles available in renter-occupied houses - no vehicle available (%)
Vehicles available in renter-occupied houses - 1 vehicle available (%)
Vehicles available in renter-occupied houses - 2 Vehicles available (%)
Vehicles available in renter-occupied houses - 3 Vehicles available (%)
Vehicles available in renter-occupied houses - 4 Vehicles available (%)
Vehicles available in renter-occupied houses - 5+ Vehicles available (%)
Housing units in structures - 1, detached (%)
Housing units in structures - 1, attached (%)
Housing units in structures - 2 (%)
Housing units in structures - 3 or 4 (%)
Housing units in structures - 5 to 9 (%)
Housing units in structures - 10 to 19 (%)
Housing units in structures - 20 to 49 (%)
Housing units in structures - 50 or more (%)
Housing units in structures - Mobile home (%)
Housing units in structures - Boat, RV, van, etc. (%)
Housing units in structures - Owners - 1, detached (%)
Housing units in structures - Owners - 1, attached (%)
Housing units in structures - Owners - 2 (%)
Housing units in structures - Owners - 3 or 4 (%)
Housing units in structures - Owners - 5 to 9 (%)
Housing units in structures - Owners - 10 to 19 (%)
Housing units in structures - Owners - 20 to 49 (%)
Housing units in structures - Owners - 50 or more (%)
Housing units in structures - Owners - Mobile home (%)
Housing units in structures - Owners - Boat, RV, van, etc. (%)
Housing units in structures - Renters - 1, detached (%)
Housing units in structures - Renters - 1, attached (%)
Housing units in structures - Renters - 2 (%)
Housing units in structures - Renters - 3 or 4 (%)
Housing units in structures - Renters - 5 to 9 (%)
Housing units in structures - Renters - 10 to 19 (%)
Housing units in structures - Renters - 20 to 49 (%)
Housing units in structures - Renters - 50 or more (%)
Housing units in structures - Renters - Mobile home (%)
Housing units in structures - Renters - Boat, RV, van, etc. (%)
House/condo owner moved in on average (years ago)
Renter moved in on average (years ago)
Year householder moved into unit - Moved in 1999 to March 2000 (%)
Year householder moved into unit - Moved in 1999 to March 2000 (%) - White
Year householder moved into unit - Moved in 1999 to March 2000 (%) - Black or African American
Year householder moved into unit - Moved in 1999 to March 2000 (%) - Asian
Year householder moved into unit - Moved in 1999 to March 2000 (%) - Hispanic or Latino
Year householder moved into unit - Moved in 1999 to March 2000 (%) - American Indian and Alaska Native
Year householder moved into unit - Moved in 1999 to March 2000 (%) - Multirace
Year householder moved into unit - Moved in 1999 to March 2000 (%) - Other Race
Year householder moved into unit - Moved in 1995 to 1998 (%)
Year householder moved into unit - Moved in 1995 to 1998 (%) - White
Year householder moved into unit - Moved in 1995 to 1998 (%) - Black or African American
Year householder moved into unit - Moved in 1995 to 1998 (%) - Asian
Year householder moved into unit - Moved in 1995 to 1998 (%) - Hispanic or Latino
Year householder moved into unit - Moved in 1995 to 1998 (%) - American Indian and Alaska Native
Year householder moved into unit - Moved in 1995 to 1998 (%) - Multirace
Year householder moved into unit - Moved in 1995 to 1998 (%) - Other Race
Year householder moved into unit - Moved in 1990 to 1994 (%)
Year householder moved into unit - Moved in 1990 to 1994 (%) - White
Year householder moved into unit - Moved in 1990 to 1994 (%) - Black or African American
Year householder moved into unit - Moved in 1990 to 1994 (%) - Asian
Year householder moved into unit - Moved in 1990 to 1994 (%) - Hispanic or Latino
Year householder moved into unit - Moved in 1990 to 1994 (%) - American Indian and Alaska Native
Year householder moved into unit - Moved in 1990 to 1994 (%) - Multirace
Year householder moved into unit - Moved in 1990 to 1994 (%) - Other Race
Year householder moved into unit - Moved in 1980 to 1989 (%)
Year householder moved into unit - Moved in 1980 to 1989 (%) - White
Year householder moved into unit - Moved in 1980 to 1989 (%) - Black or African American
Year householder moved into unit - Moved in 1980 to 1989 (%) - Asian
Year householder moved into unit - Moved in 1980 to 1989 (%) - Hispanic or Latino
Year householder moved into unit - Moved in 1980 to 1989 (%) - American Indian and Alaska Native
Year householder moved into unit - Moved in 1980 to 1989 (%) - Multirace
Year householder moved into unit - Moved in 1980 to 1989 (%) - Other Race
Year householder moved into unit - Moved in 1970 to 1979 (%)
Year householder moved into unit - Moved in 1970 to 1979 (%) - White
Year householder moved into unit - Moved in 1970 to 1979 (%) - Black or African American
Year householder moved into unit - Moved in 1970 to 1979 (%) - Asian
Year householder moved into unit - Moved in 1970 to 1979 (%) - Hispanic or Latino
Year householder moved into unit - Moved in 1970 to 1979 (%) - American Indian and Alaska Native
Year householder moved into unit - Moved in 1970 to 1979 (%) - Multirace
Year householder moved into unit - Moved in 1970 to 1979 (%) - Other Race
Year householder moved into unit - Moved in 1969 or earlier (%)
Year householder moved into unit - Moved in 1969 or earlier (%) - White
Year householder moved into unit - Moved in 1969 or earlier (%) - Black or African American
Year householder moved into unit - Moved in 1969 or earlier (%) - Asian
Year householder moved into unit - Moved in 1969 or earlier (%) - Hispanic or Latino
Year householder moved into unit - Moved in 1969 or earlier (%) - American Indian and Alaska Native
Year householder moved into unit - Moved in 1969 or earlier (%) - Multirace
Year householder moved into unit - Moved in 1969 or earlier (%) - Other Race
Housing units lacking complete plumbing facilities (%)
Housing units lacking complete kitchen facilities (%)
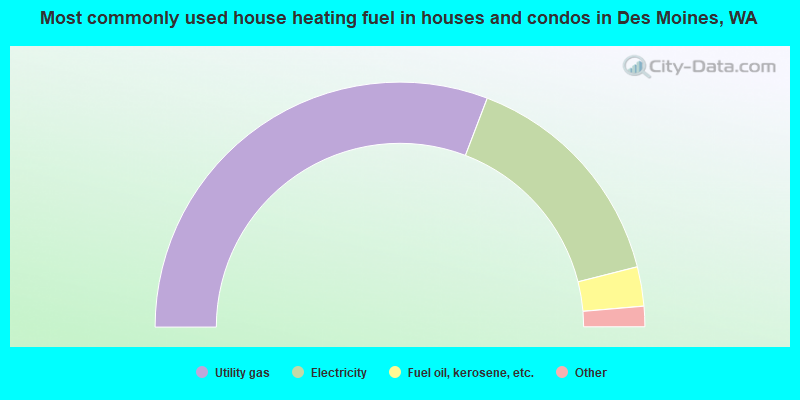
House heating fuel used in houses and condos - Utility gas (%)
House heating fuel used in houses and condos - Bottled, tank, or LP gas (%)
House heating fuel used in houses and condos - Electricity (%)
House heating fuel used in houses and condos - Fuel oil, kerosene, etc. (%)
House heating fuel used in houses and condos - Coal or coke (%)
House heating fuel used in houses and condos - Wood (%)
House heating fuel used in houses and condos - Solar energy (%)
House heating fuel used in houses and condos - Other fuel (%)
House heating fuel used in houses and condos - No fuel used (%)
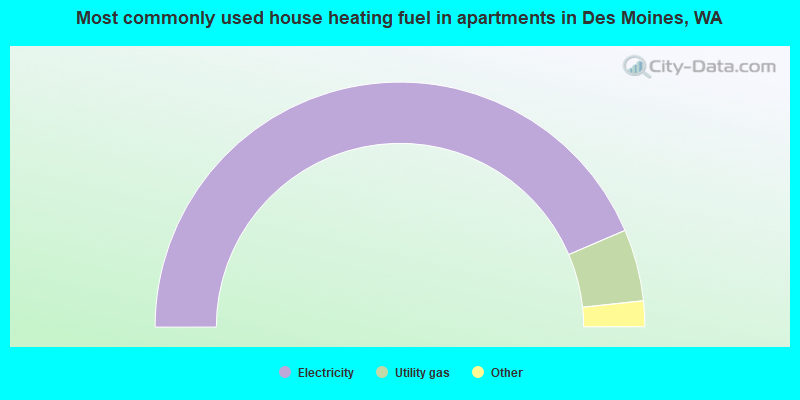
House heating fuel used in apartments - Utility gas (%)
House heating fuel used in apartments - Bottled, tank, or LP gas (%)
House heating fuel used in apartments - Electricity (%)
House heating fuel used in apartments - Fuel oil, kerosene, etc. (%)
House heating fuel used in apartments - Coal or coke (%)
House heating fuel used in apartments - Wood (%)
House heating fuel used in apartments - Solar energy (%)
House heating fuel used in apartments - Other fuel (%)
House heating fuel used in apartments - No fuel used (%)
Median year house/condo built: 1969Median year apartment built: 1979Household type by relationship:
Households: 32,846
Male householders: 6,315 (1,684 living alone ), Female householders: 6,121 (1,890 living alone )5,168 spouses (5,034 opposite-sex spouses ), 1,289 unmarried partners , (1,206 opposite-sex unmarried partners ), 8,884 children (8,405 natural , 108 adopted , 371 stepchildren ), 529 grandchildren , 530 brothers or sisters , 622 parents , 3 foster children , 780 other relatives , 1,734 non-relatives In group quarters: 866
Size of family households: 3,092 2-persons , 1,903 3-persons , 1,530 4-persons , 628 5-persons , 186 6-persons , 233 7-or-more-persons .
Size of nonfamily households: 3,843 1-person , 886 2-persons , 302 3-persons , 63 4-persons , 23 6-persons .
3,891 married couples with children. single-parent households (534 men , 2,142 women ).
63.7% of residents of Des Moines speak English at home. of residents speak Spanish at home (53% speak English very well , 21% speak English well , 22% speak English not well , 3% don't speak English at all ).of residents speak other Indo-European language at home (45% speak English very well , 40% speak English well , 10% speak English not well , 5% don't speak English at all ).of residents speak Asian or Pacific Island language at home (62% speak English very well , 21% speak English well , 9% speak English not well , 7% don't speak English at all ).of residents speak other language at home (69% speak English very well , 24% speak English well , 7% speak English not well ).
Foreign born population: 8,851 (26.9%)of them are naturalized citizens )
Median number of rooms in houses and condos:
Median number of rooms in apartments
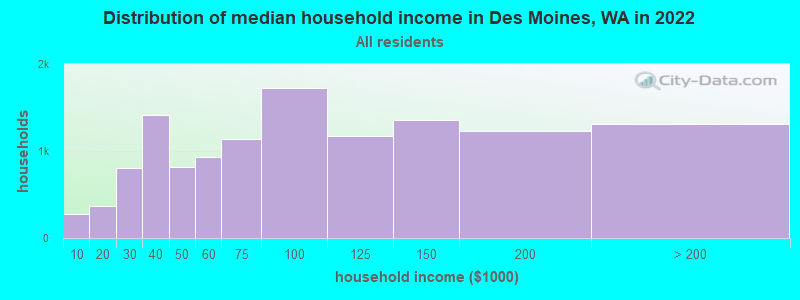
Des Moines, WA household income distribution 277 Less than $10,000372 $10,000 to $19,999804 $20,000 to $29,9991,410 $30,000 to $39,999817 $40,000 to $49,999926 $50,000 to $59,9991,141 $60,000 to $74,9991,729 $75,000 to $99,9991,173 $100,000 to $124,9991,351 $125,000 to $149,9991,229 $150,000 to $199,9991,305 $200,000 or more
Home value of owner - occupied houses in 2022 in Des Moines, WA 73 Less than $10,0008 $15,000 to $19,9995 $35,000 to $39,99926 $50,000 to $59,9996 $60,000 to $69,99922 $100,000 to $124,99933 $125,000 to $149,99913 $150,000 to $174,999270 $200,000 to $249,99995 $250,000 to $299,999581 $300,000 to $399,9991,598 $400,000 to $499,9992,306 $500,000 to $749,999661 $750,000 to $999,999194 $1,000,000 to $1,499,99998 $1,500,000 to $1,999,9995 $2,000,000 or moreRent paid by renters in 2022 in Des Moines, WA 33 $250 to $2996 $400 to $44931 $650 to $69942 $800 to $899168 $900 to $999807 $1,000 to $1,2491,503 $1,250 to $1,4992,002 $1,500 to $1,999227 $2,000 to $2,499131 $2,500 to $2,99969 $3,000 to $3,499226 $3,500 or more115 No cash rent
Percentage of workers working in this county: 94.7%Number of people working at home: 2,317 (15.2% of all workers )
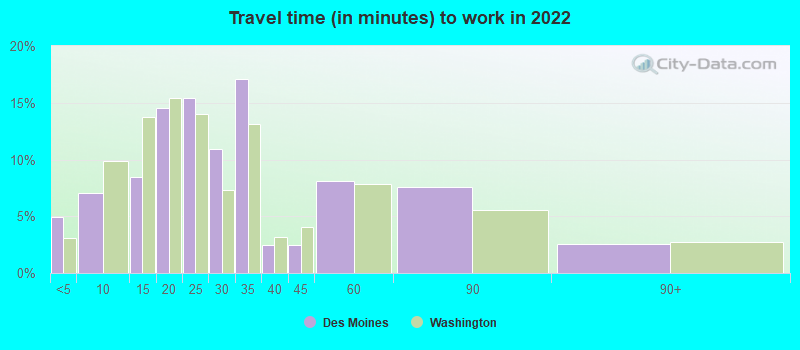
Travel time to work (commute)
Less than 5 minutes: 2285 to 9 minutes: 51910 to 14 minutes: 74615 to 19 minutes: 1,73520 to 24 minutes: 2,24325 to 29 minutes: 1,16130 to 34 minutes: 2,11135 to 39 minutes: 31240 to 44 minutes: 70245 to 59 minutes: 1,40760 to 89 minutes: 74390 or more minutes: 137
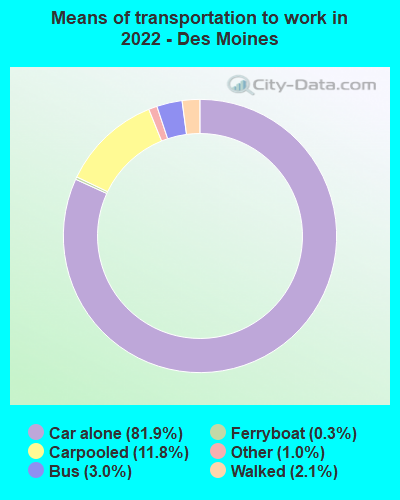
Means of transportation to work:
Drove a car alone: 5,326 (62.9%)Carpooled: 735 (8.7%)Bus : 119 (1.4%)Ferryboat: 16 (0.2%)Taxi: 60 (0.7%)Walked: 119 (1.4%)Worked at home: 2,317 (27.3%)
Unemployment by race in 2022
Unemployment rate for White non-Hispanic residents 5.3% Males6.3% FemalesUnemployment rate for Black residents 4.2% MalesUnemployment rate for Asian residents 5.1% Males5.1% FemalesUnemployment rate for other race residents 10.4% Males6.0% FemalesUnemployment rate for two or more race residents 8.2% Males4.4% FemalesUnemployment rate for Hispanic or Latino residents 12.4% Males4.7% Females
Year of entry for the foreign-born population in Des Moines, Washington
3,488 2010 or later 2,386 2000 to 2009 1,648 1990 to 1999 961 1980 to 1989 486 1970 to 1979 445 Before 1970
First ancestries reported:
German: 1,167 (7.1%)
European: 861 (5.3%)
Iraqi: 757 (4.6%)
Ukrainian: 702 (4.3%)
English: 587 (3.6%)
American: 575 (3.5%)
Norwegian: 463 (2.8%)
Ethiopian: 404 (2.5%)
Italian: 388 (2.4%)
Irish: 312 (1.9%)
Polish: 236 (1.4%)
African: 201 (1.2%)
Somali: 164 (1.0%)
Afghan: 103 (0.6%)
Swedish: 102 (0.6%)
Kenyan: 92 (0.6%)
Scotch-Irish: 85 (0.5%)
Scottish: 81 (0.5%)
Scandinavian: 59 (0.4%)
Danish: 54 (0.3%)
French: 53 (0.3%)
Swiss: 51 (0.3%)
Northern European: 49 (0.3%)
British: 45 (0.3%)
Brazilian: 43 (0.3%)
Dutch: 37 (0.2%)
Greek: 29 (0.2%)
French Canadian: 29 (0.2%)
Romanian: 28 (0.2%)
Yugoslavian: 28 (0.2%)
Finnish: 24 (0.1%)
Bulgarian: 22 (0.1%)
Welsh: 21 (0.1%)
Latvian: 20 (0.1%)
Portuguese: 20 (0.1%)
Iranian: 15 (0.09%)
Eastern European: 14 (0.09%)
Czech: 13 (0.08%)
Croatian: 11 (0.07%)
Canadian: 8 (0.05%)
Lithuanian: 6 (0.04%) Most common places of birth for foreign-born residents (%): Mexico Des Moines:
19.2% (1,703)Washington:
21.1% (241,655)
Vietnam Des Moines:
7.3% (650)Washington:
5.4% (62,003)
Ukraine Des Moines:
7.2% (633)Washington:
3.1% (35,872)
Iraq Des Moines:
5.6% (492)Washington:
0.5% (6,259)
Honduras Des Moines:
4.8% (423)Washington:
0.6% (6,500)
Ethiopia Des Moines:
3.8% (338)Washington:
1.6% (17,938)
Guatemala Des Moines:
3.7% (330)Washington:
1.2% (13,855)
Philippines Des Moines:
3.6% (316)Washington:
6.3% (71,661)
India Des Moines:
2.8% (250)Washington:
8.9% (101,353)
El Salvador Des Moines:
2.7% (239)Washington:
1.2% (13,745)
Kenya Des Moines:
2.3% (202)Washington:
1.1% (12,735)
Somalia Des Moines:
2.2% (199)Washington:
0.7% (8,540)
Pakistan Des Moines:
2.1% (188)Washington:
0.6% (6,294)
Taiwan Des Moines:
2.0% (179)Washington:
1.5% (16,607)
China, excluding Hong Kong and Taiwan Des Moines:
1.8% (158)Washington:
7.4% (84,470)
Afghanistan Des Moines:
1.7% (153)Washington:
0.5% (5,851)
Korea Des Moines:
1.7% (152)Washington:
4.3% (48,886)
Thailand Des Moines:
1.7% (150)Washington:
0.9% (9,937)
Uganda Des Moines:
1.7% (150)Washington:
0.2% (1,754)
Poland Des Moines:
1.5% (136)Washington:
0.4% (4,963)
Place of birth for U.S.-born residents:
This state: 14,719Other state: 8,165Northeast: 849Midwest: 2,186South: 1,116West: 4,030 85.8% of Des Moines residents lived in the same house 1 years ago.
Out of people who lived in different houses, 43.3% lived in this county.
Out of people who lived in different counties, 61.1% lived in Washington.
Des Moines:
85.8%State average:
85.2%
Education attainment for males 25 years and older:
No schooling: 405Nursery to 4th grade: 725th and 6th grade: 1757th and 8th grade: 1199th grade: 8610th grade: 11011th grade: 11512th grade, no diploma: 260High school graduate (or equivalency): 2,996Less than 1 year of college: 694Some college more than 1 year, no degree: 1,715Associate degree: 1,092Bachelor's degree: 2,378Master's degree: 516Professional school degree: 224Doctorate degree: 304
Education attainment for females 25 years and older:
No schooling: 282Nursery to 4th grade: 2215th and 6th grade: 2707th and 8th grade: 519th grade: 19610th grade: 4311th grade: 9312th grade, no diploma: 282High school graduate (or equivalency): 2,885Less than 1 year of college: 858Some college more than 1 year, no degree: 1,633Associate degree: 1,221Bachelor's degree: 2,356Master's degree: 1,331Professional school degree: 126Doctorate degree: 94
Housing units in structures:
One, detached: 7,566One, attached: 322Two: 2443 or 4: 9045 to 9: 1,08110 to 19: 1,03020 to 49: 95950 or more: 1,223Mobile homes: 104Housing units lacking complete plumbing facilities in 2022: 0.9%Housing units lacking complete kitchen facilities in 2022: 2.3%House/condo owner moved in on average 12 years ago
Renter moved in on average 4 years ago
Private vs. public school enrollment:
Students in private schools in grades 1 to 8 (elementary and middle school): 236 Here:
8.8%Washington:
12.4%
Students in private schools in grades 9 to 12 (high school): 157 Here:
10.4%Washington:
9.2%
Students in private undergraduate colleges: 108 Here:
11.0%Washington:
16.5%