Races in Des Moines, Washington (WA) Detailed Stats
Data:
Races - White alone (%)
Races - White alone (% change since 2000)
Races - Black alone (%)
Races - Black alone (% change since 2000)
Races - American Indian alone (%)
Races - American Indian alone (% change since 2000)
Races - Asian alone (%)
Races - Asian alone (% change since 2000)
Races - Hispanic (%)
Races - Hispanic (% change since 2000)
Races - Native Hawaiian and Other Pacific Islander alone (%)
Races - Native Hawaiian and Other Pacific Islander alone (% change since 2000)
Races - Two or more races(%)
Races - Two or more races(% change since 2000)
Races - Other race alone (%)
Races - Other race alone (% change since 2000)
Racial diversity
Place of birth - Born in state of residence (%)
Place of birth - Born in state of residence (%) - White
Place of birth - Born in state of residence (%) - Black or African American
Place of birth - Born in state of residence (%) - Asian
Place of birth - Born in state of residence (%) - Hispanic or Latino
Place of birth - Born in state of residence (%) - American Indian and Alaska Native
Place of birth - Born in state of residence (%) - Multirace
Place of birth - Born in state of residence (%) - Other Race
Place of birth - Born in other state (%)
Place of birth - Born in other state (%) - White
Place of birth - Born in other state (%) - Black or African American
Place of birth - Born in other state (%) - Asian
Place of birth - Born in other state (%) - Hispanic or Latino
Place of birth - Born in other state (%) - American Indian and Alaska Native
Place of birth - Born in other state (%) - Multirace
Place of birth - Born in other state (%) - Other Race
Place of birth - Native, outside of US (%)
Place of birth - Native, outside of US (%) - White
Place of birth - Native, outside of US (%) - Black or African American
Place of birth - Native, outside of US (%) - Asian
Place of birth - Native, outside of US (%) - Hispanic or Latino
Place of birth - Native, outside of US (%) - American Indian and Alaska Native
Place of birth - Native, outside of US (%) - Multirace
Place of birth - Native, outside of US (%) - Other Race
Place of birth - Foreign born (%)
Place of birth - Foreign born (%) - White
Place of birth - Foreign born (%) - Black or African American
Place of birth - Foreign born (%) - Asian
Place of birth - Foreign born (%) - Hispanic or Latino
Place of birth - Foreign born (%) - American Indian and Alaska Native
Place of birth - Foreign born (%) - Multirace
Place of birth - Foreign born (%) - Other Race
Residents speaking English at home (%)
Residents speaking English at home - Born in the United States (%)
Residents speaking English at home - Native, born elsewhere (%)
Residents speaking English at home - Foreign born (%)
Residents speaking Spanish at home (%)
Residents speaking Spanish at home - Born in the United States (%)
Residents speaking Spanish at home - Native, born elsewhere (%)
Residents speaking Spanish at home - Foreign born (%)
Residents speaking other language at home (%)
Residents speaking other language at home - Born in the United States (%)
Residents speaking other language at home - Native, born elsewhere (%)
Residents speaking other language at home - Foreign born (%)
Marital status - Never married (%)
Marital status - Now married (%)
Marital status - Separated (%)
Marital status - Widowed (%)
Marital status - Divorced (%)
Ancestries Reported - Arab (%)
Ancestries Reported - Czech (%)
Ancestries Reported - Danish (%)
Ancestries Reported - Dutch (%)
Ancestries Reported - English (%)
Ancestries Reported - French (%)
Ancestries Reported - French Canadian (%)
Ancestries Reported - German (%)
Ancestries Reported - Greek (%)
Ancestries Reported - Hungarian (%)
Ancestries Reported - Irish (%)
Ancestries Reported - Italian (%)
Ancestries Reported - Lithuanian (%)
Ancestries Reported - Norwegian (%)
Ancestries Reported - Polish (%)
Ancestries Reported - Portuguese (%)
Ancestries Reported - Russian (%)
Ancestries Reported - Scotch-Irish (%)
Ancestries Reported - Scottish (%)
Ancestries Reported - Slovak (%)
Ancestries Reported - Subsaharan African (%)
Ancestries Reported - Swedish (%)
Ancestries Reported - Swiss (%)
Ancestries Reported - Ukrainian (%)
Ancestries Reported - United States (%)
Ancestries Reported - Welsh (%)
Ancestries Reported - West Indian (%)
Ancestries Reported - Other (%)
Geographical mobility - Same house 1 year ago (%)
Geographical mobility - Same house 1 year ago (%) - White
Geographical mobility - Same house 1 year ago (%) - Black or African American
Geographical mobility - Same house 1 year ago (%) - Asian
Geographical mobility - Same house 1 year ago (%) - Hispanic or Latino
Geographical mobility - Same house 1 year ago (%) - American Indian and Alaska Native
Geographical mobility - Same house 1 year ago (%) - Multirace
Geographical mobility - Same house 1 year ago (%) - Other Race
Geographical mobility - Moved within same county (%)
Geographical mobility - Moved within same county (%) - White
Geographical mobility - Moved within same county (%) - Black or African American
Geographical mobility - Moved within same county (%) - Asian
Geographical mobility - Moved within same county (%) - Hispanic or Latino
Geographical mobility - Moved within same county (%) - American Indian and Alaska Native
Geographical mobility - Moved within same county (%) - Multirace
Geographical mobility - Moved within same county (%) - Other Race
Geographical mobility - Moved from different county within same state (%)
Geographical mobility - Moved from different county within same state (%) - White
Geographical mobility - Moved from different county within same state (%) - Black or African American
Geographical mobility - Moved from different county within same state (%) - Asian
Geographical mobility - Moved from different county within same state (%) - Hispanic or Latino
Geographical mobility - Moved from different county within same state (%) - American Indian and Alaska Native
Geographical mobility - Moved from different county within same state (%) - Multirace
Geographical mobility - Moved from different county within same state (%) - Other Race
Geographical mobility - Moved from different state (%)
Geographical mobility - Moved from different state (%) - White
Geographical mobility - Moved from different state (%) - Black or African American
Geographical mobility - Moved from different state (%) - Asian
Geographical mobility - Moved from different state (%) - Hispanic or Latino
Geographical mobility - Moved from different state (%) - American Indian and Alaska Native
Geographical mobility - Moved from different state (%) - Multirace
Geographical mobility - Moved from different state (%) - Other Race
Geographical mobility - Moved from abroad (%)
Geographical mobility - Moved from abroad (%) - White
Geographical mobility - Moved from abroad (%) - Black or African American
Geographical mobility - Moved from abroad (%) - Asian
Geographical mobility - Moved from abroad (%) - Hispanic or Latino
Geographical mobility - Moved from abroad (%) - American Indian and Alaska Native
Geographical mobility - Moved from abroad (%) - Multirace
Geographical mobility - Moved from abroad (%) - Other Race
Place of birth for the foreign-born population - Ireland (%)
Place of birth for the foreign-born population - Denmark (%)
Place of birth for the foreign-born population - Norway (%)
Place of birth for the foreign-born population - Sweden (%)
Place of birth for the foreign-born population - United Kingdom (%)
Place of birth for the foreign-born population - England (%)
Place of birth for the foreign-born population - Scotland (%)
Place of birth for the foreign-born population - Other Northern Europe (%)
Place of birth for the foreign-born population - Austria (%)
Place of birth for the foreign-born population - Belgium (%)
Place of birth for the foreign-born population - France (%)
Place of birth for the foreign-born population - Germany (%)
Place of birth for the foreign-born population - Netherlands (%)
Place of birth for the foreign-born population - Switzerland (%)
Place of birth for the foreign-born population - Other Western Europe (%)
Place of birth for the foreign-born population - Greece (%)
Place of birth for the foreign-born population - Italy (%)
Place of birth for the foreign-born population - Portugal (%)
Place of birth for the foreign-born population - Spain (%)
Place of birth for the foreign-born population - Other Southern Europe (%)
Place of birth for the foreign-born population - Albania (%)
Place of birth for the foreign-born population - Belarus (%)
Place of birth for the foreign-born population - Bosnia and Herzegovina (%)
Place of birth for the foreign-born population - Bulgaria (%)
Place of birth for the foreign-born population - Croatia (%)
Place of birth for the foreign-born population - Czechoslovakia (%)
Place of birth for the foreign-born population - Hungary (%)
Place of birth for the foreign-born population - Latvia (%)
Place of birth for the foreign-born population - Lithuania (%)
Place of birth for the foreign-born population - North Macedonia (Macedonia) (%)
Place of birth for the foreign-born population - Moldova (%)
Place of birth for the foreign-born population - Poland (%)
Place of birth for the foreign-born population - Romania (%)
Place of birth for the foreign-born population - Russia (%)
Place of birth for the foreign-born population - Serbia (%)
Place of birth for the foreign-born population - Ukraine (%)
Place of birth for the foreign-born population - Other Eastern Europe (%)
Place of birth for the foreign-born population - China (%)
Place of birth for the foreign-born population - Hong Kong (%)
Place of birth for the foreign-born population - Taiwan (%)
Place of birth for the foreign-born population - Japan (%)
Place of birth for the foreign-born population - Korea (%)
Place of birth for the foreign-born population - Other Eastern Asia (%)
Place of birth for the foreign-born population - Afghanistan (%)
Place of birth for the foreign-born population - Bangladesh (%)
Place of birth for the foreign-born population - India (%)
Place of birth for the foreign-born population - Iran (%)
Place of birth for the foreign-born population - Kazakhstan (%)
Place of birth for the foreign-born population - Nepal (%)
Place of birth for the foreign-born population - Pakistan (%)
Place of birth for the foreign-born population - Sri Lanka (%)
Place of birth for the foreign-born population - Uzbekistan (%)
Place of birth for the foreign-born population - Other South Central Asia (%)
Place of birth for the foreign-born population - Burma (%)
Place of birth for the foreign-born population - Cambodia (%)
Place of birth for the foreign-born population - Indonesia (%)
Place of birth for the foreign-born population - Laos (%)
Place of birth for the foreign-born population - Malaysia (%)
Place of birth for the foreign-born population - Philippines (%)
Place of birth for the foreign-born population - Singapore (%)
Place of birth for the foreign-born population - Thailand (%)
Place of birth for the foreign-born population - Vietnam (%)
Place of birth for the foreign-born population - Other South Eastern Asia (%)
Place of birth for the foreign-born population - Armenia (%)
Place of birth for the foreign-born population - Iraq (%)
Place of birth for the foreign-born population - Israel (%)
Place of birth for the foreign-born population - Jordan (%)
Place of birth for the foreign-born population - Kuwait (%)
Place of birth for the foreign-born population - Lebanon (%)
Place of birth for the foreign-born population - Saudi Arabia (%)
Place of birth for the foreign-born population - Syria (%)
Place of birth for the foreign-born population - Turkey (%)
Place of birth for the foreign-born population - Yemen (%)
Place of birth for the foreign-born population - Other Western Asia (%)
Place of birth for the foreign-born population - Eritrea (%)
Place of birth for the foreign-born population - Ethiopia (%)
Place of birth for the foreign-born population - Kenya (%)
Place of birth for the foreign-born population - Somalia (%)
Place of birth for the foreign-born population - Uganda (%)
Place of birth for the foreign-born population - Zimbabwe (%)
Place of birth for the foreign-born population - Other Eastern Africa (%)
Place of birth for the foreign-born population - Cameroon (%)
Place of birth for the foreign-born population - Congo (%)
Place of birth for the foreign-born population - Democratic Republic of Congo (Zaire) (%)
Place of birth for the foreign-born population - Other Middle Africa (%)
Place of birth for the foreign-born population - Egypt (%)
Place of birth for the foreign-born population - Morocco (%)
Place of birth for the foreign-born population - Sudan (%)
Place of birth for the foreign-born population - Other Northern Africa (%)
Place of birth for the foreign-born population - South Africa (%)
Place of birth for the foreign-born population - Other Southern Africa (%)
Place of birth for the foreign-born population - Cabo Verde (%)
Place of birth for the foreign-born population - Ghana (%)
Place of birth for the foreign-born population - Liberia (%)
Place of birth for the foreign-born population - Nigeria (%)
Place of birth for the foreign-born population - Senegal (%)
Place of birth for the foreign-born population - Sierra Leone (%)
Place of birth for the foreign-born population - Other Western Africa (%)
Place of birth for the foreign-born population - Australia (%)
Place of birth for the foreign-born population - New Zealand (%)
Place of birth for the foreign-born population - Fiji (%)
Place of birth for the foreign-born population - Micronesia (%)
Place of birth for the foreign-born population - Bahamas (%)
Place of birth for the foreign-born population - Barbados (%)
Place of birth for the foreign-born population - Cuba (%)
Place of birth for the foreign-born population - Dominica (%)
Place of birth for the foreign-born population - Dominican Republic (%)
Place of birth for the foreign-born population - Grenada (%)
Place of birth for the foreign-born population - Haiti (%)
Place of birth for the foreign-born population - Jamaica (%)
Place of birth for the foreign-born population - St. Vincent and the Grenadines (%)
Place of birth for the foreign-born population - Trinidad and Tobago (%)
Place of birth for the foreign-born population - West Indies (%)
Place of birth for the foreign-born population - Other Caribbean (%)
Place of birth for the foreign-born population - Belize (%)
Place of birth for the foreign-born population - Costa Rica (%)
Place of birth for the foreign-born population - El Salvador (%)
Place of birth for the foreign-born population - Guatemala (%)
Place of birth for the foreign-born population - Honduras (%)
Place of birth for the foreign-born population - Mexico (%)
Place of birth for the foreign-born population - Nicaragua (%)
Place of birth for the foreign-born population - Panama (%)
Place of birth for the foreign-born population - Other Central America (%)
Place of birth for the foreign-born population - Argentina (%)
Place of birth for the foreign-born population - Bolivia (%)
Place of birth for the foreign-born population - Brazil (%)
Place of birth for the foreign-born population - Chile (%)
Place of birth for the foreign-born population - Colombia (%)
Place of birth for the foreign-born population - Ecuador (%)
Place of birth for the foreign-born population - Guyana (%)
Place of birth for the foreign-born population - Peru (%)
Place of birth for the foreign-born population - Uruguay (%)
Place of birth for the foreign-born population - Venezuela (%)
Place of birth for the foreign-born population - Other South America (%)
Place of birth for the foreign-born population - Canada (%)
Place of birth for the foreign-born population - Other Northern America (%)
Place of birth for the foreign-born population - Other (%)
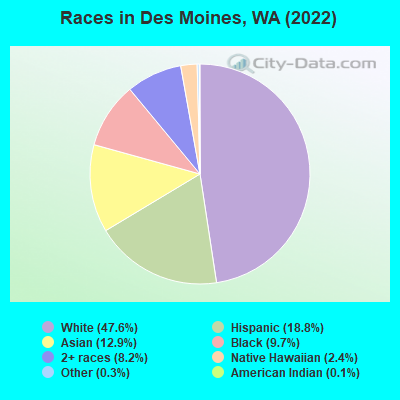
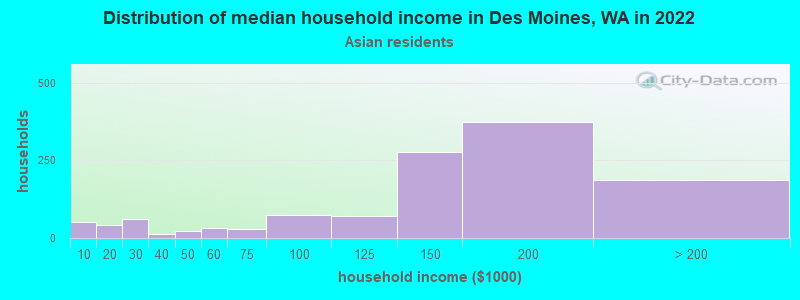
According to 2022 data, the most numerous races in Des Moines, WA are White alone (15,646 residents), Hispanic (6,178 residents), and Asian alone (4,253 residents). 63.3% of Des Moines residents speak English at home. 26.9% of Des Moines, WA residents are foreign-born (9.1% born in Asia, 8.8% born in Latin America, 3.9% born in Europe, 2.7% born in Africa), which is 44.3% greater than the foreign-born rate of 15.0% across the entire state of Washington.
Race distribution in Des Moines
2000 2022
20,986 71.7% White alone 2,399 8.2% Asian alone 2,069 7.1% Black alone 1,936 6.6% Hispanic 1,200 4.1% Two or more races 380 1.3% Native Hawaiian and Other 254 0.9% American Indian alone 43 0.1% Other race alone
15,646 47.6% White alone 6,178 18.8% Hispanic 4,253 12.9% Asian alone 3,202 9.7% Black alone 2,677 8.2% Two or more races 777 2.4% Native Hawaiian and Other 111 0.3% Other race alone 46 0.1% American Indian alone
2000 2022
4,652,490 78.9% White alone 441,509 7.5% Hispanic 319,401 5.4% Asian alone 184,631 3.1% Black alone 175,926 3.0% Two or more races 85,396 1.4% American Indian alone 22,779 0.4% Native Hawaiian and Other 11,989 0.2% Other race alone
4,941,456 63.5% White alone 1,093,313 14.0% Hispanic 755,832 9.7% Asian alone 523,448 6.7% Two or more races 299,537 3.8% Black alone 69,024 0.9% American Indian alone 52,231 0.7% Native Hawaiian and Other 50,945 0.7% Other race alone
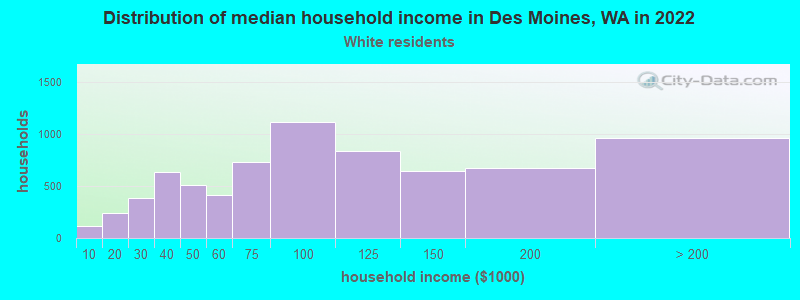
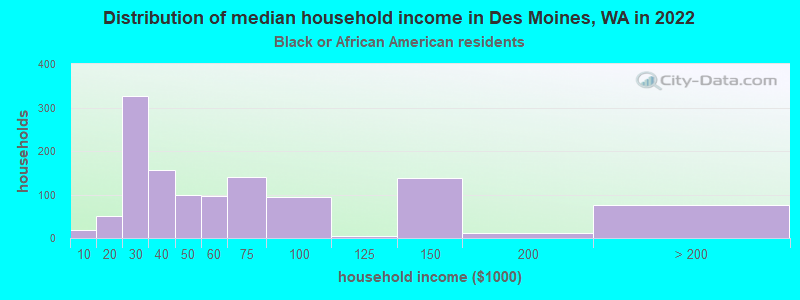
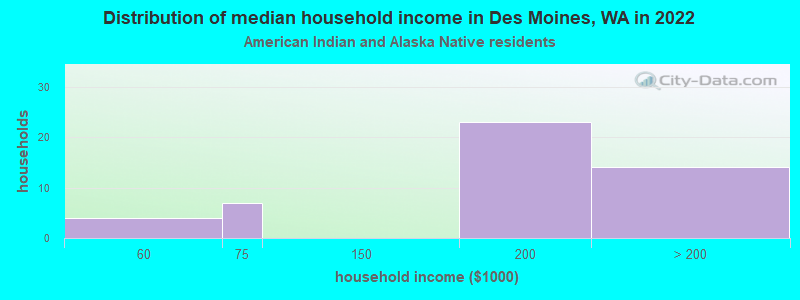
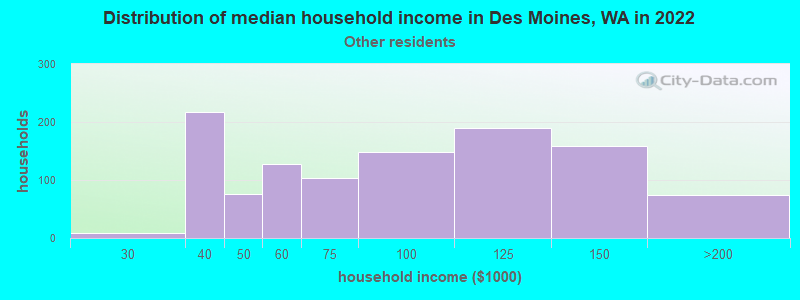
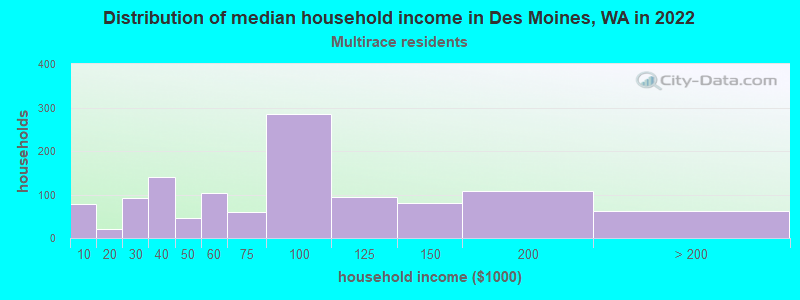
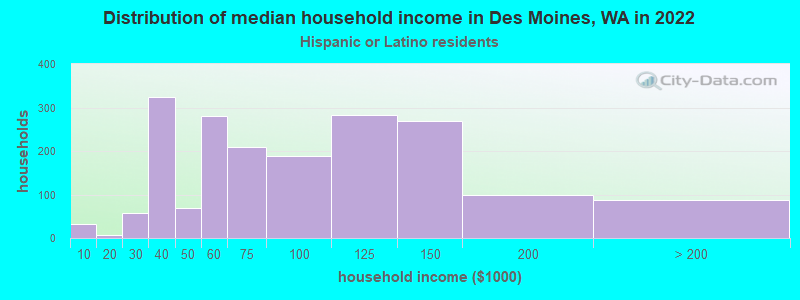
Income and house value in Des Moines Median household income in 2022 $84,755 White non-Hispanic householders$51,040 Black householdersover $200,000 American Indian and Alaska Native householders$139,751 Asian householders$42,224 Native Hawaiian and other Pacific Islander householders$72,055 Some other race householders$80,690 Two or more races householders$72,478 Hispanic or Latino race householdersMedian 2022 house value $561,901 White Non-Hispanic householders$597,945 Black or African American householders$459,884 American Indian or Alaska Native householders $562,545 Asian householders$777,844 Native Hawaiian and other Pacific Islander householders$598,911 Some other race householders$518,133 Two or more races householders$589,256 Hispanic or Latino householders
Median age by race in Des Moines
48.2 Median age for White residents47.8 48.5 34.5 Median age for Black or African American residents34.0 32.9 29.2 Median age for American Indian / Alaska Native residents29.9 28.9 38.8 Median age for Asian residents40.9 36.7 38.0 Median age for Native Hawaiian / Pacific Islander residents12.0 45.9 28.3 Median age for Other race residents29.6 26.3 33.2 Median age for Two or more races residents35.3 29.5 49.3 Median age for White alone residents48.8 50.1 30.2 Median age for Hispanic or Latino residents31.7 27.1
Owner/renter occupied households by race in Des Moines
House owners and renters - White residents 5,131 69.9% Owner occupied2,212 30.1% Renter occupiedHouse owners and renters - Black or African American residents 291 24.2% Owner occupied911 75.8% Renter occupiedHouse owners and renters - American Indian / Alaska Native residents 26 64.3% Owner occupied15 35.7% Renter occupiedHouse owners and renters - Asian residents 1,175 93.1% Owner occupied86 6.9% Renter occupiedHouse owners and renters - Native Hawaiian / Pacific Islander residents 47 11.6% Owner occupied360 88.4% Renter occupiedHouse owners and renters - Other race residents 363 28.0% Owner occupied935 72.0% Renter occupiedHouse owners and renters - Two or more races residents 427 35.0% Owner occupied792 65.0% Renter occupiedHouse owners and renters - White alone residents 5,006 70.7% Owner occupied2,078 29.3% Renter occupiedHouse owners and renters - Hispanic or Latino residents 611 31.4% Owner occupied1,336 68.6% Renter occupied
Language usage in Des Moines
English speakers - Total 63.3% of residents of Des Moines speak English at home.
15.1% of residents speak Spanish at home 2,454 53.1% Speak English very well2,167 46.9% Speak English less than very well22.0% of residents speak other language at home 3,867 57.4% Speak English very well2,866 42.6% Speak English less than very well
English speakers - Born in the United States 90.5% of residents of Des Moines speak English at home.
6.7% of residents speak Spanish at home 483 89.8% Speak English very well55 10.2% Speak English less than very well2.9% of residents speak other language at home 224 94.1% Speak English very well14 5.9% Speak English less than very well
English speakers - Native, born elsewhere 32.5% of residents of Des Moines speak English at home.
74.2% of residents speak other language at home 634 83.6% Speak English very well124 16.4% Speak English less than very well
English speakers - Foreign-born 11.8% of residents of Des Moines speak English at home.
31.2% of residents speak Spanish at home 835 30.5% Speak English very well1,900 69.5% Speak English less than very well56.1% of residents speak other language at home 2,308 46.9% Speak English very well2,612 53.1% Speak English less than very well
White (Caucasian) - Speak only English Native:
96.1% (13,285)Foreign-born:
19.5% (347)
White (Caucasian) - Speak another language Native:
4.0% (547)Foreign-born:
80.9% (1,437)
Black or African American - Speak only English Native:
84.6% (1,670)Foreign-born:
11.7% (105)
Black or African American - Speak another language Native:
15.3% (303)Foreign-born:
87.6% (790)
American Indian / Alaska Native - Speak another language Native:
54.2% (59)Foreign-born:
100.0% (11)
Asian - Speak only English Native:
52.5% (941)Foreign-born:
12.8% (301)
Asian - Speak another language Native:
48.0% (859)Foreign-born:
87.2% (2,053)
Native Hawaiian / Pacific Islander - Speak only English Native:
18.7% (76)Foreign-born:
1.1% (4)
Native Hawaiian / Pacific Islander - Speak another language Native:
100.0% (404)Foreign-born:
94.7% (352)
Other race - Speak only English Native:
14.1% (211)Foreign-born:
3.9% (96)
Other race - Speak another language Native:
84.5% (1,270)Foreign-born:
96.6% (2,402)
Two or more races - Speak only English Native:
87.1% (2,143)Foreign-born:
18.1% (209)
Two or more races - Speak another language Native:
12.2% (301)Foreign-born:
81.8% (945)
White alone - Speak only English Native:
97.2% (13,023)Foreign-born:
21.3% (353)
White alone - Speak another language Native:
2.7% (356)Foreign-born:
80.6% (1,339)
Hispanic or Latino - Speak only English Native:
32.0% (787)Foreign-born:
4.8% (137)
Hispanic or Latino - Speak another language Native:
69.5% (1,710)Foreign-born:
95.4% (2,731)
Foreign-born residents in Des Moines 8,851 residents are foreign born (9.1% Asia , 8.8% Latin America , 3.9% Europe , 2.7% Africa ).
This city:
26.9%Washington:
14.9%
Marital status for residents in Des Moines Marital status - White (Caucasian) population 15 years and over
Males 35.1% Never married47.6% Now married1.2% Separated2.4% Widowed13.6% DivorcedFemales 28.6% Never married43.4% Now married1.6% Separated10.4% Widowed15.9% DivorcedWomen who gave birth in the past 12 months Now married:
67.7% (143)Unmarried:
32.3% (68)
Women who did not give birth in the past 12 months Now married:
39.2% (1,251)Unmarried:
60.8% (1,942)
Marital status - Black or African American population 15 years and over
Males 48.0% Never married48.5% Now married0.0% Separated0.0% Widowed3.4% DivorcedFemales 30.5% Never married33.8% Now married4.6% Separated17.4% Widowed13.7% DivorcedWomen who gave birth in the past 12 months Now married:
100.0% (35)Unmarried:
0.0% (0)
Women who did not give birth in the past 12 months Now married:
47.2% (273)Unmarried:
52.8% (305)
Marital status - American Indian / Alaska Native population 15 years and over
Males 68.6% Never married0.0% Now married0.0% Separated0.0% Widowed31.4% DivorcedFemales 45.6% Never married54.4% Now married0.0% Separated0.0% Widowed0.0% DivorcedWomen who did not give birth in the past 12 months Now married:
54.4% (51)Unmarried:
45.6% (43)
Marital status - Asian population 15 years and over
Males 30.4% Never married57.1% Now married2.1% Separated1.2% Widowed9.1% DivorcedFemales 32.4% Never married45.0% Now married0.0% Separated6.3% Widowed16.3% DivorcedWomen who gave birth in the past 12 months Now married:
50.0% (63)Unmarried:
50.0% (63)
Women who did not give birth in the past 12 months Now married:
48.7% (653)Unmarried:
51.3% (688)
Marital status - Native Hawaiian / Pacific Islander population 15 years and over
Males 42.2% Never married36.7% Now married0.0% Separated21.1% Widowed0.0% DivorcedFemales 39.0% Never married45.5% Now married1.2% Separated4.8% Widowed9.4% DivorcedWomen who did not give birth in the past 12 months Now married:
51.9% (206)Unmarried:
48.1% (191)
Marital status - Other race population 15 years and over
Males 54.5% Never married32.7% Now married4.2% Separated0.0% Widowed8.6% DivorcedFemales 47.6% Never married27.9% Now married16.0% Separated2.9% Widowed5.7% DivorcedWomen who gave birth in the past 12 months Now married:
100.0% (53)Unmarried:
0.0% (0)
Women who did not give birth in the past 12 months Now married:
44.9% (630)Unmarried:
55.1% (774)
Marital status - Two or more races population 15 years and over
Males 50.0% Never married29.2% Now married1.1% Separated0.6% Widowed19.1% DivorcedFemales 46.3% Never married26.7% Now married1.4% Separated8.3% Widowed17.3% DivorcedWomen who gave birth in the past 12 months Now married:
0.0% (0)Unmarried:
100.0% (94)
Women who did not give birth in the past 12 months Now married:
29.5% (275)Unmarried:
70.5% (659)
Marital status - White alone, not Hispanic / Latino population 15 years and over
Males 34.0% Never married48.3% Now married1.1% Separated2.6% Widowed14.0% DivorcedFemales 29.1% Never married42.9% Now married1.5% Separated10.7% Widowed15.8% DivorcedWomen who gave birth in the past 12 months Now married:
66.2% (138)Unmarried:
33.8% (70)
Women who did not give birth in the past 12 months Now married:
37.1% (1,118)Unmarried:
62.9% (1,892)
Marital status - Hispanic or Latino population 15 years and over
Males 53.6% Never married33.5% Now married3.9% Separated0.0% Widowed8.9% DivorcedFemales 43.1% Never married33.0% Now married11.3% Separated3.8% Widowed8.7% DivorcedWomen who gave birth in the past 12 months Now married:
100.0% (55)Unmarried:
0.0% (0)
Women who did not give birth in the past 12 months Now married:
45.8% (781)Unmarried:
54.2% (926)
Ancestries in Des Moines
1,167 7.1% German861 5.3% European757 4.6% Iraqi702 4.3% Ukrainian587 3.6% English575 3.5% American463 2.8% Norwegian404 2.5% Ethiopian388 2.4% Italian312 1.9% Irish236 1.4% Polish201 1.2% African164 1.0% Somali103 0.6% Afghan102 0.6% Swedish92 0.6% Kenyan85 0.5% Scotch-Irish81 0.5% Scottish59 0.4% Scandinavian54 0.3% Danish53 0.3% French51 0.3% Swiss49 0.3% Northern European45 0.3% British43 0.3% Brazilian37 0.2% Dutch29 0.2% Greek29 0.2% French Canadian28 0.2% Romanian28 0.2% Yugoslavian24 0.1% Finnish22 0.1% Bulgarian21 0.1% Welsh20 0.1% Latvian20 0.1% Portuguese15 0.09% Iranian14 0.09% Eastern European13 0.08% Czech11 0.07% Croatian8 0.05% Canadian6 0.04% Lithuanian
Geographical mobility in Des Moines Same house 1 year ago 13,780 85.6% White (Caucasian)2,959 92.3% Black or African American149 96.7% American Indian / Alaska Native3,776 89.9% Asian602 75.3% Native Hawaiian / Pacific Islander3,608 80.9% Other race3,306 84.8% Two or more races13,165 85.0% White alone, not Hispanic / Latino5,080 84.7% Hispanic or LatinoMoved within same county 1,303 8.1% White / Caucasian68 2.1% Black or African American284 6.8% Asian59 7.4% Native Hawaiian / Pacific Islander592 13.3% Other race366 9.4% Two or more races1,265 8.2% White alone, not Hispanic / Latino600 10.0% Hispanic or LatinoMoved within same state 336 2.1% White / Caucasian86 2.7% Black or African American69 8.7% Native Hawaiian / Pacific Islander64 1.4% Other race139 3.6% Two or more races334 2.2% White alone, not Hispanic / Latino167 2.8% Hispanic or LatinoMoved from different state 160 1.0% White / Caucasian46 1.4% Black or African American8 0.2% Asian28 3.5% Native Hawaiian / Pacific Islander156 3.5% Other race21 0.5% Two or more races165 1.1% White alone, not Hispanic / Latino119 2.0% Hispanic or LatinoMoved from abroad 474 2.9% White170 5.3% Black or African American115 2.7% Asian43 5.4% Native Hawaiian / Pacific Islander30 0.7% Other race134 3.4% Two or more races511 3.3% White alone, not Hispanic / Latino44 0.7% Hispanic or Latino
Children Nativity (place of birth) in Des Moines
Children under 6 years - Living with two parents Both parents native 607 100.0% NativeBoth parents foreign-born 607 96.6% Native22 3.4% Foreign-bornOne native, one foreign-born parent 379 100.0% NativeChildren under 6 years - Living with one parent Native parent 429 97.5% Native11 2.5% Foreign-bornForeign-born parent 447 81.5% Native101 18.5% Foreign-bornChildren 6 to 17 years - Living with two parents Both parents native 1,066 100.0% NativeBoth parents foreign-born 955 82.6% Native201 17.4% Foreign-bornOne native, one foreign-born parent 91 100.0% NativeChildren 6 to 17 years - Living with one parent Native parent 641 100.0% NativeForeign-born parent 1,017 54.5% Native848 45.5% Foreign-born
Grandparents responsible for own grandchildren in Des Moines
Grandparents (30 to 59 years) White / Caucasian 17 22.1% Responsible for grandchildren59 77.9% Not responsible for grandchildrenAsian 2 100.0% Not responsible for grandchildrenOther race 12 100.0% Not responsible for grandchildrenTwo or more races 18 100.0% Not responsible for grandchildrenWhite alone, not Hispanic / Latino 17 20.4% Responsible for grandchildren65 79.6% Not responsible for grandchildrenHispanic or Latino 14 100.0% Not responsible for grandchildrenGrandparents (60 years and over) White / Caucasian 43 34.1% Responsible for grandchildren84 65.9% Not responsible for grandchildrenAsian 104 100.0% Not responsible for grandchildrenOther race 20 100.0% Not responsible for grandchildrenTwo or more races 8 8.5% Responsible for grandchildren88 91.5% Not responsible for grandchildrenWhite alone, not Hispanic / Latino 43 33.5% Responsible for grandchildren85 66.5% Not responsible for grandchildrenHispanic or Latino 83 100.0% Not responsible for grandchildren