Damascus, MD (Maryland) Houses and Residents
| Damascus: | $495,037 |
| Maryland: | $398,100 |
Mean price in 2022:
Detached houses: $547,791
Here: $547,791 State: $526,819 Townhouses or other attached units: $350,218
Here: $350,218 State: $328,305 In 5-or-more-unit structures: $246,669
Here: $246,669 State: $350,378
Total population: 15,257 (Urban population: 10,161, Rural population: 1,156 (98 farm, 1,058 nonfarm))
Houses: 5,969 (5,761 occupied: 5,329 owner occupied, 475 renter occupied)
| % of renters here: | 8% |
| State: | 32% |
Housing density: 620 houses/condos per square mile
Median price asked for vacant for-sale houses and condos in 2022: $668,379.
Median contract rent in 2022: $1,557 (lower quartile is $1,105, upper quartile is $1,788)
Median rent asked for vacant for-rent units in 2022: $2,674
Median gross rent in Damascus, MD in 2022: $1,631
Housing units in Damascus with a mortgage: 3,969 (535 second mortgage, 0 home equity loan, 375 both second mortgage and home equity loan)
Houses without a mortgage: 47
Median household income for houses/condos with a mortgage: $162,563
Median household income for apartments without a mortgage: $133,944
Median monthly housing costs: $1,903
Compare current foreclosures near Damascus, MD:
| Photo | Address | Area | Beds / Baths | Price | Details |
|---|---|---|---|---|---|

|
#1
Mcwhorter Farm Ct
Damascus, MD 20872
|
6,621 sq. feet
|
6 baths 5 beds |
show details | |

|
#2
Ridge Rd
Damascus, MD 20872
|
1,080 sq. feet
|
1 baths - beds |
show details | |

|
#3
Budsman Ter
Damascus, MD 20872
|
1,372 sq. feet
|
3 baths - beds |
show details | |

|
#4
Purdum Rd
Damascus, MD 20872
|
4,348 sq. feet
|
3 baths - beds |
show details | |

|
#5
Middleboro Dr
Damascus, MD 20872
|
2,040 sq. feet
|
2 baths - beds |
show details | |

|
#6
Gue Rd
Damascus, MD 20872
|
2,400 sq. feet
|
3 baths - beds |
show details | |

|
#7
Woodfield Rd
Damascus, MD 20872
|
3,928 sq. feet
|
4 baths - beds |
show details | |

|
#8
Crosscut Way
Damascus, MD 20872
|
3,138 sq. feet
|
2 baths - beds |
show details | |

|
#9
Clearspring Rd
Damascus, MD 20872
|
2,751 sq. feet
|
2 baths - beds |
show details | |

|
#10
Bloom Dr
Damascus, MD 20872
|
- sq. feet
|
- baths - beds |
show details |
| Photo | Address | Area | Beds / Baths | Price | Details |
|---|---|---|---|---|---|

|
#11
Bowman Acres Ln
Damascus, MD 20872
|
- sq. feet
|
- baths - beds |
show details | |

|
#12
Damascus Rd
Damascus, MD 20872
|
- sq. feet
|
- baths - beds |
show details | |

|
#13
Bethesda Church Rd Apt 401
Damascus, MD 20872
|
- sq. feet
|
- baths - beds |
show details | |

|
#14
Brooke Knolls Rd
Gaithersburg, MD 20882
|
1,704 sq. feet
|
3 baths 4 beds |
$681,500
|
show details |

|
#15
Hammersmith Cir
Silver Spring, MD 20906
|
1,152 sq. feet
|
1 baths 3 beds |
$353,600
|
show details |

|
#16
Interlachen Dr Apt 111
Silver Spring, MD 20906
|
965 sq. feet
|
1 baths 2 beds |
$148,000
|
show details |

|
#17
Caledonia Ct Apt K
Germantown, MD 20874
|
1,087 sq. feet
|
2 baths 2 beds |
show details | |

|
#18
Sprigg St S
Frederick, MD 21704
|
2,442 sq. feet
|
4 baths 3 beds |
show details | |

|
#19
Berryville Rd
Germantown, MD 20874
|
960 sq. feet
|
1 baths 3 beds |
show details | |

|
#20
Brassie Pl Apt 201
Montgomery Village, MD 20886
|
1,054 sq. feet
|
2 baths 2 beds |
show details |
| Photo | Address | Area | Beds / Baths | Price | Details |
|---|---|---|---|---|---|

|
#21
Braeburn Dr
Walkersville, MD 21793
|
2,032 sq. feet
|
3 baths 3 beds |
show details | |

|
#22
Brooke Rd
Sandy Spring, MD 20860
|
5,046 sq. feet
|
4 baths 4 beds |
show details | |

|
#23
Carriage Hill Dr
Frederick, MD 21704
|
1,868 sq. feet
|
3 baths 3 beds |
show details | |

|
#24
Ridgeline Dr
Montgomery Village, MD 20886
|
1,794 sq. feet
|
2 baths 3 beds |
show details | |

|
#25
Palmetto Cir
Germantown, MD 20874
|
1,135 sq. feet
|
2 baths 3 beds |
show details | |

|
#26
Mosby Ct
Frederick, MD 21701
|
1,564 sq. feet
|
2 baths 3 beds |
show details | |

|
#27
Gaither Rd
Sykesville, MD 21784
|
2,191 sq. feet
|
2 baths 3 beds |
show details | |

|
#28
Gold Mine Rd
Brookeville, MD 20833
|
1,908 sq. feet
|
2 baths - beds |
show details | |

|
#29
Primus Ct
Frederick, MD 21703
|
1,316 sq. feet
|
3 baths - beds |
show details | |

|
#30
Massanutten Dr
Silver Spring, MD 20906
|
2,184 sq. feet
|
3 baths - beds |
show details |
| Photo | Address | Area | Beds / Baths | Price | Details |
|---|---|---|---|---|---|

|
#31
Lyon Pl
Rockville, MD 20851
|
1,414 sq. feet
|
2 baths - beds |
show details | |

|
#32
Monroe St Apt 1309
Rockville, MD 20850
|
870 sq. feet
|
1 baths - beds |
show details | |

|
#33
Baileys Ln
Silver Spring, MD 20906
|
2,933 sq. feet
|
4 baths - beds |
show details | |

|
#34
Massanutten Dr
Silver Spring, MD 20906
|
1,800 sq. feet
|
2 baths - beds |
show details | |

|
#35
Grandin Ave
Rockville, MD 20851
|
1,328 sq. feet
|
1 baths - beds |
show details | |

|
#36
Duncan Pl
Frederick, MD 21703
|
1,870 sq. feet
|
3 baths - beds |
show details | |

|
#37
Chester Mill Ter
Silver Spring, MD 20906
|
2,758 sq. feet
|
3 baths - beds |
show details | |

|
#38
Old Annapolis Rd
Frederick, MD 21701
|
2,302 sq. feet
|
3 baths - beds |
show details | |

|
#39
Maple Ave
Rockville, MD 20851
|
1,514 sq. feet
|
2 baths - beds |
show details | |

|
#40
Braddock Rd
Mount Airy, MD 21771
|
2,256 sq. feet
|
3 baths - beds |
show details |
| Photo | Address | Area | Beds / Baths | Price | Details |
|---|---|---|---|---|---|

|
#41
Woodcrest Dr
Rockville, MD 20853
|
2,330 sq. feet
|
2 baths - beds |
show details | |

|
#42
Upper Mill Ter N
Frederick, MD 21703
|
1,860 sq. feet
|
3 baths - beds |
show details | |

|
#43
Manorvale Rd
Rockville, MD 20853
|
2,032 sq. feet
|
2 baths - beds |
show details | |

|
#44
Parev Ter
Germantown, MD 20874
|
4,622 sq. feet
|
5 baths - beds |
show details | |

|
#45
Hartley Hall Pl
Germantown, MD 20874
|
4,569 sq. feet
|
3 baths - beds |
show details | |

|
#46
Georgia Ave
Rockville, MD 20853
|
2,576 sq. feet
|
3 baths - beds |
show details | |

|
#47
Scott Dr
Rockville, MD 20850
|
3,703 sq. feet
|
4 baths - beds |
show details | |

|
#48
Seneca Chase Park Rd
Poolesville, MD 20837
|
3,052 sq. feet
|
2 baths - beds |
show details | |

|
#49
Stapleton Ter
Frederick, MD 21703
|
1,716 sq. feet
|
2 baths - beds |
show details | |

|
Check over 1 million property listings on Foreclosure.com!
|
browse all offers | |||

Latest news about housing in Damascus, MD collected exclusively by city-data.com from local newspapers, TV, and radio stations


Median year apartment built: 1986
Household type by relationship:
Households: 16,776- Male householders: 2,897 (378 living alone), Female householders: 2,794 (499 living alone)
3,879 spouses (3,861 opposite-sex spouses), 251 unmarried partners, (251 opposite-sex unmarried partners), 5,779 children (5,513 natural, 44 adopted, 222 stepchildren), 202 grandchildren, 120 brothers or sisters, 330 parents, 0 foster children, 241 other relatives, 258 non-relatives
- In group quarters: 17
Size of family households: 1,497 2-persons, 1,302 3-persons, 1,026 4-persons, 454 5-persons, 103 6-persons, 165 7-or-more-persons.
Size of nonfamily households: 1,003 1-person, 141 2-persons, 41 3-persons.
2,981 married couples with children.
448 single-parent households (179 men, 269 women).
79.3% of residents of Damascus speak English at home.
9.8% of residents speak Spanish at home (72% speak English very well, 20% speak English well, 7% speak English not well, 1% don't speak English at all).
3.5% of residents speak other Indo-European language at home (85% speak English very well, 8% speak English well, 7% speak English not well).
2.8% of residents speak Asian or Pacific Island language at home (70% speak English very well, 12% speak English well, 18% speak English not well).
2.9% of residents speak other language at home (99% speak English very well, 1% speak English not well).
Foreign born population: 2,227 (13.3%)
(66.1% of them are naturalized citizens)
| Here: | 8.2 |
| State: | 7.3 |
| Here: | 5.1 |
| State: | 4.2 |

- Bedrooms in owner-occupied houses and condos in Damascus, Maryland
- 0no bedroom
- 81 bedroom
- 4092 bedrooms
- 1,8183 bedrooms
- 2,2734 bedrooms
- 8225+ bedrooms

- Bedrooms in renter-occupied apartments in Damascus, Maryland
- 17no bedroom
- 01 bedroom
- 2342 bedrooms
- 1473 bedrooms
- 704 bedrooms
- 75+ bedrooms

- Cars and other vehicles available in Damascus in owner-occupied houses/condos
- 73no vehicle
- 7411 vehicle
- 2,4882 vehicles
- 1,2703 vehicles
- 5514 vehicles
- 2065+ vehicles

- Cars and other vehicles available in Damascus in renter-occupied apartments
- 17no vehicle
- 2861 vehicle
- 1262 vehicles
- 243 vehicles
- 74 vehicles
- 145+ vehicles

- Rooms in owner-occupied houses in Damascus, Maryland
- 01 room
- 82 rooms
- 313 rooms
- 2364 rooms
- 3405 rooms
- 5426 rooms
- 8047 rooms
- 8668 rooms
- 2,5019+ rooms

- Rooms in renter-occupied apartments in Damascus, Maryland
- 171 room
- 02 rooms
- 503 rooms
- 1014 rooms
- 1235 rooms
- 556 rooms
- 477 rooms
- 328 rooms
- 519+ rooms


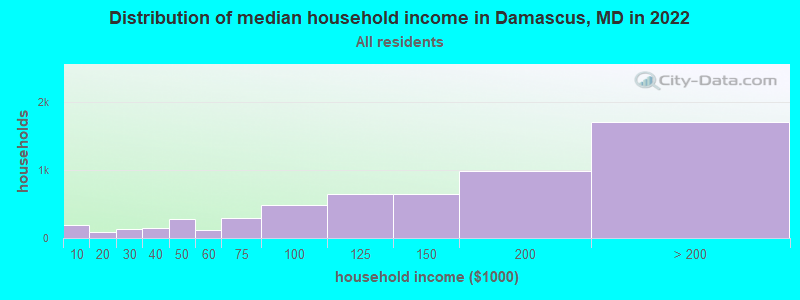
Damascus, MD household income distribution

- 191Less than $10,000
- 83$10,000 to $19,999
- 133$20,000 to $29,999
- 145$30,000 to $39,999
- 282$40,000 to $49,999
- 120$50,000 to $59,999
- 288$60,000 to $74,999
- 486$75,000 to $99,999
- 650$100,000 to $124,999
- 644$125,000 to $149,999
- 989$150,000 to $199,999
- 1,704$200,000 or more
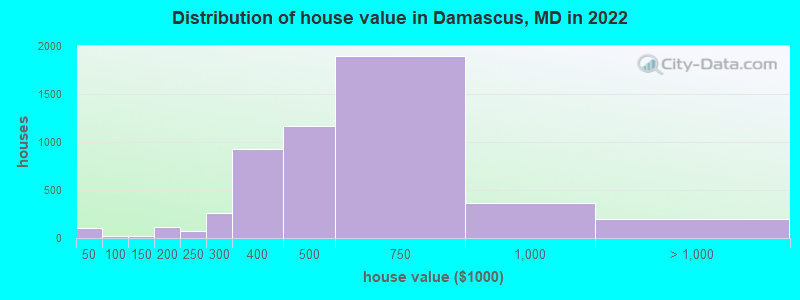
Home value of owner - occupied houses in 2022 in Damascus, MD
-
- 72Less than $10,000
- 10$35,000 to $39,999
- 17$40,000 to $49,999
- 3$80,000 to $89,999
- 10$100,000 to $124,999
- 8$125,000 to $149,999
- 65$150,000 to $174,999
- 50$175,000 to $199,999
- 68$200,000 to $249,999
- 261$250,000 to $299,999
- 925$300,000 to $399,999
- 1,166$400,000 to $499,999
- 1,901$500,000 to $749,999
- 364$750,000 to $999,999
- 193$1,000,000 to $1,499,999
- 5$1,500,000 to $1,999,999
- 4$2,000,000 or more
Rent paid by renters in 2022 in Damascus, MD
-
- 7$200 to $249
- 38$450 to $499
- 10$550 to $599
- 8$900 to $999
- 44$1,000 to $1,249
- 52$1,250 to $1,499
- 194$1,500 to $1,999
- 43$2,000 to $2,499
- 3$2,500 to $2,999
- 71No cash rent


Percentage of workers working in this county: 82.4%
Number of people working at home: 2,544 (27.2% of all workers)
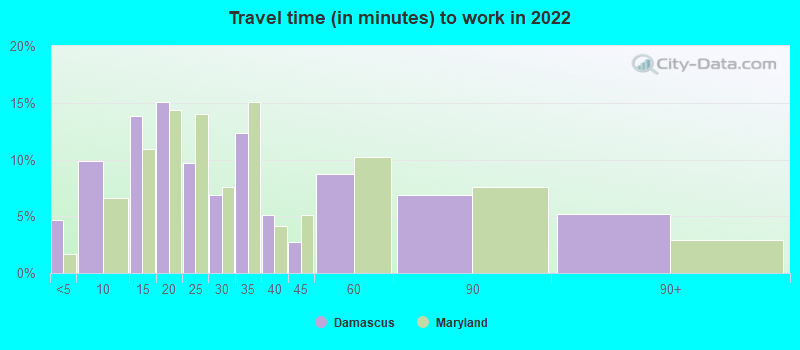
Travel time to work (commute)
- Less than 5 minutes: 130
- 5 to 9 minutes: 275
- 10 to 14 minutes: 336
- 15 to 19 minutes: 597
- 20 to 24 minutes: 489
- 25 to 29 minutes: 569
- 30 to 34 minutes: 1,080
- 35 to 39 minutes: 416
- 40 to 44 minutes: 426
- 45 to 59 minutes: 926
- 60 to 89 minutes: 1,057
- 90 or more minutes: 337
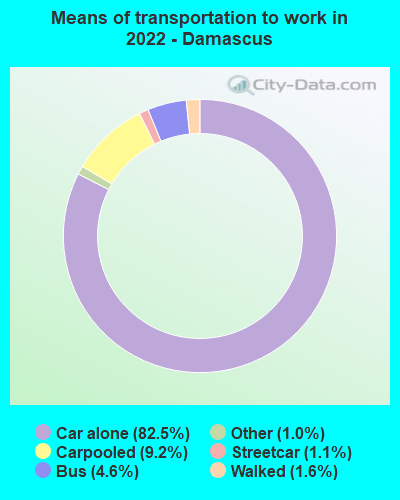
Means of transportation to work:
- Drove a car alone: 2,137 (44.4%)
- Carpooled: 254 (5.3%)
- Bus: 102 (2.1%)
- Subway or elevated rail: 23 (0.5%)
- Taxi: 28 (0.6%)
- Walked: 35 (0.7%)
- Worked at home: 2,544 (52.9%)

- Unemployment by race in 2022
- Unemployment rate for White non-Hispanic residents
- 2.8%Males
- 1.1%Females
- Unemployment rate for Black residents
- 3.5%Males
- 2.1%Females
- Unemployment rate for Asian residents
- 3.7%Males
- 4.1%Females
- Unemployment rate for other race residents
- 0.8%Males
- 10.2%Females
- Unemployment rate for two or more race residents
- 1.7%Males
- 1.8%Females
- Unemployment rate for Hispanic or Latino residents
- 2.1%Males
- 17.1%Females

- Year of entry for the foreign-born population in Damascus, Maryland
- 5372010 or later
- 6262000 to 2009
- 4261990 to 1999
- 1971980 to 1989
- 1071970 to 1979
- 116Before 1970

First ancestries reported:
- English: 1,560 (17.3%)
- German: 643 (7.1%)
- Irish: 619 (6.9%)
- American: 611 (6.8%)
- European: 368 (4.1%)
- Romanian: 342 (3.8%)
- Italian: 316 (3.5%)
- Polish: 271 (3.0%)
- Ghanaian: 247 (2.7%)
- Scottish: 153 (1.7%)
- Eastern European: 111 (1.2%)
- Nigerian: 95 (1.1%)
- Russian: 85 (0.9%)
- French: 66 (0.7%)
- Greek: 61 (0.7%)
- Jamaican: 61 (0.7%)
- Czech: 51 (0.6%)
- African: 42 (0.5%)
- Northern European: 41 (0.5%)
- Scotch-Irish: 39 (0.4%)
- Slovene: 36 (0.4%)
- Egyptian: 31 (0.3%)
- Scandinavian: 25 (0.3%)
- Austrian: 25 (0.3%)
- Slavic: 25 (0.3%)
- British: 23 (0.3%)
- Senegalese: 23 (0.3%)
- Finnish: 21 (0.2%)
- Dutch: 19 (0.2%)
- Swiss: 19 (0.2%)
- Palestinian: 16 (0.2%)
- Slovak: 16 (0.2%)
- Ukrainian: 13 (0.1%)
- Zimbabwean: 12 (0.1%)
- Syrian: 9 (0.10%)
- Croatian: 9 (0.10%)
- French Canadian: 9 (0.10%)
- West Indian: 9 (0.10%)
- Liberian: 8 (0.09%)
- South African: 8 (0.09%)
- Armenian: 8 (0.09%)
- Arab: 7 (0.08%)
- Canadian: 7 (0.08%)
- Brazilian: 6 (0.07%)
- Cypriot: 6 (0.07%)
Most common places of birth for foreign-born residents (%):
| Damascus: | 14.8% (329) |
| Maryland: | 12.0% (115,412) |
| Damascus: | 10.8% (240) |
| Maryland: | 1.8% (17,774) |
| Damascus: | 5.8% (130) |
| Maryland: | 6.4% (61,725) |
| Damascus: | 5.1% (114) |
| Maryland: | 2.5% (24,026) |
| Damascus: | 4.9% (110) |
| Maryland: | 0.5% (4,901) |
| Damascus: | 4.8% (108) |
| Maryland: | 0.6% (5,828) |
| Damascus: | 4.0% (90) |
| Maryland: | 1.3% (12,898) |
| Damascus: | 3.0% (67) |
| Maryland: | 3.8% (36,698) |
| Damascus: | 2.6% (58) |
| Maryland: | 0.7% (6,724) |
| Damascus: | 2.5% (55) |
| Maryland: | 0.5% (4,995) |
| Damascus: | 2.4% (54) |
| Maryland: | 4.4% (42,350) |
| Damascus: | 2.4% (53) |
| Maryland: | 1.8% (17,161) |
| Damascus: | 2.2% (50) |
| Maryland: | 1.0% (9,481) |
| Damascus: | 2.2% (49) |
| Maryland: | 3.4% (32,635) |
| Damascus: | 2.1% (46) |
| Maryland: | 1.8% (17,037) |
| Damascus: | 2.0% (45) |
| Maryland: | 4.6% (44,742) |
| Damascus: | 1.5% (34) |
| Maryland: | 0.5% (4,596) |
Place of birth for U.S.-born residents:
- This state: 7,649
- Other state: 6,363
- Northeast: 2,131
- Midwest: 683
- South: 2,919
- West: 599
94.5% of Damascus residents lived in the same house 1 years ago.
Out of people who lived in different houses, 39.6% lived in this county.
Out of people who lived in different counties, 54.0% lived in Maryland.
| Damascus: | 94.5% |
| State average: | 88.5% |
Education attainment for males 25 years and older:
- No schooling: 28
- Nursery to 4th grade: 22
- 5th and 6th grade: 14
- 7th and 8th grade: 1
- 9th grade: 13
- 10th grade: 29
- 11th grade: 38
- 12th grade, no diploma: 68
- High school graduate (or equivalency): 1,366
- Less than 1 year of college: 309
- Some college more than 1 year, no degree: 798
- Associate degree: 213
- Bachelor's degree: 1,466
- Master's degree: 951
- Professional school degree: 83
- Doctorate degree: 71

Education attainment for females 25 years and older:
- No schooling: 81
- Nursery to 4th grade: 7
- 5th and 6th grade: 13
- 7th and 8th grade: 9
- 9th grade: 28
- 10th grade: 4
- 11th grade: 61
- 12th grade, no diploma: 91
- High school graduate (or equivalency): 812
- Less than 1 year of college: 301
- Some college more than 1 year, no degree: 799
- Associate degree: 383
- Bachelor's degree: 1,682
- Master's degree: 1,396
- Professional school degree: 132
- Doctorate degree: 164


Housing units in structures:
- One, detached: 4,523
- One, attached: 957
- Two: 13
- 3 or 4: 28
- 5 to 9: 79
- 10 to 19: 326
- 50 or more: 40
Housing units lacking complete kitchen facilities in 2022: 0.8%
House/condo owner moved in on average 17 years ago
Renter moved in on average 5 years ago

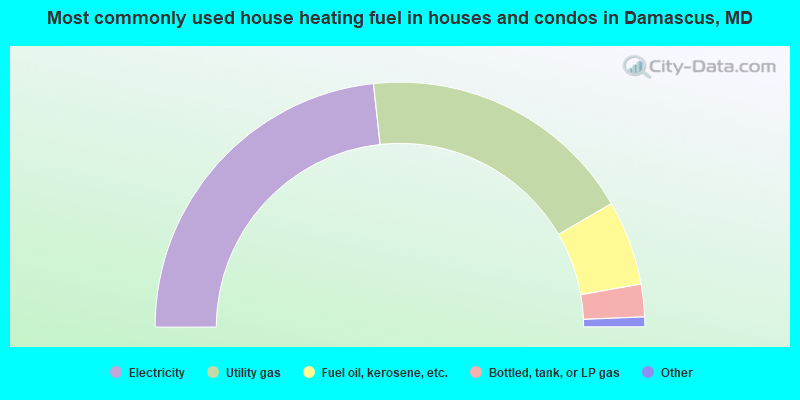
- 46.5%Electricity
- 36.6%Utility gas
- 11.2%Fuel oil, kerosene, etc.
- 4.3%Bottled, tank, or LP gas
- 0.6%Wood
- 0.4%Other fuel
- 0.3%No fuel used
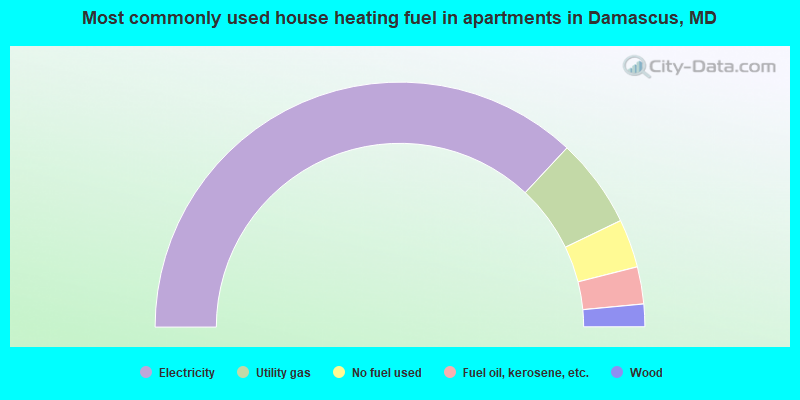
- 73.9%Electricity
- 11.8%Utility gas
- 6.4%No fuel used
- 4.9%Fuel oil, kerosene, etc.
- 3.0%Wood
Private vs. public school enrollment:
| Here: | 11.4% |
| Maryland: | 15.2% |
| Here: | 7.7% |
| Maryland: | 14.4% |
| Here: | 20.4% |
| Maryland: | 20.2% |


