Races in Damascus, Maryland (MD) Detailed Stats
Data:
Races - White alone (%)
Races - White alone (% change since 2000)
Races - Black alone (%)
Races - Black alone (% change since 2000)
Races - American Indian alone (%)
Races - American Indian alone (% change since 2000)
Races - Asian alone (%)
Races - Asian alone (% change since 2000)
Races - Hispanic (%)
Races - Hispanic (% change since 2000)
Races - Native Hawaiian and Other Pacific Islander alone (%)
Races - Native Hawaiian and Other Pacific Islander alone (% change since 2000)
Races - Two or more races(%)
Races - Two or more races(% change since 2000)
Races - Other race alone (%)
Races - Other race alone (% change since 2000)
Racial diversity
Place of birth - Born in state of residence (%)
Place of birth - Born in state of residence (%) - White
Place of birth - Born in state of residence (%) - Black or African American
Place of birth - Born in state of residence (%) - Asian
Place of birth - Born in state of residence (%) - Hispanic or Latino
Place of birth - Born in state of residence (%) - American Indian and Alaska Native
Place of birth - Born in state of residence (%) - Multirace
Place of birth - Born in state of residence (%) - Other Race
Place of birth - Born in other state (%)
Place of birth - Born in other state (%) - White
Place of birth - Born in other state (%) - Black or African American
Place of birth - Born in other state (%) - Asian
Place of birth - Born in other state (%) - Hispanic or Latino
Place of birth - Born in other state (%) - American Indian and Alaska Native
Place of birth - Born in other state (%) - Multirace
Place of birth - Born in other state (%) - Other Race
Place of birth - Native, outside of US (%)
Place of birth - Native, outside of US (%) - White
Place of birth - Native, outside of US (%) - Black or African American
Place of birth - Native, outside of US (%) - Asian
Place of birth - Native, outside of US (%) - Hispanic or Latino
Place of birth - Native, outside of US (%) - American Indian and Alaska Native
Place of birth - Native, outside of US (%) - Multirace
Place of birth - Native, outside of US (%) - Other Race
Place of birth - Foreign born (%)
Place of birth - Foreign born (%) - White
Place of birth - Foreign born (%) - Black or African American
Place of birth - Foreign born (%) - Asian
Place of birth - Foreign born (%) - Hispanic or Latino
Place of birth - Foreign born (%) - American Indian and Alaska Native
Place of birth - Foreign born (%) - Multirace
Place of birth - Foreign born (%) - Other Race
Residents speaking English at home (%)
Residents speaking English at home - Born in the United States (%)
Residents speaking English at home - Native, born elsewhere (%)
Residents speaking English at home - Foreign born (%)
Residents speaking Spanish at home (%)
Residents speaking Spanish at home - Born in the United States (%)
Residents speaking Spanish at home - Native, born elsewhere (%)
Residents speaking Spanish at home - Foreign born (%)
Residents speaking other language at home (%)
Residents speaking other language at home - Born in the United States (%)
Residents speaking other language at home - Native, born elsewhere (%)
Residents speaking other language at home - Foreign born (%)
Marital status - Never married (%)
Marital status - Now married (%)
Marital status - Separated (%)
Marital status - Widowed (%)
Marital status - Divorced (%)
Ancestries Reported - Arab (%)
Ancestries Reported - Czech (%)
Ancestries Reported - Danish (%)
Ancestries Reported - Dutch (%)
Ancestries Reported - English (%)
Ancestries Reported - French (%)
Ancestries Reported - French Canadian (%)
Ancestries Reported - German (%)
Ancestries Reported - Greek (%)
Ancestries Reported - Hungarian (%)
Ancestries Reported - Irish (%)
Ancestries Reported - Italian (%)
Ancestries Reported - Lithuanian (%)
Ancestries Reported - Norwegian (%)
Ancestries Reported - Polish (%)
Ancestries Reported - Portuguese (%)
Ancestries Reported - Russian (%)
Ancestries Reported - Scotch-Irish (%)
Ancestries Reported - Scottish (%)
Ancestries Reported - Slovak (%)
Ancestries Reported - Subsaharan African (%)
Ancestries Reported - Swedish (%)
Ancestries Reported - Swiss (%)
Ancestries Reported - Ukrainian (%)
Ancestries Reported - United States (%)
Ancestries Reported - Welsh (%)
Ancestries Reported - West Indian (%)
Ancestries Reported - Other (%)
Geographical mobility - Same house 1 year ago (%)
Geographical mobility - Same house 1 year ago (%) - White
Geographical mobility - Same house 1 year ago (%) - Black or African American
Geographical mobility - Same house 1 year ago (%) - Asian
Geographical mobility - Same house 1 year ago (%) - Hispanic or Latino
Geographical mobility - Same house 1 year ago (%) - American Indian and Alaska Native
Geographical mobility - Same house 1 year ago (%) - Multirace
Geographical mobility - Same house 1 year ago (%) - Other Race
Geographical mobility - Moved within same county (%)
Geographical mobility - Moved within same county (%) - White
Geographical mobility - Moved within same county (%) - Black or African American
Geographical mobility - Moved within same county (%) - Asian
Geographical mobility - Moved within same county (%) - Hispanic or Latino
Geographical mobility - Moved within same county (%) - American Indian and Alaska Native
Geographical mobility - Moved within same county (%) - Multirace
Geographical mobility - Moved within same county (%) - Other Race
Geographical mobility - Moved from different county within same state (%)
Geographical mobility - Moved from different county within same state (%) - White
Geographical mobility - Moved from different county within same state (%) - Black or African American
Geographical mobility - Moved from different county within same state (%) - Asian
Geographical mobility - Moved from different county within same state (%) - Hispanic or Latino
Geographical mobility - Moved from different county within same state (%) - American Indian and Alaska Native
Geographical mobility - Moved from different county within same state (%) - Multirace
Geographical mobility - Moved from different county within same state (%) - Other Race
Geographical mobility - Moved from different state (%)
Geographical mobility - Moved from different state (%) - White
Geographical mobility - Moved from different state (%) - Black or African American
Geographical mobility - Moved from different state (%) - Asian
Geographical mobility - Moved from different state (%) - Hispanic or Latino
Geographical mobility - Moved from different state (%) - American Indian and Alaska Native
Geographical mobility - Moved from different state (%) - Multirace
Geographical mobility - Moved from different state (%) - Other Race
Geographical mobility - Moved from abroad (%)
Geographical mobility - Moved from abroad (%) - White
Geographical mobility - Moved from abroad (%) - Black or African American
Geographical mobility - Moved from abroad (%) - Asian
Geographical mobility - Moved from abroad (%) - Hispanic or Latino
Geographical mobility - Moved from abroad (%) - American Indian and Alaska Native
Geographical mobility - Moved from abroad (%) - Multirace
Geographical mobility - Moved from abroad (%) - Other Race
Place of birth for the foreign-born population - Ireland (%)
Place of birth for the foreign-born population - Denmark (%)
Place of birth for the foreign-born population - Norway (%)
Place of birth for the foreign-born population - Sweden (%)
Place of birth for the foreign-born population - United Kingdom (%)
Place of birth for the foreign-born population - England (%)
Place of birth for the foreign-born population - Scotland (%)
Place of birth for the foreign-born population - Other Northern Europe (%)
Place of birth for the foreign-born population - Austria (%)
Place of birth for the foreign-born population - Belgium (%)
Place of birth for the foreign-born population - France (%)
Place of birth for the foreign-born population - Germany (%)
Place of birth for the foreign-born population - Netherlands (%)
Place of birth for the foreign-born population - Switzerland (%)
Place of birth for the foreign-born population - Other Western Europe (%)
Place of birth for the foreign-born population - Greece (%)
Place of birth for the foreign-born population - Italy (%)
Place of birth for the foreign-born population - Portugal (%)
Place of birth for the foreign-born population - Spain (%)
Place of birth for the foreign-born population - Other Southern Europe (%)
Place of birth for the foreign-born population - Albania (%)
Place of birth for the foreign-born population - Belarus (%)
Place of birth for the foreign-born population - Bosnia and Herzegovina (%)
Place of birth for the foreign-born population - Bulgaria (%)
Place of birth for the foreign-born population - Croatia (%)
Place of birth for the foreign-born population - Czechoslovakia (%)
Place of birth for the foreign-born population - Hungary (%)
Place of birth for the foreign-born population - Latvia (%)
Place of birth for the foreign-born population - Lithuania (%)
Place of birth for the foreign-born population - North Macedonia (Macedonia) (%)
Place of birth for the foreign-born population - Moldova (%)
Place of birth for the foreign-born population - Poland (%)
Place of birth for the foreign-born population - Romania (%)
Place of birth for the foreign-born population - Russia (%)
Place of birth for the foreign-born population - Serbia (%)
Place of birth for the foreign-born population - Ukraine (%)
Place of birth for the foreign-born population - Other Eastern Europe (%)
Place of birth for the foreign-born population - China (%)
Place of birth for the foreign-born population - Hong Kong (%)
Place of birth for the foreign-born population - Taiwan (%)
Place of birth for the foreign-born population - Japan (%)
Place of birth for the foreign-born population - Korea (%)
Place of birth for the foreign-born population - Other Eastern Asia (%)
Place of birth for the foreign-born population - Afghanistan (%)
Place of birth for the foreign-born population - Bangladesh (%)
Place of birth for the foreign-born population - India (%)
Place of birth for the foreign-born population - Iran (%)
Place of birth for the foreign-born population - Kazakhstan (%)
Place of birth for the foreign-born population - Nepal (%)
Place of birth for the foreign-born population - Pakistan (%)
Place of birth for the foreign-born population - Sri Lanka (%)
Place of birth for the foreign-born population - Uzbekistan (%)
Place of birth for the foreign-born population - Other South Central Asia (%)
Place of birth for the foreign-born population - Burma (%)
Place of birth for the foreign-born population - Cambodia (%)
Place of birth for the foreign-born population - Indonesia (%)
Place of birth for the foreign-born population - Laos (%)
Place of birth for the foreign-born population - Malaysia (%)
Place of birth for the foreign-born population - Philippines (%)
Place of birth for the foreign-born population - Singapore (%)
Place of birth for the foreign-born population - Thailand (%)
Place of birth for the foreign-born population - Vietnam (%)
Place of birth for the foreign-born population - Other South Eastern Asia (%)
Place of birth for the foreign-born population - Armenia (%)
Place of birth for the foreign-born population - Iraq (%)
Place of birth for the foreign-born population - Israel (%)
Place of birth for the foreign-born population - Jordan (%)
Place of birth for the foreign-born population - Kuwait (%)
Place of birth for the foreign-born population - Lebanon (%)
Place of birth for the foreign-born population - Saudi Arabia (%)
Place of birth for the foreign-born population - Syria (%)
Place of birth for the foreign-born population - Turkey (%)
Place of birth for the foreign-born population - Yemen (%)
Place of birth for the foreign-born population - Other Western Asia (%)
Place of birth for the foreign-born population - Eritrea (%)
Place of birth for the foreign-born population - Ethiopia (%)
Place of birth for the foreign-born population - Kenya (%)
Place of birth for the foreign-born population - Somalia (%)
Place of birth for the foreign-born population - Uganda (%)
Place of birth for the foreign-born population - Zimbabwe (%)
Place of birth for the foreign-born population - Other Eastern Africa (%)
Place of birth for the foreign-born population - Cameroon (%)
Place of birth for the foreign-born population - Congo (%)
Place of birth for the foreign-born population - Democratic Republic of Congo (Zaire) (%)
Place of birth for the foreign-born population - Other Middle Africa (%)
Place of birth for the foreign-born population - Egypt (%)
Place of birth for the foreign-born population - Morocco (%)
Place of birth for the foreign-born population - Sudan (%)
Place of birth for the foreign-born population - Other Northern Africa (%)
Place of birth for the foreign-born population - South Africa (%)
Place of birth for the foreign-born population - Other Southern Africa (%)
Place of birth for the foreign-born population - Cabo Verde (%)
Place of birth for the foreign-born population - Ghana (%)
Place of birth for the foreign-born population - Liberia (%)
Place of birth for the foreign-born population - Nigeria (%)
Place of birth for the foreign-born population - Senegal (%)
Place of birth for the foreign-born population - Sierra Leone (%)
Place of birth for the foreign-born population - Other Western Africa (%)
Place of birth for the foreign-born population - Australia (%)
Place of birth for the foreign-born population - New Zealand (%)
Place of birth for the foreign-born population - Fiji (%)
Place of birth for the foreign-born population - Micronesia (%)
Place of birth for the foreign-born population - Bahamas (%)
Place of birth for the foreign-born population - Barbados (%)
Place of birth for the foreign-born population - Cuba (%)
Place of birth for the foreign-born population - Dominica (%)
Place of birth for the foreign-born population - Dominican Republic (%)
Place of birth for the foreign-born population - Grenada (%)
Place of birth for the foreign-born population - Haiti (%)
Place of birth for the foreign-born population - Jamaica (%)
Place of birth for the foreign-born population - St. Vincent and the Grenadines (%)
Place of birth for the foreign-born population - Trinidad and Tobago (%)
Place of birth for the foreign-born population - West Indies (%)
Place of birth for the foreign-born population - Other Caribbean (%)
Place of birth for the foreign-born population - Belize (%)
Place of birth for the foreign-born population - Costa Rica (%)
Place of birth for the foreign-born population - El Salvador (%)
Place of birth for the foreign-born population - Guatemala (%)
Place of birth for the foreign-born population - Honduras (%)
Place of birth for the foreign-born population - Mexico (%)
Place of birth for the foreign-born population - Nicaragua (%)
Place of birth for the foreign-born population - Panama (%)
Place of birth for the foreign-born population - Other Central America (%)
Place of birth for the foreign-born population - Argentina (%)
Place of birth for the foreign-born population - Bolivia (%)
Place of birth for the foreign-born population - Brazil (%)
Place of birth for the foreign-born population - Chile (%)
Place of birth for the foreign-born population - Colombia (%)
Place of birth for the foreign-born population - Ecuador (%)
Place of birth for the foreign-born population - Guyana (%)
Place of birth for the foreign-born population - Peru (%)
Place of birth for the foreign-born population - Uruguay (%)
Place of birth for the foreign-born population - Venezuela (%)
Place of birth for the foreign-born population - Other South America (%)
Place of birth for the foreign-born population - Canada (%)
Place of birth for the foreign-born population - Other Northern America (%)
Place of birth for the foreign-born population - Other (%)
Latest news about races in Damascus, MD collected exclusively by city-data.com from local newspapers, TV, and radio stations
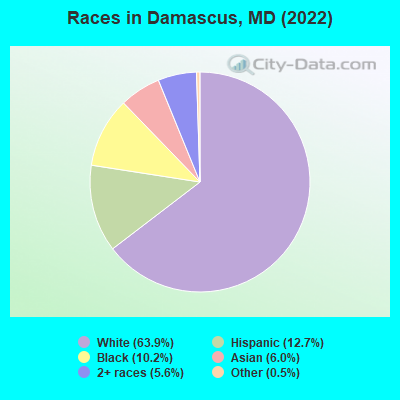
According to 2022 data, the most numerous races in Damascus, MD are White alone (10,723 residents), Black alone (1,712 residents), and Hispanic (2,134 residents). 79.5% of Damascus residents speak English at home. 13.3% of Damascus, MD residents are foreign-born (5.0% born in Latin America, 3.5% born in Asia, 2.2% born in Africa, 1.9% born in Europe), which is 20.5% less than the foreign-born rate of 16.0% across the entire state of Maryland.
Race distribution in Damascus
2000 2022
3,286,547 62.1% White alone 1,464,735 27.7% Black alone 227,916 4.3% Hispanic 209,738 4.0% Asian alone 82,946 1.6% Two or more races 13,312 0.3% American Indian alone 9,379 0.2% Other race alone 1,913 0.04% Native Hawaiian and Other
2,906,492 47.1% White alone 1,800,914 29.2% Black alone 705,842 11.4% Hispanic 401,818 6.5% Asian alone 291,317 4.7% Two or more races 46,930 0.8% Other race alone 8,930 0.1% American Indian alone 2,417 0.04% Native Hawaiian and Other
Income and house value in Damascus Median household income in 2022 $149,230 White non-Hispanic householders$139,625 Black householders$167,720 Asian householders$42,931 Some other race householders$113,459 Two or more races householders$84,760 Hispanic or Latino race householdersMedian 2022 house value $507,317 White Non-Hispanic householders$305,099 Black or African American householders $542,521 Asian householders$436,636 Some other race householders$370,322 Two or more races householders$443,459 Hispanic or Latino householders
Median age by race in Damascus
45.6 Median age for White residents43.3 47.1 36.4 Median age for Black or African American residents36.9 34.7 -610,526,315.2 Median age for American Indian / Alaska Native residents-555,555,555.0 -671,704,449.4 37.0 Median age for Asian residents38.3 36.1 -763,333,332.6 Median age for Native Hawaiian / Pacific Islander residents-720,061,021.4 -760,942,760.2 30.9 Median age for Other race residents22.0 31.4 42.1 Median age for Two or more races residents39.6 51.5 46.1 Median age for White alone residents43.8 47.7 28.8 Median age for Hispanic or Latino residents24.2 31.4
Owner/renter occupied households by race in Damascus
House owners and renters - White residents 3,679 93.0% Owner occupied277 7.0% Renter occupiedHouse owners and renters - Black or African American residents 542 82.5% Owner occupied115 17.5% Renter occupiedHouse owners and renters - Asian residents 330 93.8% Owner occupied22 6.2% Renter occupiedHouse owners and renters - Other race residents 244 85.5% Owner occupied42 14.5% Renter occupiedHouse owners and renters - Two or more races residents 467 99.2% Owner occupied4 0.8% Renter occupiedHouse owners and renters - White alone residents 3,720 93.8% Owner occupied244 6.2% Renter occupiedHouse owners and renters - Hispanic or Latino residents 412 82.4% Owner occupied88 17.6% Renter occupied
Language usage in Damascus
English speakers - Total 79.5% of residents of Damascus speak English at home.
10.0% of residents speak Spanish at home 1,113 70.0% Speak English very well478 30.0% Speak English less than very well9.1% of residents speak other language at home 1,229 84.8% Speak English very well221 15.2% Speak English less than very well
English speakers - Born in the United States 93.0% of residents of Damascus speak English at home.
3.1% of residents speak Spanish at home 192 99.0% Speak English very well2 1.0% Speak English less than very well4.2% of residents speak other language at home 191 72.6% Speak English very well72 27.4% Speak English less than very well
English speakers - Native, born elsewhere 45.8% of residents of Damascus speak English at home.
50.9% of residents speak Spanish at home 187 86.6% Speak English very well29 13.4% Speak English less than very well
English speakers - Foreign-born 26.2% of residents of Damascus speak English at home.
31.7% of residents speak Spanish at home 308 43.7% Speak English very well397 56.3% Speak English less than very well41.7% of residents speak other language at home 788 84.9% Speak English very well140 15.1% Speak English less than very well
White (Caucasian) - Speak only English Native:
96.8% (9,700)Foreign-born:
54.4% (274)
White (Caucasian) - Speak another language Native:
4.3% (435)Foreign-born:
53.1% (268)
Black or African American - Speak only English Native:
89.0% (1,052)Foreign-born:
24.0% (97)
Black or African American - Speak another language Native:
10.8% (127)Foreign-born:
75.4% (304)
Asian - Speak only English Native:
40.8% (163)Foreign-born:
25.9% (142)
Asian - Speak another language Native:
60.4% (242)Foreign-born:
74.9% (411)
Other race - Speak only English Native:
59.2% (288)Foreign-born:
7.1% (38)
Other race - Speak another language Native:
50.0% (243)Foreign-born:
92.4% (490)
Two or more races - Speak only English Native:
72.8% (895)Foreign-born:
17.8% (36)
Two or more races - Speak another language Native:
25.3% (311)Foreign-born:
82.7% (168)
White alone - Speak only English Native:
98.4% (9,635)Foreign-born:
58.1% (263)
White alone - Speak another language Native:
1.9% (184)Foreign-born:
38.5% (174)
Hispanic or Latino - Speak only English Native:
33.1% (399)Foreign-born:
6.1% (47)
Hispanic or Latino - Speak another language Native:
67.1% (809)Foreign-born:
93.8% (724)
Foreign-born residents in Damascus 2,227 residents are foreign born (5.0% Latin America , 3.5% Asia , 2.2% Africa , 1.9% Europe ).
This city:
13.3%Maryland:
15.7%
Marital status for residents in Damascus Marital status - White (Caucasian) population 15 years and over
Males 31.4% Never married60.7% Now married0.3% Separated1.0% Widowed6.7% DivorcedFemales 25.6% Never married56.7% Now married0.4% Separated6.7% Widowed10.6% DivorcedWomen who gave birth in the past 12 months Now married:
91.3% (101)Unmarried:
8.7% (10)
Women who did not give birth in the past 12 months Now married:
42.5% (861)Unmarried:
57.5% (1,168)
Marital status - Black or African American population 15 years and over
Males 35.8% Never married49.4% Now married0.0% Separated0.0% Widowed14.7% DivorcedFemales 40.0% Never married48.9% Now married0.0% Separated3.0% Widowed8.1% DivorcedWomen who gave birth in the past 12 months Now married:
65.5% (19)Unmarried:
34.5% (10)
Women who did not give birth in the past 12 months Now married:
46.1% (184)Unmarried:
53.9% (214)
Marital status - Asian population 15 years and over
Males 10.8% Never married80.0% Now married8.2% Separated0.0% Widowed1.0% DivorcedFemales 17.2% Never married73.2% Now married0.0% Separated0.0% Widowed9.6% DivorcedWomen who gave birth in the past 12 months Now married:
100.0% (29)Unmarried:
0.0% (0)
Women who did not give birth in the past 12 months Now married:
77.1% (236)Unmarried:
22.9% (70)
Marital status - Other race population 15 years and over
Males 44.7% Never married45.8% Now married0.0% Separated0.0% Widowed9.5% DivorcedFemales 36.6% Never married40.1% Now married0.0% Separated6.4% Widowed17.0% DivorcedWomen who gave birth in the past 12 months Now married:
100.0% (13)Unmarried:
0.0% (0)
Women who did not give birth in the past 12 months Now married:
41.8% (134)Unmarried:
58.2% (186)
Marital status - Two or more races population 15 years and over
Males 25.5% Never married70.2% Now married0.0% Separated0.0% Widowed4.3% DivorcedFemales 24.0% Never married72.1% Now married0.0% Separated3.2% Widowed0.7% DivorcedWomen who gave birth in the past 12 months Now married:
100.0% (14)Unmarried:
0.0% (0)
Women who did not give birth in the past 12 months Now married:
44.0% (97)Unmarried:
56.0% (124)
Marital status - White alone, not Hispanic / Latino population 15 years and over
Males 30.6% Never married61.9% Now married0.3% Separated1.0% Widowed6.2% DivorcedFemales 24.6% Never married56.9% Now married0.3% Separated7.2% Widowed11.0% DivorcedWomen who gave birth in the past 12 months Now married:
90.4% (99)Unmarried:
9.6% (10)
Women who did not give birth in the past 12 months Now married:
42.3% (852)Unmarried:
57.7% (1,160)
Marital status - Hispanic or Latino population 15 years and over
Males 41.5% Never married47.0% Now married0.0% Separated0.0% Widowed11.6% DivorcedFemales 40.6% Never married46.4% Now married0.6% Separated4.5% Widowed8.0% DivorcedWomen who gave birth in the past 12 months Now married:
100.0% (35)Unmarried:
0.0% (0)
Women who did not give birth in the past 12 months Now married:
37.9% (209)Unmarried:
62.1% (343)
Ancestries in Damascus
1,560 17.3% English643 7.1% German619 6.9% Irish611 6.8% American368 4.1% European342 3.8% Romanian316 3.5% Italian271 3.0% Polish247 2.7% Ghanaian153 1.7% Scottish111 1.2% Eastern European95 1.1% Nigerian85 0.9% Russian66 0.7% French61 0.7% Greek61 0.7% Jamaican51 0.6% Czech42 0.5% African41 0.5% Northern European39 0.4% Scotch-Irish36 0.4% Slovene31 0.3% Egyptian25 0.3% Scandinavian25 0.3% Austrian25 0.3% Slavic23 0.3% British23 0.3% Senegalese21 0.2% Finnish19 0.2% Dutch19 0.2% Swiss16 0.2% Palestinian16 0.2% Slovak13 0.1% Ukrainian12 0.1% Zimbabwean9 0.10% Syrian9 0.10% Croatian9 0.10% French Canadian9 0.10% West Indian8 0.09% Liberian8 0.09% South African8 0.09% Armenian7 0.08% Arab7 0.08% Canadian6 0.07% Brazilian6 0.07% Cypriot
Geographical mobility in Damascus Same house 1 year ago 10,328 96.8% White (Caucasian)1,527 90.3% Black or African American762 79.1% Asian1,006 96.2% Other race1,477 93.9% Two or more races10,288 96.9% White alone, not Hispanic / Latino1,990 94.9% Hispanic or LatinoMoved within same county 300 2.8% White / Caucasian79 4.7% Black or African American156 16.2% Asian24 2.3% Other race79 5.0% Two or more races273 2.6% White alone, not Hispanic / Latino93 4.4% Hispanic or LatinoMoved within same state 63 0.6% White / Caucasian69 4.1% Black or African American16 1.0% Two or more races62 0.6% White alone, not Hispanic / Latino20 1.0% Hispanic or LatinoMoved from different state 95 0.9% White / Caucasian5 0.3% Black or African American4 0.5% Asian26 2.5% Other race100 0.9% White alone, not Hispanic / Latino17 0.8% Hispanic or LatinoMoved from abroad 45 4.7% Asian
Children Nativity (place of birth) in Damascus
Children under 6 years - Living with two parents Both parents native 516 100.0% NativeBoth parents foreign-born 153 100.0% NativeOne native, one foreign-born parent 202 100.0% NativeChildren under 6 years - Living with one parent Native parent 122 100.0% NativeChildren 6 to 17 years - Living with two parents Both parents native 1,498 100.0% Native0 0.0% Foreign-bornBoth parents foreign-born 428 85.4% Native73 14.6% Foreign-bornOne native, one foreign-born parent 122 100.0% NativeChildren 6 to 17 years - Living with one parent Native parent 311 100.0% NativeForeign-born parent 118 51.3% Native111 48.7% Foreign-born
Grandparents responsible for own grandchildren in Damascus
Grandparents (30 to 59 years) White / Caucasian 12 29.8% Responsible for grandchildren27 70.2% Not responsible for grandchildrenTwo or more races 120 100.0% Not responsible for grandchildrenWhite alone, not Hispanic / Latino 12 20.1% Responsible for grandchildren47 79.9% Not responsible for grandchildrenHispanic or Latino 15 100.0% Not responsible for grandchildrenGrandparents (60 years and over) White / Caucasian 34 32.0% Responsible for grandchildren71 68.0% Not responsible for grandchildrenTwo or more races 181 100.0% Not responsible for grandchildrenWhite alone, not Hispanic / Latino 27 23.5% Responsible for grandchildren89 76.5% Not responsible for grandchildrenHispanic or Latino 19 100.0% Not responsible for grandchildren