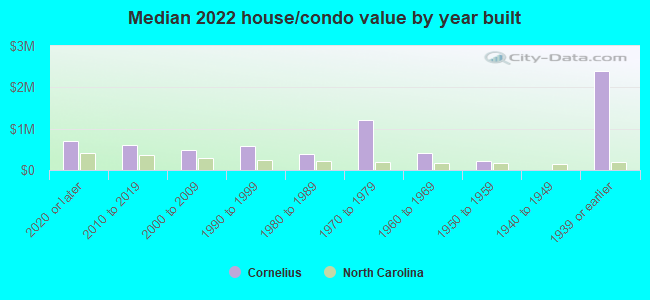
Cornelius, NC (North Carolina) Houses and Residents
| Cornelius: | $544,328 |
| North Carolina: | $280,600 |
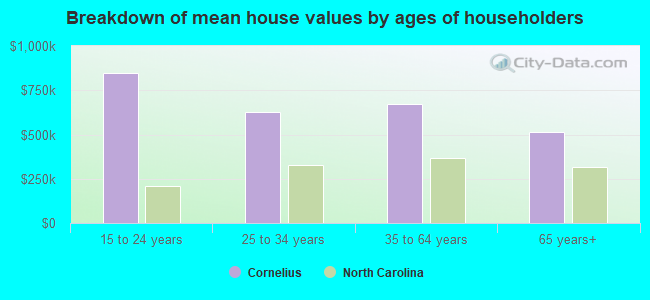
Mean price in 2022:
Detached houses: $658,132
Here: $658,132 State: $375,326 Townhouses or other attached units: $339,013
Here: $339,013 State: $317,935 In 3-to-4-unit structures: $196,313
Here: $196,313 State: $254,939 In 5-or-more-unit structures: $256,459
Here: $256,459 State: $329,290 Mobile homes: $241,908
Here: $241,908 State: $124,933
Total population: 27,481 (Urban population: 11,478, Rural population: 238 (all nonfarm))
Houses: 15,092 (14,035 occupied: 9,848 owner occupied, 4,275 renter occupied)
| % of renters here: | 30% |
| State: | 33% |
Housing density: 1,785 houses/condos per square mile
Median price asked for vacant for-sale houses and condos in 2022: $415,924.
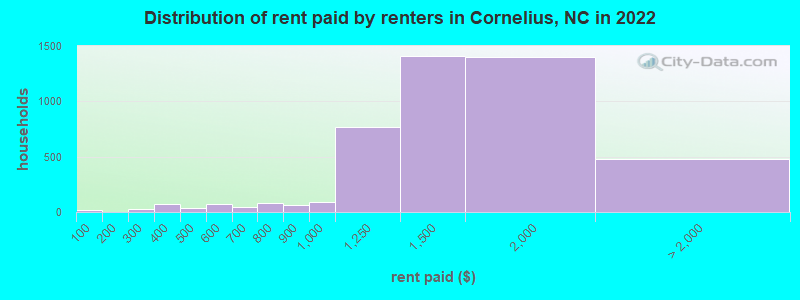
Median contract rent in 2022: $1,457 (lower quartile is $1,195, upper quartile is $1,744)
Median rent asked for vacant for-rent units in 2022: $1,387
Median gross rent in Cornelius, NC in 2022: $1,545
Housing units in Cornelius with a mortgage: 6,827 (915 second mortgage, 84 home equity loan, 834 both second mortgage and home equity loan)
Houses without a mortgage: 248
Median household income for houses/condos with a mortgage: $176,841
Median household income for apartments without a mortgage: $123,995
Median monthly housing costs: $1,651
Compare current foreclosures near Cornelius, NC:
| Photo | Address | Area | Beds / Baths | Price | Details |
|---|---|---|---|---|---|

|
#1
Henderson Rd Unit L
Cornelius, NC 28031
|
- sq. feet
|
2 baths 2 beds |
show details | |

|
#2
Kanawha Dr
Cornelius, NC 28031
|
2,552 sq. feet
|
2 baths 3 beds |
show details | |

|
#3
N Shore Cir
Cornelius, NC 28031
|
1,511 sq. feet
|
2 baths 3 beds |
show details | |

|
#4
Tryon St
Cornelius, NC 28031
|
840 sq. feet
|
1 baths 2 beds |
show details | |

|
#5
Crossing Cir
Cornelius, NC 28031
|
2,032 sq. feet
|
2 baths 3 beds |
show details | |

|
#6
Havenview Dr
Cornelius, NC 28031
|
2,490 sq. feet
|
2 baths 4 beds |
show details | |

|
#7
Peninsula Shores Dr
Cornelius, NC 28031
|
4,280 sq. feet
|
4 baths 4 beds |
show details | |

|
#8
Sherrill Ave
Cornelius, NC 28031
|
- sq. feet
|
- baths - beds |
show details | |

|
#9
Market St, Apt 1124
Cornelius, NC 28031
|
- sq. feet
|
- baths - beds |
show details | |

|
#10
Market St, Apt 2106
Cornelius, NC 28031
|
- sq. feet
|
- baths - beds |
show details |
| Photo | Address | Area | Beds / Baths | Price | Details |
|---|---|---|---|---|---|

|
#11
Walter Henderson Rd
Cornelius, NC 28031
|
- sq. feet
|
- baths - beds |
show details | |

|
#12
Jetton Rd Ste 3
Cornelius, NC 28031
|
- sq. feet
|
- baths - beds |
show details | |

|
#13
One Norman Blvd Apt A
Cornelius, NC 28031
|
- sq. feet
|
- baths - beds |
show details | |

|
#14
Inn Keepers Way
Cornelius, NC 28031
|
- sq. feet
|
- baths - beds |
show details | |

|
#15
Carrington Club Dr Apt 708
Cornelius, NC 28031
|
- sq. feet
|
- baths - beds |
show details | |

|
#16
Market St, Apt 1411
Cornelius, NC 28031
|
- sq. feet
|
- baths - beds |
show details | |

|
#17
Village Harbor Dr
Cornelius, NC 28031
|
1,200 sq. feet
|
- baths - beds |
show details | |

|
#18
Harbor View Dr
Cornelius, NC 28031
|
- sq. feet
|
- baths - beds |
show details | |

|
#19
E Mills Dr
Landis, NC 28088
|
1,131 sq. feet
|
2 baths 3 beds |
show details | |

|
#20
Valerie Dr
Charlotte, NC 28216
|
2,380 sq. feet
|
2 baths 3 beds |
show details |
| Photo | Address | Area | Beds / Baths | Price | Details |
|---|---|---|---|---|---|

|
#21
Stourbridge Lion Dr
Charlotte, NC 28213
|
1,448 sq. feet
|
2 baths 3 beds |
show details | |

|
#22
W Rice St
Landis, NC 28088
|
3,049 sq. feet
|
3 baths 4 beds |
show details | |

|
#23
Northwoods Forest Dr
Charlotte, NC 28214
|
1,614 sq. feet
|
2 baths 3 beds |
show details | |

|
#24
Old Post Rd
Denver, NC 28037
|
2,336 sq. feet
|
3 baths 3 beds |
show details | |

|
#25
Eva Dr NW
Concord, NC 28027
|
1,375 sq. feet
|
1 baths 2 beds |
show details | |

|
#26
Flower House Loop
Troutman, NC 28166
|
960 sq. feet
|
2 baths 3 beds |
show details | |

|
#27
Avalon Loop Rd
Charlotte, NC 28269
|
1,504 sq. feet
|
2 baths 2 beds |
show details | |

|
#28
Quail Hill Dr
Mooresville, NC 28115
|
1,472 sq. feet
|
2 baths 3 beds |
show details | |

|
#29
S Cloudman St
Charlotte, NC 28208
|
1,152 sq. feet
|
2 baths 4 beds |
show details | |

|
#30
Wooten St
Catawba, NC 28609
|
912 sq. feet
|
1 baths 3 beds |
show details |
| Photo | Address | Area | Beds / Baths | Price | Details |
|---|---|---|---|---|---|

|
#31
Bellamy Pl NW
Concord, NC 28027
|
2,159 sq. feet
|
2 baths 4 beds |
show details | |

|
#32
Vance Rd N
Huntersville, NC 28078
|
1,696 sq. feet
|
2 baths 3 beds |
show details | |

|
#33
Braveheart Ln
Charlotte, NC 28216
|
1,320 sq. feet
|
2 baths 3 beds |
show details | |

|
#34
Boxelder Ln
Charlotte, NC 28262
|
2,786 sq. feet
|
3 baths 5 beds |
show details | |

|
#35
Chastain Walk Dr
Charlotte, NC 28216
|
2,109 sq. feet
|
2 baths 3 beds |
show details | |

|
#36
Wild Rose Loop
Mooresville, NC 28115
|
1,161 sq. feet
|
1 baths 3 beds |
show details | |

|
#37
Dedmon Dr
Charlotte, NC 28216
|
1,025 sq. feet
|
1 baths 3 beds |
show details | |

|
#38
Valleydale Rd
Charlotte, NC 28214
|
1,511 sq. feet
|
1 baths 3 beds |
show details | |

|
#39
Grenelefe Village Rd
Charlotte, NC 28269
|
1,726 sq. feet
|
2 baths 3 beds |
show details | |

|
#40
Clairemore Pl
Charlotte, NC 28216
|
1,404 sq. feet
|
2 baths 3 beds |
show details |
| Photo | Address | Area | Beds / Baths | Price | Details |
|---|---|---|---|---|---|

|
#41
Bardot Dr
Charlotte, NC 28216
|
1,834 sq. feet
|
1 baths 3 beds |
show details | |

|
#42
Ernest Russell Ct
Charlotte, NC 28269
|
1,828 sq. feet
|
2 baths 3 beds |
show details | |

|
#43
Forest Pond Dr
Charlotte, NC 28262
|
2,158 sq. feet
|
2 baths 4 beds |
show details | |

|
#44
Arbor Ridge Rd
Mount Holly, NC 28120
|
1,656 sq. feet
|
2 baths 3 beds |
show details | |

|
#45
White Pine Ln
Charlotte, NC 28262
|
2,064 sq. feet
|
2 baths 4 beds |
show details | |

|
#46
Periwinkle Ct
Charlotte, NC 28269
|
1,688 sq. feet
|
2 baths 3 beds |
show details | |

|
#47
Pebble Stone Ct NW
Concord, NC 28027
|
1,949 sq. feet
|
2 baths 4 beds |
show details | |

|
#48
Level Creek Ln
Charlotte, NC 28214
|
1,308 sq. feet
|
2 baths 3 beds |
show details | |

|
#49
Grass Meadows Ct
Charlotte, NC 28216
|
1,350 sq. feet
|
2 baths 3 beds |
show details | |

|
Check over 1 million property listings on Foreclosure.com!
|
browse all offers | |||

Latest news about housing in Cornelius, NC collected exclusively by city-data.com from local newspapers, TV, and radio stations


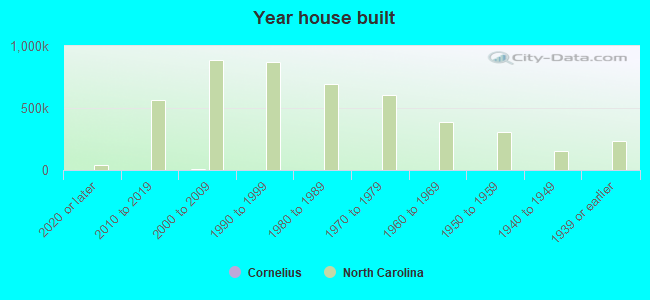
Median year apartment built: 2005
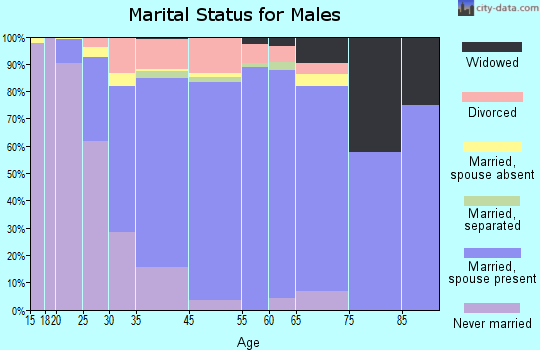
Household type by relationship:
Households: 32,240- Male householders: 6,926 (1,380 living alone), Female householders: 6,784 (2,515 living alone)
7,750 spouses (7,672 opposite-sex spouses), 651 unmarried partners, (615 opposite-sex unmarried partners), 8,855 children (8,538 natural, 189 adopted, 127 stepchildren), 319 grandchildren, 67 brothers or sisters, 184 parents, 0 foster children, 230 other relatives, 465 non-relatives
- In group quarters: 4
Size of family households: 4,732 2-persons, 1,950 3-persons, 1,497 4-persons, 558 5-persons, 216 6-persons.
Size of nonfamily households: 4,228 1-person, 794 2-persons, 21 3-persons.
5,507 married couples with children.
1,219 single-parent households (486 men, 733 women).
92.4% of residents of Cornelius speak English at home.
3.9% of residents speak Spanish at home (60% speak English very well, 16% speak English well, 13% speak English not well, 12% don't speak English at all).
3.0% of residents speak other Indo-European language at home (47% speak English very well, 10% speak English well, 39% speak English not well, 5% don't speak English at all).
0.9% of residents speak Asian or Pacific Island language at home (82% speak English very well, 18% speak English well).
0.7% of residents speak other language at home (94% speak English very well, 6% speak English not well).
Foreign born population: 2,770 (8.6%)
(45.2% of them are naturalized citizens)
| Here: | 7.6 |
| State: | 6.4 |
| Here: | 4.4 |
| State: | 4.4 |
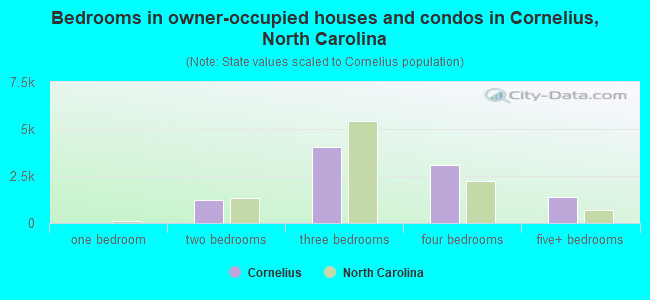
- Bedrooms in owner-occupied houses and condos in Cornelius, North Carolina
- 26no bedroom
- 141 bedroom
- 1,2472 bedrooms
- 4,0643 bedrooms
- 3,1034 bedrooms
- 1,3945+ bedrooms

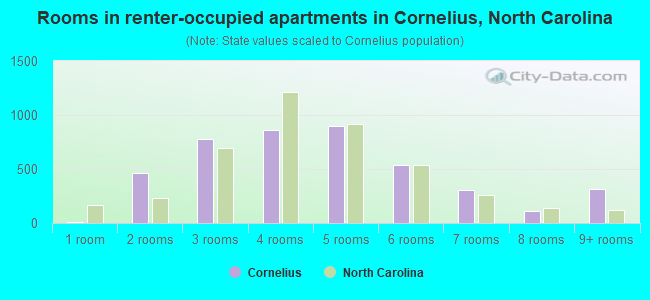
- Bedrooms in renter-occupied apartments in Cornelius, North Carolina
- 54no bedroom
- 9611 bedroom
- 1,8722 bedrooms
- 1,0003 bedrooms
- 2574 bedrooms
- 1325+ bedrooms
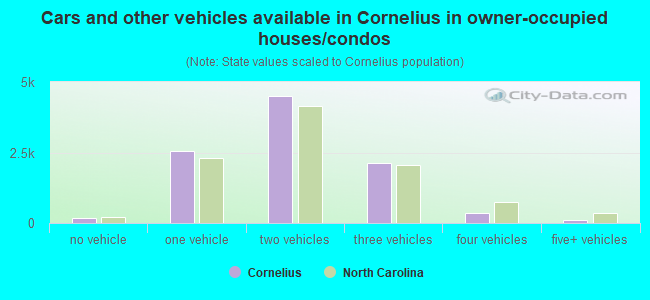
- Cars and other vehicles available in Cornelius in owner-occupied houses/condos
- 193no vehicle
- 2,5391 vehicle
- 4,5152 vehicles
- 2,1393 vehicles
- 3714 vehicles
- 925+ vehicles
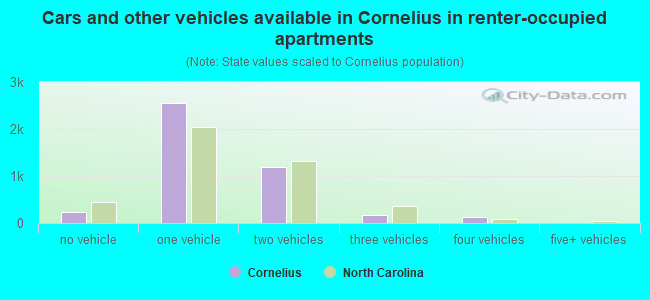
- Cars and other vehicles available in Cornelius in renter-occupied apartments
- 238no vehicle
- 2,5601 vehicle
- 1,1902 vehicles
- 1643 vehicles
- 1244 vehicles
- 05+ vehicles
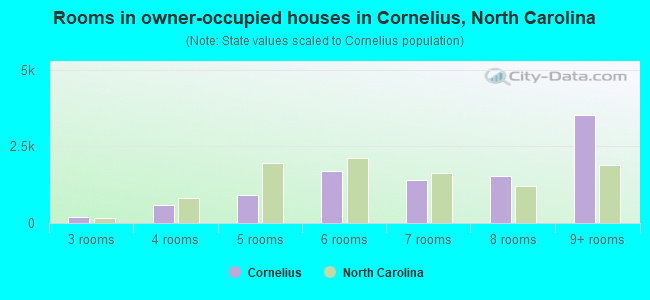
- Rooms in owner-occupied houses in Cornelius, North Carolina
- 261 room
- 02 rooms
- 1853 rooms
- 5784 rooms
- 8995 rooms
- 1,6926 rooms
- 1,4157 rooms
- 1,5288 rooms
- 3,5269+ rooms
- Rooms in renter-occupied apartments in Cornelius, North Carolina
- 131 room
- 4612 rooms
- 7783 rooms
- 8584 rooms
- 8955 rooms
- 5366 rooms
- 3037 rooms
- 1158 rooms
- 3179+ rooms
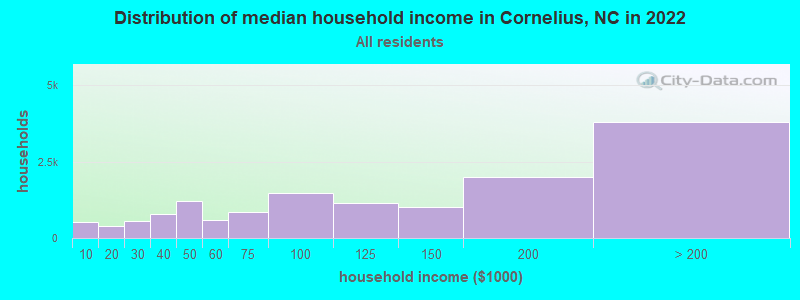
Cornelius, NC household income distribution

- 511Less than $10,000
- 390$10,000 to $19,999
- 549$20,000 to $29,999
- 782$30,000 to $39,999
- 1,223$40,000 to $49,999
- 586$50,000 to $59,999
- 853$60,000 to $74,999
- 1,473$75,000 to $99,999
- 1,156$100,000 to $124,999
- 1,011$125,000 to $149,999
- 1,985$150,000 to $199,999
- 3,793$200,000 or more
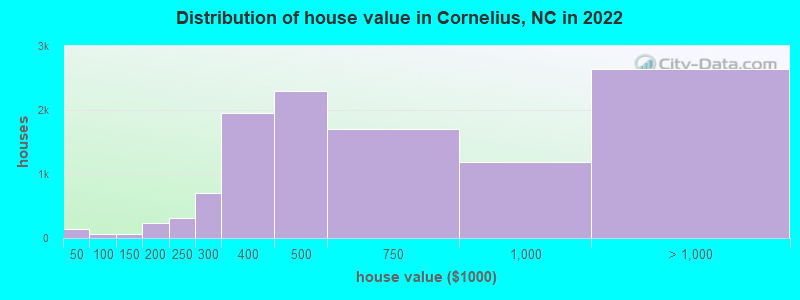
Home value of owner - occupied houses in 2022 in Cornelius, NC
-
- 73Less than $10,000
- 20$20,000 to $24,999
- 15$25,000 to $29,999
- 32$40,000 to $49,999
- 4$60,000 to $69,999
- 23$70,000 to $79,999
- 60$100,000 to $124,999
- 4$125,000 to $149,999
- 141$150,000 to $174,999
- 97$175,000 to $199,999
- 314$200,000 to $249,999
- 702$250,000 to $299,999
- 1,951$300,000 to $399,999
- 2,291$400,000 to $499,999
- 1,703$500,000 to $749,999
- 1,190$750,000 to $999,999
- 897$1,000,000 to $1,499,999
- 563$1,500,000 to $1,999,999
- 1,179$2,000,000 or more
Rent paid by renters in 2022 in Cornelius, NC
-
- 15Less than $100
- 26$200 to $249
- 74$300 to $349
- 32$400 to $449
- 58$500 to $549
- 17$550 to $599
- 23$600 to $649
- 18$650 to $699
- 42$700 to $749
- 39$750 to $799
- 60$800 to $899
- 90$900 to $999
- 767$1,000 to $1,249
- 1,406$1,250 to $1,499
- 1,402$1,500 to $1,999
- 180$2,000 to $2,499
- 64$2,500 to $2,999
- 13$3,000 to $3,499
- 218No cash rent
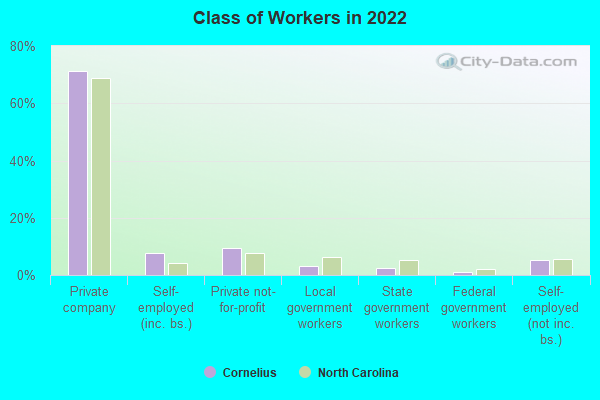
Percentage of workers working in this county: 84.2%
Number of people working at home: 5,442 (32.6% of all workers)
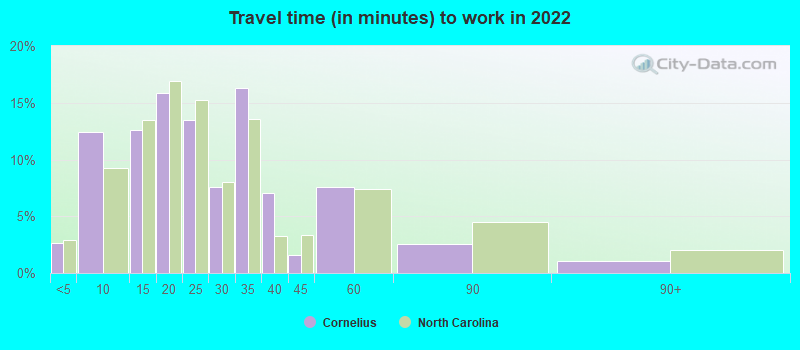
Travel time to work (commute)
- Less than 5 minutes: 280
- 5 to 9 minutes: 1,474
- 10 to 14 minutes: 1,625
- 15 to 19 minutes: 1,572
- 20 to 24 minutes: 1,370
- 25 to 29 minutes: 955
- 30 to 34 minutes: 1,582
- 35 to 39 minutes: 326
- 40 to 44 minutes: 448
- 45 to 59 minutes: 951
- 60 to 89 minutes: 569
- 90 or more minutes: 106
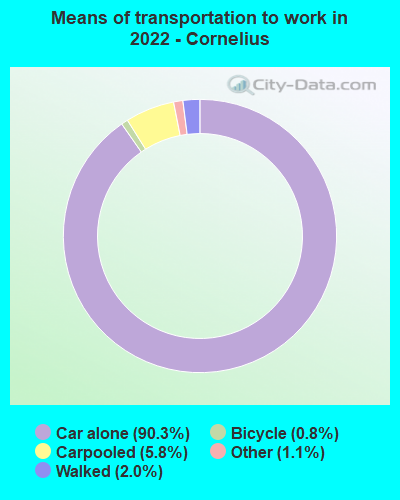
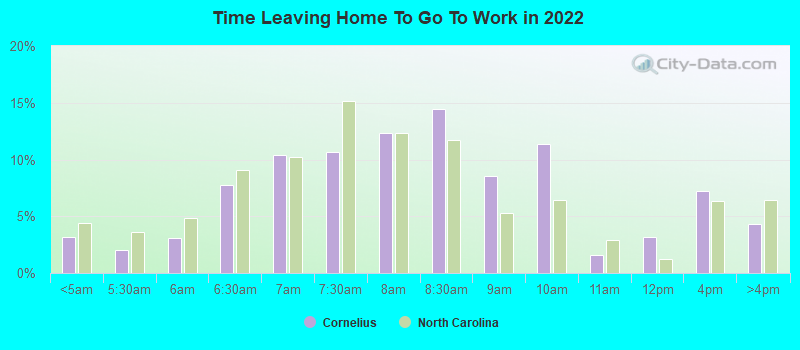
Means of transportation to work:
- Drove a car alone: 8,288 (59.7%)
- Carpooled: 573 (4.1%)
- Taxi: 88 (0.6%)
- Bicycle: 100 (0.7%)
- Walked: 180 (1.3%)
- Worked at home: 5,442 (39.2%)
- Unemployment by race in 2022
- Unemployment rate for White non-Hispanic residents
- 0.9%Males
- 3.3%Females
- Unemployment rate for Black residents
- 3.4%Males
- 3.0%Females
- Unemployment rate for other race residents
- 14.7%Females
- Unemployment rate for two or more race residents
- 5.5%Males
- 2.1%Females
- Unemployment rate for Hispanic or Latino residents
- 8.8%Females

- Year of entry for the foreign-born population in Cornelius, North Carolina
- 1,3282010 or later
- 5072000 to 2009
- 3651990 to 1999
- 681980 to 1989
- 931970 to 1979
- 96Before 1970
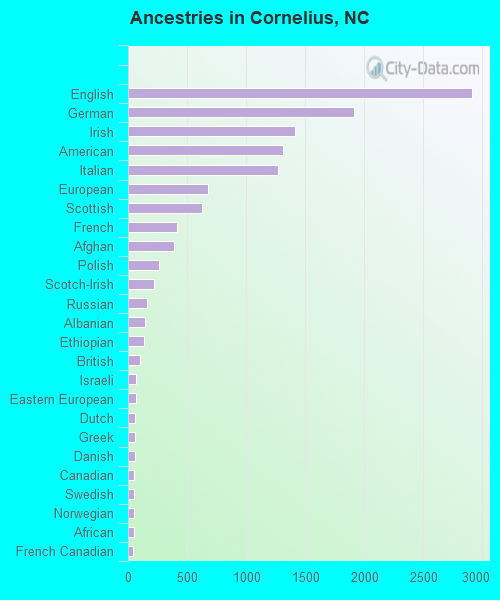
First ancestries reported:
- English: 2,913 (18.2%)
- German: 1,913 (12.0%)
- Irish: 1,418 (8.9%)
- American: 1,310 (8.2%)
- Italian: 1,269 (7.9%)
- European: 681 (4.3%)
- Scottish: 625 (3.9%)
- French: 413 (2.6%)
- Afghan: 393 (2.5%)
- Polish: 259 (1.6%)
- Scotch-Irish: 219 (1.4%)
- Russian: 165 (1.0%)
- Albanian: 140 (0.9%)
- Ethiopian: 139 (0.9%)
- British: 98 (0.6%)
- Israeli: 71 (0.4%)
- Eastern European: 64 (0.4%)
- Dutch: 62 (0.4%)
- Greek: 62 (0.4%)
- Danish: 61 (0.4%)
- Canadian: 53 (0.3%)
- Swedish: 52 (0.3%)
- Norwegian: 50 (0.3%)
- African: 49 (0.3%)
- French Canadian: 44 (0.3%)
- Northern European: 42 (0.3%)
- Romanian: 39 (0.2%)
- Armenian: 35 (0.2%)
- Slovak: 32 (0.2%)
- Ukrainian: 30 (0.2%)
- Palestinian: 27 (0.2%)
- Czech: 27 (0.2%)
- Lebanese: 26 (0.2%)
- Macedonian: 25 (0.2%)
- Croatian: 23 (0.1%)
- Yugoslavian: 22 (0.1%)
- Czechoslovakian: 19 (0.1%)
- Scandinavian: 19 (0.1%)
- Turkish: 18 (0.1%)
- Finnish: 17 (0.1%)
- Arab: 15 (0.09%)
- Austrian: 15 (0.09%)
- Portuguese: 14 (0.09%)
- South African: 12 (0.08%)
- Hungarian: 10 (0.06%)
- Welsh: 6 (0.04%)
- Serbian: 3 (0.02%)
Most common places of birth for foreign-born residents (%):
| Cornelius: | 15.5% (449) |
| North Carolina: | 0.2% (1,745) |
| Cornelius: | 8.2% (238) |
| North Carolina: | 9.3% (80,594) |
| Cornelius: | 7.7% (224) |
| North Carolina: | 24.7% (214,776) |
| Cornelius: | 6.1% (177) |
| North Carolina: | 2.6% (22,964) |
| Cornelius: | 6.0% (173) |
| North Carolina: | 2.1% (18,105) |
| Cornelius: | 4.8% (139) |
| North Carolina: | 1.1% (9,831) |
| Cornelius: | 4.5% (129) |
| North Carolina: | 1.2% (10,140) |
| Cornelius: | 4.3% (126) |
| North Carolina: | 2.1% (18,275) |
| Cornelius: | 4.2% (122) |
| North Carolina: | 0.9% (8,067) |
| Cornelius: | 3.6% (103) |
| North Carolina: | 0.3% (2,183) |
| Cornelius: | 3.3% (97) |
| North Carolina: | 0.2% (1,928) |
| Cornelius: | 3.1% (91) |
| North Carolina: | 0.4% (3,292) |
| Cornelius: | 2.5% (72) |
| North Carolina: | 0.1% (903) |
| Cornelius: | 2.3% (66) |
| North Carolina: | 0.2% (1,461) |
| Cornelius: | 2.3% (66) |
| North Carolina: | 0.5% (4,296) |
| Cornelius: | 2.2% (65) |
| North Carolina: | 0.1% (994) |
| Cornelius: | 2.1% (62) |
| North Carolina: | 0.9% (7,765) |
| Cornelius: | 2.1% (62) |
| North Carolina: | 1.8% (15,534) |
| Cornelius: | 1.8% (52) |
| North Carolina: | 2.4% (20,695) |
Place of birth for U.S.-born residents:
- This state: 9,845
- Other state: 19,394
- Northeast: 6,807
- Midwest: 4,675
- South: 6,084
- West: 1,780
85.2% of Cornelius residents lived in the same house 1 years ago.
Out of people who lived in different houses, 32.5% lived in this county.
Out of people who lived in different counties, 34.7% lived in North Carolina.
| Cornelius: | 85.2% |
| State average: | 87.3% |
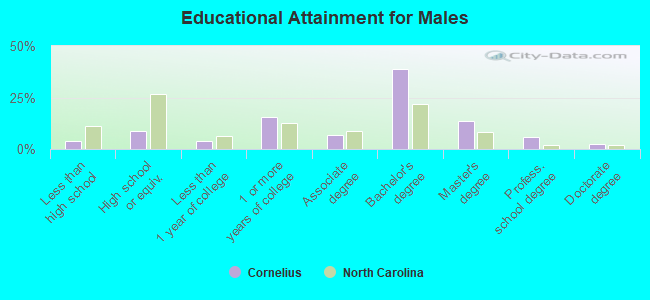
Education attainment for males 25 years and older:
- No schooling: 179
- Nursery to 4th grade: 34
- 5th and 6th grade: 0
- 7th and 8th grade: 10
- 9th grade: 0
- 10th grade: 152
- 11th grade: 12
- 12th grade, no diploma: 43
- High school graduate (or equivalency): 958
- Less than 1 year of college: 421
- Some college more than 1 year, no degree: 1,665
- Associate degree: 760
- Bachelor's degree: 4,240
- Master's degree: 1,498
- Professional school degree: 630
- Doctorate degree: 266
Education attainment for females 25 years and older:
- No schooling: 68
- Nursery to 4th grade: 22
- 5th and 6th grade: 14
- 7th and 8th grade: 0
- 9th grade: 6
- 10th grade: 0
- 11th grade: 9
- 12th grade, no diploma: 35
- High school graduate (or equivalency): 1,443
- Less than 1 year of college: 591
- Some college more than 1 year, no degree: 1,427
- Associate degree: 1,381
- Bachelor's degree: 5,242
- Master's degree: 1,932
- Professional school degree: 185
- Doctorate degree: 219

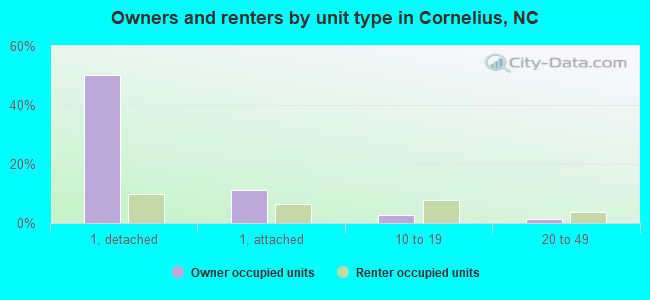
Housing units in structures:
- One, detached: 9,223
- One, attached: 1,249
- Two: 200
- 3 or 4: 396
- 5 to 9: 594
- 10 to 19: 1,527
- 20 to 49: 908
- 50 or more: 872
- Mobile homes: 119
Housing units lacking complete kitchen facilities in 2022: 0.4%
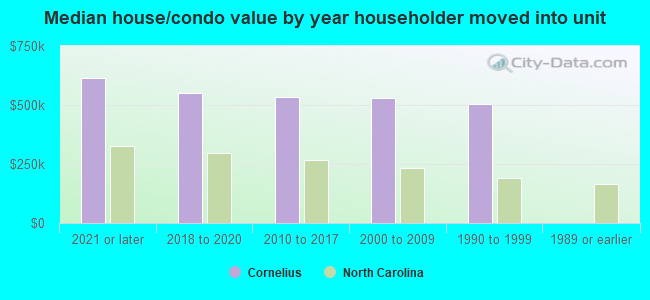
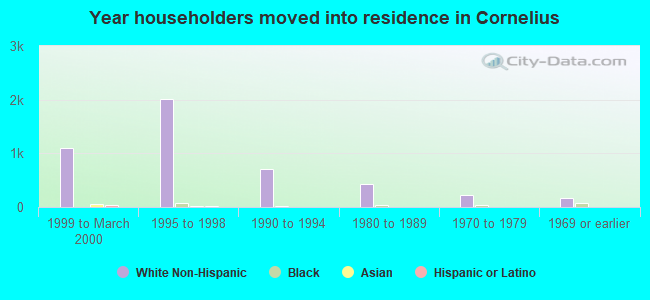
House/condo owner moved in on average 6 years ago
Renter moved in on average 1 years ago
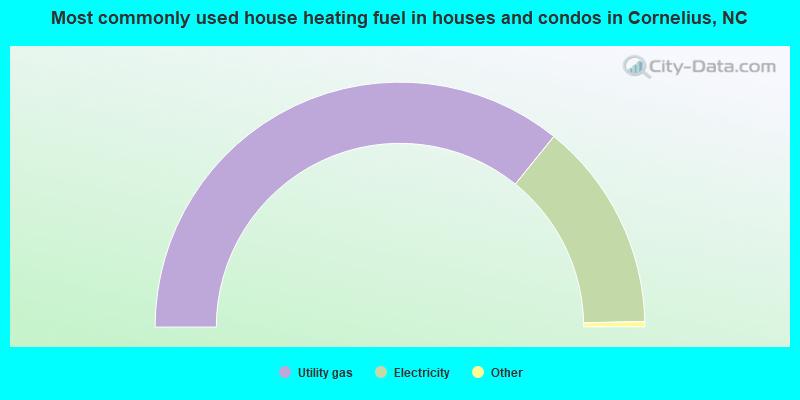
- 71.7%Utility gas
- 27.7%Electricity
- 0.5%Bottled, tank, or LP gas
- 0.2%Other fuel
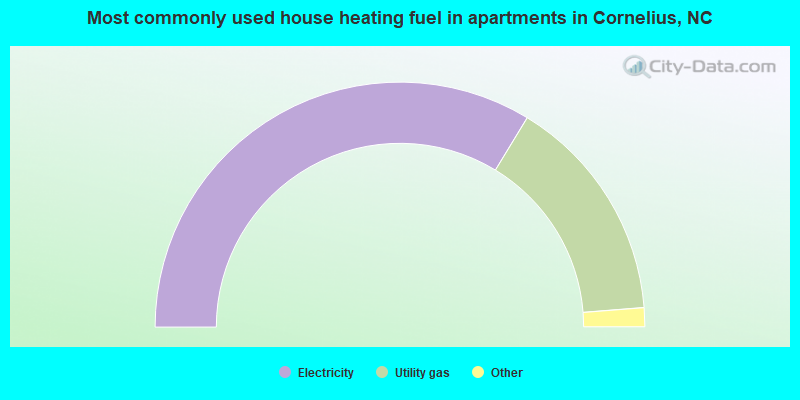
- 67.4%Electricity
- 30.1%Utility gas
- 2.2%No fuel used
- 0.3%Bottled, tank, or LP gas
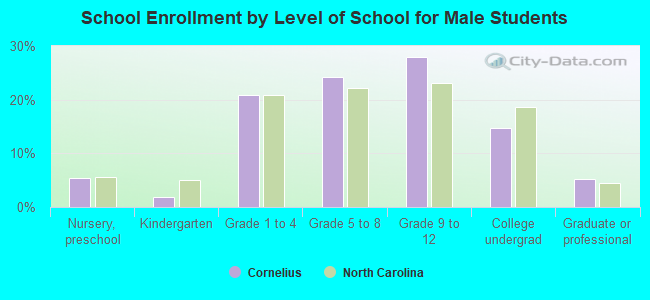
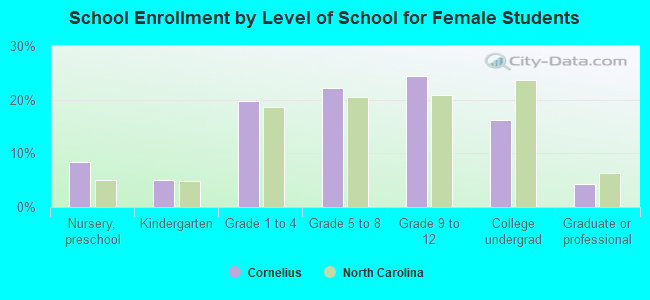
Private vs. public school enrollment:
| Here: | 16.0% |
| North Carolina: | 13.8% |
| Here: | 16.3% |
| North Carolina: | 11.9% |
| Here: | 18.1% |
| North Carolina: | 19.3% |