Races in Cornelius, North Carolina (NC) Detailed Stats
Data:
Races - White alone (%)
Races - White alone (% change since 2000)
Races - Black alone (%)
Races - Black alone (% change since 2000)
Races - American Indian alone (%)
Races - American Indian alone (% change since 2000)
Races - Asian alone (%)
Races - Asian alone (% change since 2000)
Races - Hispanic (%)
Races - Hispanic (% change since 2000)
Races - Native Hawaiian and Other Pacific Islander alone (%)
Races - Native Hawaiian and Other Pacific Islander alone (% change since 2000)
Races - Two or more races(%)
Races - Two or more races(% change since 2000)
Races - Other race alone (%)
Races - Other race alone (% change since 2000)
Racial diversity
Place of birth - Born in state of residence (%)
Place of birth - Born in state of residence (%) - White
Place of birth - Born in state of residence (%) - Black or African American
Place of birth - Born in state of residence (%) - Asian
Place of birth - Born in state of residence (%) - Hispanic or Latino
Place of birth - Born in state of residence (%) - American Indian and Alaska Native
Place of birth - Born in state of residence (%) - Multirace
Place of birth - Born in state of residence (%) - Other Race
Place of birth - Born in other state (%)
Place of birth - Born in other state (%) - White
Place of birth - Born in other state (%) - Black or African American
Place of birth - Born in other state (%) - Asian
Place of birth - Born in other state (%) - Hispanic or Latino
Place of birth - Born in other state (%) - American Indian and Alaska Native
Place of birth - Born in other state (%) - Multirace
Place of birth - Born in other state (%) - Other Race
Place of birth - Native, outside of US (%)
Place of birth - Native, outside of US (%) - White
Place of birth - Native, outside of US (%) - Black or African American
Place of birth - Native, outside of US (%) - Asian
Place of birth - Native, outside of US (%) - Hispanic or Latino
Place of birth - Native, outside of US (%) - American Indian and Alaska Native
Place of birth - Native, outside of US (%) - Multirace
Place of birth - Native, outside of US (%) - Other Race
Place of birth - Foreign born (%)
Place of birth - Foreign born (%) - White
Place of birth - Foreign born (%) - Black or African American
Place of birth - Foreign born (%) - Asian
Place of birth - Foreign born (%) - Hispanic or Latino
Place of birth - Foreign born (%) - American Indian and Alaska Native
Place of birth - Foreign born (%) - Multirace
Place of birth - Foreign born (%) - Other Race
Residents speaking English at home (%)
Residents speaking English at home - Born in the United States (%)
Residents speaking English at home - Native, born elsewhere (%)
Residents speaking English at home - Foreign born (%)
Residents speaking Spanish at home (%)
Residents speaking Spanish at home - Born in the United States (%)
Residents speaking Spanish at home - Native, born elsewhere (%)
Residents speaking Spanish at home - Foreign born (%)
Residents speaking other language at home (%)
Residents speaking other language at home - Born in the United States (%)
Residents speaking other language at home - Native, born elsewhere (%)
Residents speaking other language at home - Foreign born (%)
Marital status - Never married (%)
Marital status - Now married (%)
Marital status - Separated (%)
Marital status - Widowed (%)
Marital status - Divorced (%)
Ancestries Reported - Arab (%)
Ancestries Reported - Czech (%)
Ancestries Reported - Danish (%)
Ancestries Reported - Dutch (%)
Ancestries Reported - English (%)
Ancestries Reported - French (%)
Ancestries Reported - French Canadian (%)
Ancestries Reported - German (%)
Ancestries Reported - Greek (%)
Ancestries Reported - Hungarian (%)
Ancestries Reported - Irish (%)
Ancestries Reported - Italian (%)
Ancestries Reported - Lithuanian (%)
Ancestries Reported - Norwegian (%)
Ancestries Reported - Polish (%)
Ancestries Reported - Portuguese (%)
Ancestries Reported - Russian (%)
Ancestries Reported - Scotch-Irish (%)
Ancestries Reported - Scottish (%)
Ancestries Reported - Slovak (%)
Ancestries Reported - Subsaharan African (%)
Ancestries Reported - Swedish (%)
Ancestries Reported - Swiss (%)
Ancestries Reported - Ukrainian (%)
Ancestries Reported - United States (%)
Ancestries Reported - Welsh (%)
Ancestries Reported - West Indian (%)
Ancestries Reported - Other (%)
Geographical mobility - Same house 1 year ago (%)
Geographical mobility - Same house 1 year ago (%) - White
Geographical mobility - Same house 1 year ago (%) - Black or African American
Geographical mobility - Same house 1 year ago (%) - Asian
Geographical mobility - Same house 1 year ago (%) - Hispanic or Latino
Geographical mobility - Same house 1 year ago (%) - American Indian and Alaska Native
Geographical mobility - Same house 1 year ago (%) - Multirace
Geographical mobility - Same house 1 year ago (%) - Other Race
Geographical mobility - Moved within same county (%)
Geographical mobility - Moved within same county (%) - White
Geographical mobility - Moved within same county (%) - Black or African American
Geographical mobility - Moved within same county (%) - Asian
Geographical mobility - Moved within same county (%) - Hispanic or Latino
Geographical mobility - Moved within same county (%) - American Indian and Alaska Native
Geographical mobility - Moved within same county (%) - Multirace
Geographical mobility - Moved within same county (%) - Other Race
Geographical mobility - Moved from different county within same state (%)
Geographical mobility - Moved from different county within same state (%) - White
Geographical mobility - Moved from different county within same state (%) - Black or African American
Geographical mobility - Moved from different county within same state (%) - Asian
Geographical mobility - Moved from different county within same state (%) - Hispanic or Latino
Geographical mobility - Moved from different county within same state (%) - American Indian and Alaska Native
Geographical mobility - Moved from different county within same state (%) - Multirace
Geographical mobility - Moved from different county within same state (%) - Other Race
Geographical mobility - Moved from different state (%)
Geographical mobility - Moved from different state (%) - White
Geographical mobility - Moved from different state (%) - Black or African American
Geographical mobility - Moved from different state (%) - Asian
Geographical mobility - Moved from different state (%) - Hispanic or Latino
Geographical mobility - Moved from different state (%) - American Indian and Alaska Native
Geographical mobility - Moved from different state (%) - Multirace
Geographical mobility - Moved from different state (%) - Other Race
Geographical mobility - Moved from abroad (%)
Geographical mobility - Moved from abroad (%) - White
Geographical mobility - Moved from abroad (%) - Black or African American
Geographical mobility - Moved from abroad (%) - Asian
Geographical mobility - Moved from abroad (%) - Hispanic or Latino
Geographical mobility - Moved from abroad (%) - American Indian and Alaska Native
Geographical mobility - Moved from abroad (%) - Multirace
Geographical mobility - Moved from abroad (%) - Other Race
Place of birth for the foreign-born population - Ireland (%)
Place of birth for the foreign-born population - Denmark (%)
Place of birth for the foreign-born population - Norway (%)
Place of birth for the foreign-born population - Sweden (%)
Place of birth for the foreign-born population - United Kingdom (%)
Place of birth for the foreign-born population - England (%)
Place of birth for the foreign-born population - Scotland (%)
Place of birth for the foreign-born population - Other Northern Europe (%)
Place of birth for the foreign-born population - Austria (%)
Place of birth for the foreign-born population - Belgium (%)
Place of birth for the foreign-born population - France (%)
Place of birth for the foreign-born population - Germany (%)
Place of birth for the foreign-born population - Netherlands (%)
Place of birth for the foreign-born population - Switzerland (%)
Place of birth for the foreign-born population - Other Western Europe (%)
Place of birth for the foreign-born population - Greece (%)
Place of birth for the foreign-born population - Italy (%)
Place of birth for the foreign-born population - Portugal (%)
Place of birth for the foreign-born population - Spain (%)
Place of birth for the foreign-born population - Other Southern Europe (%)
Place of birth for the foreign-born population - Albania (%)
Place of birth for the foreign-born population - Belarus (%)
Place of birth for the foreign-born population - Bosnia and Herzegovina (%)
Place of birth for the foreign-born population - Bulgaria (%)
Place of birth for the foreign-born population - Croatia (%)
Place of birth for the foreign-born population - Czechoslovakia (%)
Place of birth for the foreign-born population - Hungary (%)
Place of birth for the foreign-born population - Latvia (%)
Place of birth for the foreign-born population - Lithuania (%)
Place of birth for the foreign-born population - North Macedonia (Macedonia) (%)
Place of birth for the foreign-born population - Moldova (%)
Place of birth for the foreign-born population - Poland (%)
Place of birth for the foreign-born population - Romania (%)
Place of birth for the foreign-born population - Russia (%)
Place of birth for the foreign-born population - Serbia (%)
Place of birth for the foreign-born population - Ukraine (%)
Place of birth for the foreign-born population - Other Eastern Europe (%)
Place of birth for the foreign-born population - China (%)
Place of birth for the foreign-born population - Hong Kong (%)
Place of birth for the foreign-born population - Taiwan (%)
Place of birth for the foreign-born population - Japan (%)
Place of birth for the foreign-born population - Korea (%)
Place of birth for the foreign-born population - Other Eastern Asia (%)
Place of birth for the foreign-born population - Afghanistan (%)
Place of birth for the foreign-born population - Bangladesh (%)
Place of birth for the foreign-born population - India (%)
Place of birth for the foreign-born population - Iran (%)
Place of birth for the foreign-born population - Kazakhstan (%)
Place of birth for the foreign-born population - Nepal (%)
Place of birth for the foreign-born population - Pakistan (%)
Place of birth for the foreign-born population - Sri Lanka (%)
Place of birth for the foreign-born population - Uzbekistan (%)
Place of birth for the foreign-born population - Other South Central Asia (%)
Place of birth for the foreign-born population - Burma (%)
Place of birth for the foreign-born population - Cambodia (%)
Place of birth for the foreign-born population - Indonesia (%)
Place of birth for the foreign-born population - Laos (%)
Place of birth for the foreign-born population - Malaysia (%)
Place of birth for the foreign-born population - Philippines (%)
Place of birth for the foreign-born population - Singapore (%)
Place of birth for the foreign-born population - Thailand (%)
Place of birth for the foreign-born population - Vietnam (%)
Place of birth for the foreign-born population - Other South Eastern Asia (%)
Place of birth for the foreign-born population - Armenia (%)
Place of birth for the foreign-born population - Iraq (%)
Place of birth for the foreign-born population - Israel (%)
Place of birth for the foreign-born population - Jordan (%)
Place of birth for the foreign-born population - Kuwait (%)
Place of birth for the foreign-born population - Lebanon (%)
Place of birth for the foreign-born population - Saudi Arabia (%)
Place of birth for the foreign-born population - Syria (%)
Place of birth for the foreign-born population - Turkey (%)
Place of birth for the foreign-born population - Yemen (%)
Place of birth for the foreign-born population - Other Western Asia (%)
Place of birth for the foreign-born population - Eritrea (%)
Place of birth for the foreign-born population - Ethiopia (%)
Place of birth for the foreign-born population - Kenya (%)
Place of birth for the foreign-born population - Somalia (%)
Place of birth for the foreign-born population - Uganda (%)
Place of birth for the foreign-born population - Zimbabwe (%)
Place of birth for the foreign-born population - Other Eastern Africa (%)
Place of birth for the foreign-born population - Cameroon (%)
Place of birth for the foreign-born population - Congo (%)
Place of birth for the foreign-born population - Democratic Republic of Congo (Zaire) (%)
Place of birth for the foreign-born population - Other Middle Africa (%)
Place of birth for the foreign-born population - Egypt (%)
Place of birth for the foreign-born population - Morocco (%)
Place of birth for the foreign-born population - Sudan (%)
Place of birth for the foreign-born population - Other Northern Africa (%)
Place of birth for the foreign-born population - South Africa (%)
Place of birth for the foreign-born population - Other Southern Africa (%)
Place of birth for the foreign-born population - Cabo Verde (%)
Place of birth for the foreign-born population - Ghana (%)
Place of birth for the foreign-born population - Liberia (%)
Place of birth for the foreign-born population - Nigeria (%)
Place of birth for the foreign-born population - Senegal (%)
Place of birth for the foreign-born population - Sierra Leone (%)
Place of birth for the foreign-born population - Other Western Africa (%)
Place of birth for the foreign-born population - Australia (%)
Place of birth for the foreign-born population - New Zealand (%)
Place of birth for the foreign-born population - Fiji (%)
Place of birth for the foreign-born population - Micronesia (%)
Place of birth for the foreign-born population - Bahamas (%)
Place of birth for the foreign-born population - Barbados (%)
Place of birth for the foreign-born population - Cuba (%)
Place of birth for the foreign-born population - Dominica (%)
Place of birth for the foreign-born population - Dominican Republic (%)
Place of birth for the foreign-born population - Grenada (%)
Place of birth for the foreign-born population - Haiti (%)
Place of birth for the foreign-born population - Jamaica (%)
Place of birth for the foreign-born population - St. Vincent and the Grenadines (%)
Place of birth for the foreign-born population - Trinidad and Tobago (%)
Place of birth for the foreign-born population - West Indies (%)
Place of birth for the foreign-born population - Other Caribbean (%)
Place of birth for the foreign-born population - Belize (%)
Place of birth for the foreign-born population - Costa Rica (%)
Place of birth for the foreign-born population - El Salvador (%)
Place of birth for the foreign-born population - Guatemala (%)
Place of birth for the foreign-born population - Honduras (%)
Place of birth for the foreign-born population - Mexico (%)
Place of birth for the foreign-born population - Nicaragua (%)
Place of birth for the foreign-born population - Panama (%)
Place of birth for the foreign-born population - Other Central America (%)
Place of birth for the foreign-born population - Argentina (%)
Place of birth for the foreign-born population - Bolivia (%)
Place of birth for the foreign-born population - Brazil (%)
Place of birth for the foreign-born population - Chile (%)
Place of birth for the foreign-born population - Colombia (%)
Place of birth for the foreign-born population - Ecuador (%)
Place of birth for the foreign-born population - Guyana (%)
Place of birth for the foreign-born population - Peru (%)
Place of birth for the foreign-born population - Uruguay (%)
Place of birth for the foreign-born population - Venezuela (%)
Place of birth for the foreign-born population - Other South America (%)
Place of birth for the foreign-born population - Canada (%)
Place of birth for the foreign-born population - Other Northern America (%)
Place of birth for the foreign-born population - Other (%)
Latest news about races in Cornelius, NC collected exclusively by city-data.com from local newspapers, TV, and radio stations
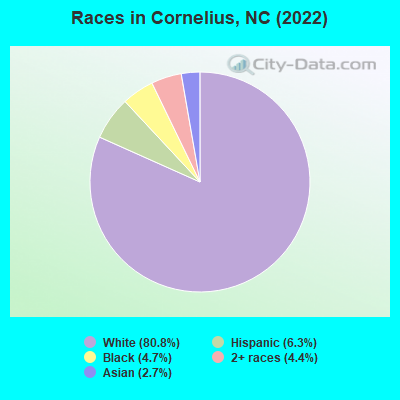
According to 2022 data, the most numerous races in Cornelius, NC are White alone (26,061 residents), Black alone (1,520 residents), and Hispanic (2,017 residents). 92.2% of Cornelius residents speak English at home. 9.0% of Cornelius, NC residents are foreign-born (2.8% born in Asia, 2.5% born in Latin America, 2.4% born in Europe), which is 11.0% greater than the foreign-born rate of 8.0% across the entire state of North Carolina.
Race distribution in Cornelius
2000 2022
5,647,155 70.2% White alone 1,723,301 21.4% Black alone 378,963 4.7% Hispanic 112,416 1.4% Asian alone 95,333 1.2% American Indian alone 79,965 1.0% Two or more races 9,015 0.1% Other race alone 3,165 0.04% Native Hawaiian and Other
6,497,519 60.7% White alone 2,155,650 20.1% Black alone 1,114,799 10.4% Hispanic 438,061 4.1% Two or more races 341,052 3.2% Asian alone 91,758 0.9% American Indian alone 50,180 0.5% Other race alone 9,954 0.09% Native Hawaiian and Other
Income and house value in Cornelius Median household income in 2022 $127,049 White non-Hispanic householders$49,266 Black householders$75,719 Asian householders$34,872 Some other race householders$49,323 Two or more races householders$47,003 Hispanic or Latino race householdersMedian 2022 house value $603,221 White Non-Hispanic householders$323,789 Black or African American householdersover $1,000,000 American Indian or Alaska Native householders over $1,000,000 Asian householders$238,080 Some other race householders$247,603 Hispanic or Latino householders
Median age by race in Cornelius
47.0 Median age for White residents46.2 47.2 32.6 Median age for Black or African American residents32.6 38.9 13.9 Median age for American Indian / Alaska Native residents-596,273,291.3 16.7 38.5 Median age for Asian residents38.3 32.6 -865,497,075.2 Median age for Native Hawaiian / Pacific Islander residents-706,616,728.4 -668,458,780.7 51.4 Median age for Other race residents37.7 53.1 24.4 Median age for Two or more races residents28.2 24.0 47.0 Median age for White alone residents46.7 47.2 28.9 Median age for Hispanic or Latino residents23.4 35.6
Owner/renter occupied households by race in Cornelius
House owners and renters - White residents 8,619 73.0% Owner occupied3,180 27.0% Renter occupiedHouse owners and renters - Black or African American residents 192 27.0% Owner occupied518 73.0% Renter occupiedHouse owners and renters - American Indian / Alaska Native residents 52 100.0% Renter occupiedHouse owners and renters - Asian residents 207 69.0% Owner occupied93 31.0% Renter occupiedHouse owners and renters - Other race residents 59 34.6% Owner occupied112 65.4% Renter occupiedHouse owners and renters - Two or more races residents 428 69.4% Owner occupied188 30.6% Renter occupiedHouse owners and renters - White alone residents 8,685 73.4% Owner occupied3,148 26.6% Renter occupiedHouse owners and renters - Hispanic or Latino residents 270 39.1% Owner occupied421 60.9% Renter occupied
Language usage in Cornelius
English speakers - Total 92.2% of residents of Cornelius speak English at home.
3.9% of residents speak Spanish at home 697 57.8% Speak English very well509 42.2% Speak English less than very well4.0% of residents speak other language at home 854 68.6% Speak English very well391 31.4% Speak English less than very well
English speakers - Born in the United States 97.8% of residents of Cornelius speak English at home.
1.3% of residents speak Spanish at home 244 94.6% Speak English very well14 5.4% Speak English less than very well0.8% of residents speak other language at home 141 91.6% Speak English very well13 8.4% Speak English less than very well
English speakers - Native, born elsewhere 81.1% of residents of Cornelius speak English at home.
17.2% of residents speak Spanish at home 38 40.0% Speak English very well57 60.0% Speak English less than very well2.9% of residents speak other language at home 16 100.0% Speak English very well
English speakers - Foreign-born 35.3% of residents of Cornelius speak English at home.
27.5% of residents speak Spanish at home 332 44.8% Speak English very well409 55.2% Speak English less than very well37.2% of residents speak other language at home 621 62.0% Speak English very well380 38.0% Speak English less than very well
White (Caucasian) - Speak only English Native:
99.6% (24,225)Foreign-born:
68.9% (629)
White (Caucasian) - Speak another language Native:
1.2% (287)Foreign-born:
41.0% (374)
Black or African American - Speak another language Native:
4.9% (66)Foreign-born:
90.9% (82)
Asian - Speak only English Native:
83.4% (125)Foreign-born:
11.2% (72)
Asian - Speak another language Native:
14.4% (22)Foreign-born:
88.7% (573)
Other race - Speak another language Native:
47.2% (61)Foreign-born:
100.0% (222)
Two or more races - Speak only English Native:
88.3% (1,666)Foreign-born:
48.5% (143)
Two or more races - Speak another language Native:
10.6% (201)Foreign-born:
52.4% (155)
White alone - Speak only English Native:
98.8% (24,003)Foreign-born:
60.3% (640)
White alone - Speak another language Native:
0.9% (227)Foreign-born:
34.8% (369)
Hispanic or Latino - Speak only English Native:
78.3% (849)Foreign-born:
5.2% (39)
Hispanic or Latino - Speak another language Native:
32.2% (349)Foreign-born:
94.7% (712)
Foreign-born residents in Cornelius 2,898 residents are foreign born (2.8% Asia , 2.5% Latin America , 2.4% Europe ).
This city:
9.0%North Carolina:
8.3%
Marital status for residents in Cornelius Marital status - White (Caucasian) population 15 years and over
Males 23.9% Never married65.3% Now married1.1% Separated1.8% Widowed7.9% DivorcedFemales 21.9% Never married57.4% Now married0.9% Separated5.6% Widowed14.2% DivorcedWomen who gave birth in the past 12 months Now married:
100.0% (222)Unmarried:
0.0% (0)
Women who did not give birth in the past 12 months Now married:
50.4% (2,825)Unmarried:
49.6% (2,783)
Marital status - Black or African American population 15 years and over
Males 22.5% Never married46.6% Now married0.0% Separated0.0% Widowed30.9% DivorcedFemales 51.2% Never married28.1% Now married0.0% Separated0.0% Widowed20.7% DivorcedWomen who did not give birth in the past 12 months Now married:
24.5% (118)Unmarried:
75.5% (364)
Marital status - American Indian / Alaska Native population 15 years and over
Males 100.0% Never married0.0% Now married0.0% Separated0.0% Widowed0.0% DivorcedFemales 100.0% Never married0.0% Now married0.0% Separated0.0% Widowed0.0% DivorcedWomen who did not give birth in the past 12 months Now married:
0.0% (0)Unmarried:
100.0% (33)
Marital status - Asian population 15 years and over
Males 23.9% Never married61.4% Now married6.9% Separated0.0% Widowed7.7% DivorcedFemales 0.0% Never married68.0% Now married0.0% Separated26.4% Widowed5.6% DivorcedWomen who did not give birth in the past 12 months Now married:
100.0% (80)Unmarried:
0.0% (0)
Marital status - Other race population 15 years and over
Males 40.8% Never married59.2% Now married0.0% Separated0.0% Widowed0.0% DivorcedFemales 39.7% Never married48.9% Now married0.0% Separated0.0% Widowed11.4% DivorcedWomen who did not give birth in the past 12 months Now married:
100.0% (79)Unmarried:
0.0% (0)
Marital status - Two or more races population 15 years and over
Males 48.4% Never married43.6% Now married0.4% Separated5.7% Widowed1.9% DivorcedFemales 47.9% Never married37.5% Now married0.0% Separated6.5% Widowed8.1% DivorcedWomen who did not give birth in the past 12 months Now married:
26.7% (120)Unmarried:
73.3% (328)
Marital status - White alone, not Hispanic / Latino population 15 years and over
Males 23.7% Never married65.5% Now married1.1% Separated1.8% Widowed7.9% DivorcedFemales 21.0% Never married58.0% Now married0.9% Separated5.8% Widowed14.4% DivorcedWomen who gave birth in the past 12 months Now married:
100.0% (234)Unmarried:
0.0% (0)
Women who did not give birth in the past 12 months Now married:
51.2% (2,871)Unmarried:
48.8% (2,733)
Marital status - Hispanic or Latino population 15 years and over
Males 37.6% Never married48.2% Now married0.0% Separated7.8% Widowed6.4% DivorcedFemales 43.7% Never married44.4% Now married0.0% Separated2.7% Widowed9.2% DivorcedWomen who did not give birth in the past 12 months Now married:
46.9% (246)Unmarried:
53.1% (279)
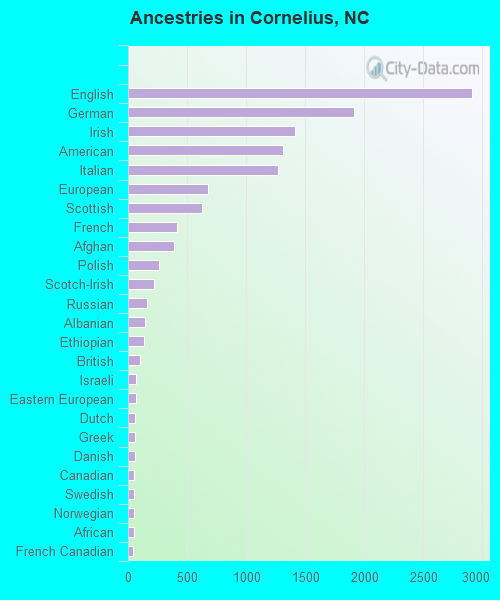
Ancestries in Cornelius
2,913 18.2% English1,913 12.0% German1,418 8.9% Irish1,310 8.2% American1,269 7.9% Italian681 4.3% European625 3.9% Scottish413 2.6% French393 2.5% Afghan259 1.6% Polish219 1.4% Scotch-Irish165 1.0% Russian140 0.9% Albanian139 0.9% Ethiopian98 0.6% British71 0.4% Israeli64 0.4% Eastern European62 0.4% Dutch62 0.4% Greek61 0.4% Danish53 0.3% Canadian52 0.3% Swedish50 0.3% Norwegian49 0.3% African44 0.3% French Canadian42 0.3% Northern European39 0.2% Romanian35 0.2% Armenian32 0.2% Slovak30 0.2% Ukrainian27 0.2% Palestinian27 0.2% Czech26 0.2% Lebanese25 0.2% Macedonian23 0.1% Croatian22 0.1% Yugoslavian19 0.1% Czechoslovakian19 0.1% Scandinavian18 0.1% Turkish17 0.1% Finnish15 0.09% Arab15 0.09% Austrian14 0.09% Portuguese12 0.08% South African10 0.06% Hungarian6 0.04% Welsh3 0.02% Serbian
Geographical mobility in Cornelius Same house 1 year ago 21,997 86.1% White (Caucasian)1,455 95.0% Black or African American527 59.6% Asian353 94.9% Other race1,949 84.4% Two or more races22,284 86.0% White alone, not Hispanic / Latino1,599 79.3% Hispanic or LatinoMoved within same county 1,636 6.4% White / Caucasian36 2.3% Black or African American104 41.1% American Indian / Alaska Native9 1.0% Asian112 4.9% Two or more races1,652 6.4% White alone, not Hispanic / Latino224 11.1% Hispanic or LatinoMoved within same state 719 2.8% White / Caucasian34 2.2% Black or African American9 1.0% Asian18 4.9% Other race23 1.0% Two or more races724 2.8% White alone, not Hispanic / Latino42 2.1% Hispanic or LatinoMoved from different state 1,176 4.6% White / Caucasian195 8.5% Two or more races1,206 4.7% White alone, not Hispanic / Latino89 4.4% Hispanic or LatinoMoved from abroad 33 0.1% White611 69.1% Asian42 1.8% Two or more races36 0.1% White alone, not Hispanic / Latino33 1.6% Hispanic or Latino
Children Nativity (place of birth) in Cornelius
Children under 6 years - Living with two parents Both parents native 988 100.0% NativeBoth parents foreign-born 43 23.6% Native137 76.4% Foreign-bornOne native, one foreign-born parent 178 100.0% NativeChildren under 6 years - Living with one parent Native parent 241 100.0% NativeChildren 6 to 17 years - Living with two parents Both parents native 3,433 99.1% Native31 0.9% Foreign-bornBoth parents foreign-born 181 34.3% Native346 65.7% Foreign-bornOne native, one foreign-born parent 241 100.0% NativeChildren 6 to 17 years - Living with one parent Native parent 959 95.9% Native41 4.1% Foreign-bornForeign-born parent 90 77.3% Native26 22.7% Foreign-born
Grandparents responsible for own grandchildren in Cornelius
Grandparents (30 to 59 years) White / Caucasian 41 96.9% Responsible for grandchildren1 3.1% Not responsible for grandchildrenBlack or African American 19 100.0% Not responsible for grandchildrenAsian 7 100.0% Responsible for grandchildrenOther race 25 100.0% Not responsible for grandchildrenWhite alone, not Hispanic / Latino 46 97.1% Responsible for grandchildren1 2.9% Not responsible for grandchildrenHispanic or Latino 14 100.0% Not responsible for grandchildrenGrandparents (60 years and over) White / Caucasian 64 28.7% Responsible for grandchildren160 71.3% Not responsible for grandchildrenBlack or African American 52 100.0% Not responsible for grandchildrenWhite alone, not Hispanic / Latino 84 33.2% Responsible for grandchildren169 66.8% Not responsible for grandchildren