Concord, MO (Missouri) Houses and Residents
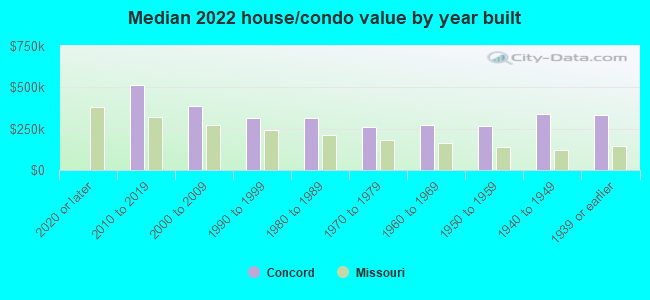
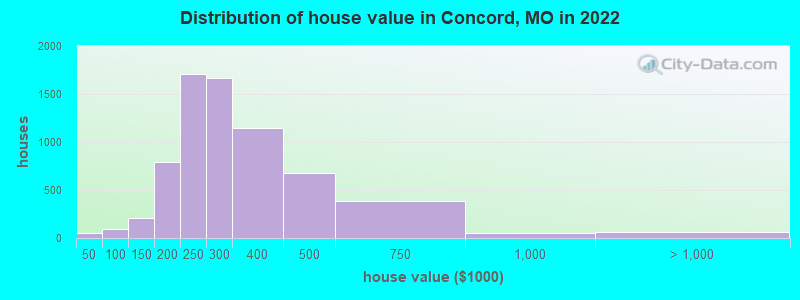
Estimated median house or condo value in 2022: $281,574 (it was $132,200 in 2000 )
Concord:
$281,574Missouri:
$221,200
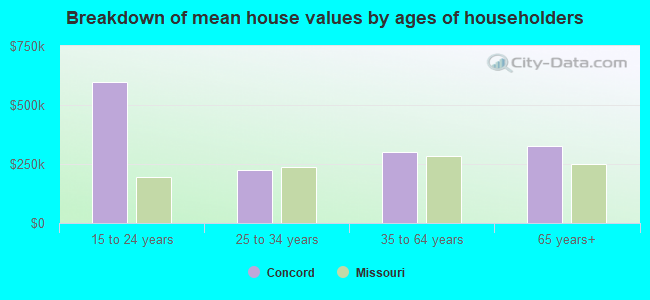
Lower value quartile - upper value quartile: $232,718 - $371,718Mean price in 2022: Detached houses: $310,915 Here:
$310,915State:
$278,068
Townhouses or other attached units: $298,004 Here:
$298,004State:
$260,773
In 3-to-4-unit structures: $268,114 Here:
$268,114State:
$181,162
In 5-or-more-unit structures: $99,132 Here:
$99,132State:
$263,082
Total population: 16,421 (All urban)
Houses: 7,863 (7,672 occupied: 6,588 owner occupied, 1,067 renter occupied )
% of renters here:
14%State:
32%
Housing density: 1,426 houses/condos per square mile
Median price asked for vacant for-sale houses and condos in 2022: $181,714.
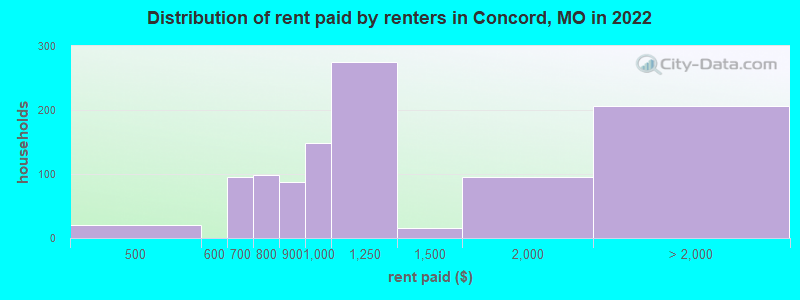
Median contract rent in 2022: $1,010 (lower quartile is $798, upper quartile is $1,234)
Median rent asked for vacant for-rent units in 2022: $987
Median gross rent in Concord, MO in 2022: $1,104
Housing units in Concord with a mortgage: 3,641 (362 second mortgage, 27 home equity loan, 277 both second mortgage and home equity loan )Houses without a mortgage: 154
Median household income for houses/condos with a mortgage: $110,987
Median household income for apartments without a mortgage: $76,014
Median monthly housing costs: $1,093
Data:
Median house or condo value ($)
Median house or condo value ($ change since 2000)
Median house or condo value ($) - White
Median house or condo value ($) - Black or African American
Median house or condo value ($) - Asian
Median house or condo value ($) - Hispanic or Latino
Median house or condo value ($) - American Indian and Alaska Native
Median house or condo value ($) - Multirace
Median house or condo value ($) - Other Race
Median price asked for mobile homes ($)
Household density (households per square mile)
Mean house or condo value by units in structure - 1, detached ($)
Mean house or condo value by units in structure - 1, attached ($)
Mean house or condo value by units in structure - 2 ($)
Mean house or condo value by units in structure by units in structure - 3 or 4 ($)
Mean house or condo value by units in structure - 5 or more ($)
Mean house or condo value by units in structure - Boat, RV, van, etc. ($)
Mean house or condo value by units in structure - Mobile home ($)
Median contract rent ($)
Median contract rent - Lower quartile ($)
Median contract rent - Upper quartile ($)
Median gross rent ($)
Urban houses (%)
Rural houses (%)
Houses occupied (%)
Houses occupied (% change since 2000)
Houses owner occupied (%)
Houses owner occupied (% change since 2000)
Houses renter occupied (%)
Houses renter occupied (% change since 2000)
Vacant housing units - For rent (%)
Vacant housing units - For rent (% change since 2000)
Vacant housing units - For sale only (%)
Vacant housing units - For sale only (% change since 2000)
Vacant housing units - Rented or sold, not occupied (%)
Vacant housing units - Rented or sold, not occupied (% change since 2000)
Vacant housing units - For seasonal, recreational, or occasional use (%)
Vacant housing units - For seasonal, recreational, or occasional use (% change since 2000)
Vacant housing units - For migrant workers (%)
Vacant housing units - For migrant workers (% change since 2000)
Vacant housing units - Other vacant (%)
Vacant housing units - Other vacant (% change since 2000)
Median monthly housing costs ($)
Median household income for houses/condos with a mortgage ($)
Median household income for houses/condos without a mortgage ($)
Median household income ($)
Median household income ($) - White
Median household income ($) - Black or African American
Median household income ($) - Asian
Median household income ($) - Hispanic or Latino
Median household income ($) - American Indian and Alaska Native
Median household income ($) - Multirace
Median household income ($) - Other Race
Mortgage status - with mortgage (%)
Mortgage status - with second mortgage (%)
Mortgage status - with home equity loan (%)
Mortgage status - with both second mortgage and home equity loan (%)
Mortgage status - without a mortgage (%)
Median year house/condo built
Median year apartment built
Household type by relationship - Male householder living alone (%)
Household type by relationship - Male householder not living alone (%)
Household type by relationship - Female householder living alone (%)
Household type by relationship - Female householder not living alone (%)
Household type by relationship - Opposite-Sex spouse (%)
Household type by relationship - Same-Sex spouse (%)
Household type by relationship - Opposite-Sex unmarried partner (%)
Household type by relationship - Same-Sex unmarried partner (%)
Household type by relationship - In group quarters (%)
Size of family households - 2-person household (%)
Size of family households - 3-person household (%)
Size of family households - 4-person household (%)
Size of family households - 5-person household (%)
Size of family households - 6-person household (%)
Size of family households - 7-or-more-person household (%)
Size of nonfamily households - 1-person household (%)
Size of nonfamily households - 2-person household (%)
Size of nonfamily households - 3-person household (%)
Size of nonfamily households - 4-person household (%)
Size of nonfamily households - 5-person household (%)
Size of nonfamily households - 6-person household (%)
Size of nonfamily households - 7-or-moreperson household (%)
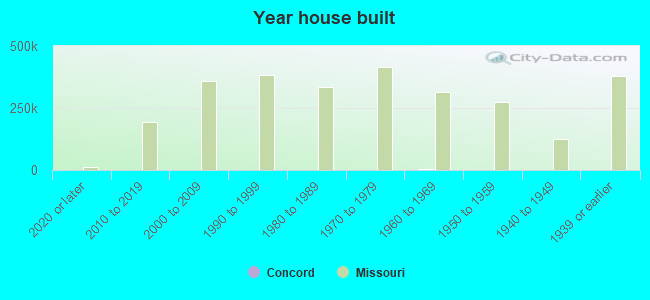
Year house built - Built 2010 or later (%)
Year house built - Built 2000 to 2009 (%)
Year house built - Built 1990 to 1999 (%)
Year house built - Built 1980 to 1989 (%)
Year house built - Built 1970 to 1979 (%)
Year house built - Built 1960 to 1969 (%)
Year house built - Built 1950 to 1959 (%)
Year house built - Built 1940 to 1949 (%)
Year house built - Built 1939 or earlier (%)
Median number of rooms in houses and condos
Median number of rooms in apartments
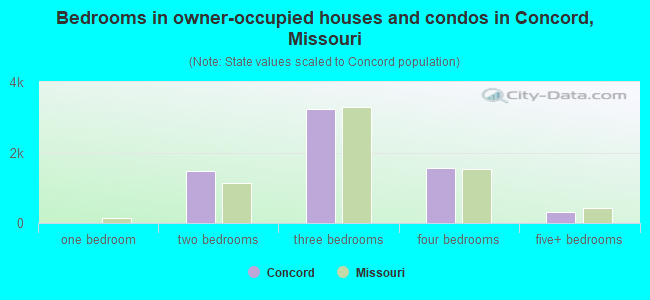
Median number of bedrooms in owner occupied houses
Mean number of bedrooms in owner occupied houses
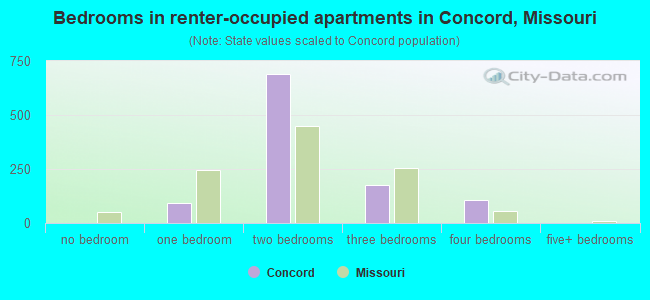
Median number of bedrooms in renter occupied houses
Mean number of bedrooms in renter occupied houses
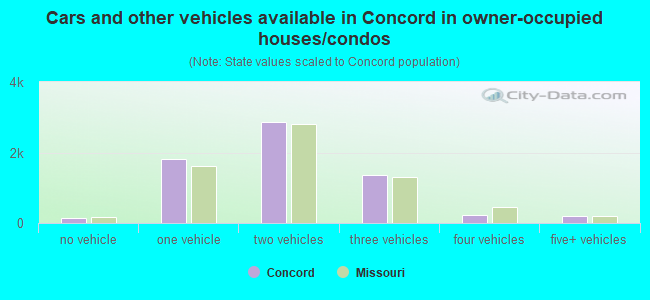
Median number of vehichles in owner occupied houses
Mean number of vehichles in owner occupied houses
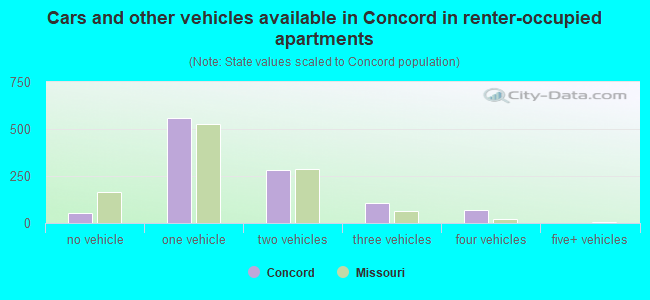
Median number of vehichles in renter occupied houses
Mean number of vehichles in renter occupied houses
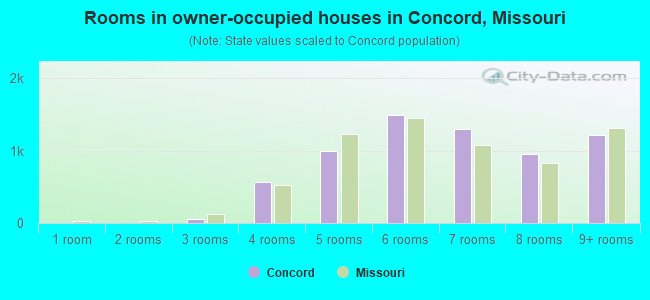
Rooms in owner-occupied houses - 1 room (%)
Rooms in owner-occupied houses - 2 rooms (%)
Rooms in owner-occupied houses - 3 rooms (%)
Rooms in owner-occupied houses - 4 rooms (%)
Rooms in owner-occupied houses - 5 rooms (%)
Rooms in owner-occupied houses - 6 rooms (%)
Rooms in owner-occupied houses - 7 rooms (%)
Rooms in owner-occupied houses - 8 rooms (%)
Rooms in owner-occupied houses - 9+ rooms (%)
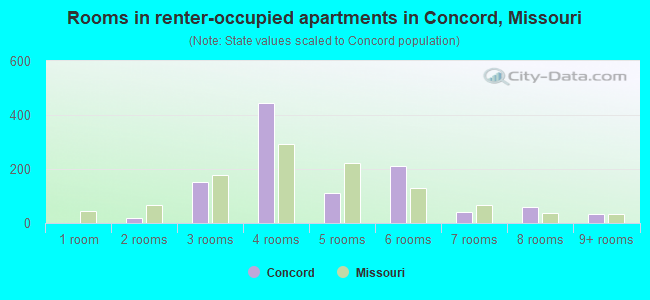
Rooms in renter-occupied houses - 1 room (%)
Rooms in renter-occupied houses - 2 rooms (%)
Rooms in renter-occupied houses - 3 rooms (%)
Rooms in renter-occupied houses - 4 rooms (%)
Rooms in renter-occupied houses - 5 rooms (%)
Rooms in renter-occupied houses - 6 rooms (%)
Rooms in renter-occupied houses - 7 rooms (%)
Rooms in renter-occupied houses - 8 rooms (%)
Rooms in renter-occupied houses - 9+ rooms (%)
Bedrooms in owner-occupied houses - no bedrooms (%)
Bedrooms in owner-occupied houses - 1 bedroom (%)
Bedrooms in owner-occupied houses - 2 bedrooms (%)
Bedrooms in owner-occupied houses - 3 bedrooms (%)
Bedrooms in owner-occupied houses - 4 bedrooms (%)
Bedrooms in owner-occupied houses - 5+ bedrooms (%)
Bedrooms in renter-occupied houses - no bedrooms (%)
Bedrooms in renter-occupied houses - 1 bedroom (%)
Bedrooms in renter-occupied houses - 2 bedrooms (%)
Bedrooms in renter-occupied houses - 3 bedrooms (%)
Bedrooms in renter-occupied houses - 4 bedrooms (%)
Bedrooms in renter-occupied houses - 5+ bedrooms (%)
Vehicles available in owner-occupied houses - no vehicle available (%)
Vehicles available in owner-occupied houses - 1 vehicle available(%)
Vehicles available in owner-occupied houses - 2 Vehicles available (%)
Vehicles available in owner-occupied houses - 3 Vehicles available (%)
Vehicles available in owner-occupied houses - 4 Vehicles available (%)
Vehicles available in owner-occupied houses - 5+ Vehicles available (%)
Vehicles available in renter-occupied houses - no vehicle available (%)
Vehicles available in renter-occupied houses - 1 vehicle available (%)
Vehicles available in renter-occupied houses - 2 Vehicles available (%)
Vehicles available in renter-occupied houses - 3 Vehicles available (%)
Vehicles available in renter-occupied houses - 4 Vehicles available (%)
Vehicles available in renter-occupied houses - 5+ Vehicles available (%)
Housing units in structures - 1, detached (%)
Housing units in structures - 1, attached (%)
Housing units in structures - 2 (%)
Housing units in structures - 3 or 4 (%)
Housing units in structures - 5 to 9 (%)
Housing units in structures - 10 to 19 (%)
Housing units in structures - 20 to 49 (%)
Housing units in structures - 50 or more (%)
Housing units in structures - Mobile home (%)
Housing units in structures - Boat, RV, van, etc. (%)
Housing units in structures - Owners - 1, detached (%)
Housing units in structures - Owners - 1, attached (%)
Housing units in structures - Owners - 2 (%)
Housing units in structures - Owners - 3 or 4 (%)
Housing units in structures - Owners - 5 to 9 (%)
Housing units in structures - Owners - 10 to 19 (%)
Housing units in structures - Owners - 20 to 49 (%)
Housing units in structures - Owners - 50 or more (%)
Housing units in structures - Owners - Mobile home (%)
Housing units in structures - Owners - Boat, RV, van, etc. (%)
Housing units in structures - Renters - 1, detached (%)
Housing units in structures - Renters - 1, attached (%)
Housing units in structures - Renters - 2 (%)
Housing units in structures - Renters - 3 or 4 (%)
Housing units in structures - Renters - 5 to 9 (%)
Housing units in structures - Renters - 10 to 19 (%)
Housing units in structures - Renters - 20 to 49 (%)
Housing units in structures - Renters - 50 or more (%)
Housing units in structures - Renters - Mobile home (%)
Housing units in structures - Renters - Boat, RV, van, etc. (%)
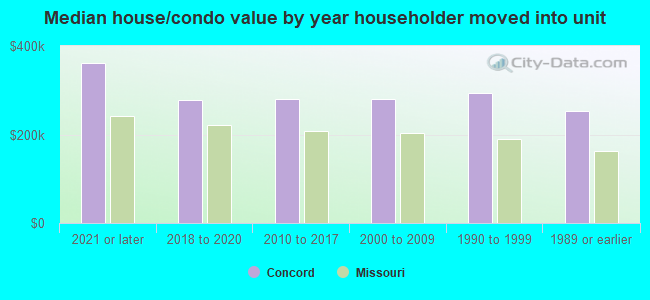
House/condo owner moved in on average (years ago)
Renter moved in on average (years ago)
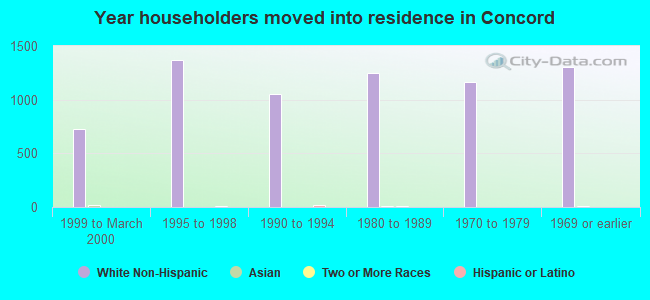
Year householder moved into unit - Moved in 1999 to March 2000 (%)
Year householder moved into unit - Moved in 1999 to March 2000 (%) - White
Year householder moved into unit - Moved in 1999 to March 2000 (%) - Black or African American
Year householder moved into unit - Moved in 1999 to March 2000 (%) - Asian
Year householder moved into unit - Moved in 1999 to March 2000 (%) - Hispanic or Latino
Year householder moved into unit - Moved in 1999 to March 2000 (%) - American Indian and Alaska Native
Year householder moved into unit - Moved in 1999 to March 2000 (%) - Multirace
Year householder moved into unit - Moved in 1999 to March 2000 (%) - Other Race
Year householder moved into unit - Moved in 1995 to 1998 (%)
Year householder moved into unit - Moved in 1995 to 1998 (%) - White
Year householder moved into unit - Moved in 1995 to 1998 (%) - Black or African American
Year householder moved into unit - Moved in 1995 to 1998 (%) - Asian
Year householder moved into unit - Moved in 1995 to 1998 (%) - Hispanic or Latino
Year householder moved into unit - Moved in 1995 to 1998 (%) - American Indian and Alaska Native
Year householder moved into unit - Moved in 1995 to 1998 (%) - Multirace
Year householder moved into unit - Moved in 1995 to 1998 (%) - Other Race
Year householder moved into unit - Moved in 1990 to 1994 (%)
Year householder moved into unit - Moved in 1990 to 1994 (%) - White
Year householder moved into unit - Moved in 1990 to 1994 (%) - Black or African American
Year householder moved into unit - Moved in 1990 to 1994 (%) - Asian
Year householder moved into unit - Moved in 1990 to 1994 (%) - Hispanic or Latino
Year householder moved into unit - Moved in 1990 to 1994 (%) - American Indian and Alaska Native
Year householder moved into unit - Moved in 1990 to 1994 (%) - Multirace
Year householder moved into unit - Moved in 1990 to 1994 (%) - Other Race
Year householder moved into unit - Moved in 1980 to 1989 (%)
Year householder moved into unit - Moved in 1980 to 1989 (%) - White
Year householder moved into unit - Moved in 1980 to 1989 (%) - Black or African American
Year householder moved into unit - Moved in 1980 to 1989 (%) - Asian
Year householder moved into unit - Moved in 1980 to 1989 (%) - Hispanic or Latino
Year householder moved into unit - Moved in 1980 to 1989 (%) - American Indian and Alaska Native
Year householder moved into unit - Moved in 1980 to 1989 (%) - Multirace
Year householder moved into unit - Moved in 1980 to 1989 (%) - Other Race
Year householder moved into unit - Moved in 1970 to 1979 (%)
Year householder moved into unit - Moved in 1970 to 1979 (%) - White
Year householder moved into unit - Moved in 1970 to 1979 (%) - Black or African American
Year householder moved into unit - Moved in 1970 to 1979 (%) - Asian
Year householder moved into unit - Moved in 1970 to 1979 (%) - Hispanic or Latino
Year householder moved into unit - Moved in 1970 to 1979 (%) - American Indian and Alaska Native
Year householder moved into unit - Moved in 1970 to 1979 (%) - Multirace
Year householder moved into unit - Moved in 1970 to 1979 (%) - Other Race
Year householder moved into unit - Moved in 1969 or earlier (%)
Year householder moved into unit - Moved in 1969 or earlier (%) - White
Year householder moved into unit - Moved in 1969 or earlier (%) - Black or African American
Year householder moved into unit - Moved in 1969 or earlier (%) - Asian
Year householder moved into unit - Moved in 1969 or earlier (%) - Hispanic or Latino
Year householder moved into unit - Moved in 1969 or earlier (%) - American Indian and Alaska Native
Year householder moved into unit - Moved in 1969 or earlier (%) - Multirace
Year householder moved into unit - Moved in 1969 or earlier (%) - Other Race
Housing units lacking complete plumbing facilities (%)
Housing units lacking complete kitchen facilities (%)
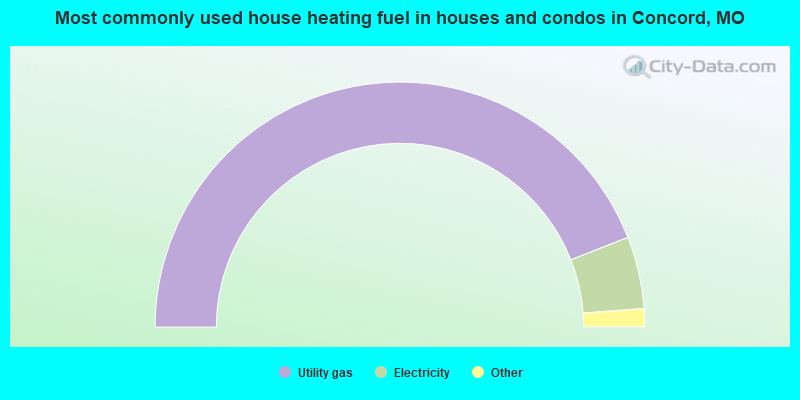
House heating fuel used in houses and condos - Utility gas (%)
House heating fuel used in houses and condos - Bottled, tank, or LP gas (%)
House heating fuel used in houses and condos - Electricity (%)
House heating fuel used in houses and condos - Fuel oil, kerosene, etc. (%)
House heating fuel used in houses and condos - Coal or coke (%)
House heating fuel used in houses and condos - Wood (%)
House heating fuel used in houses and condos - Solar energy (%)
House heating fuel used in houses and condos - Other fuel (%)
House heating fuel used in houses and condos - No fuel used (%)
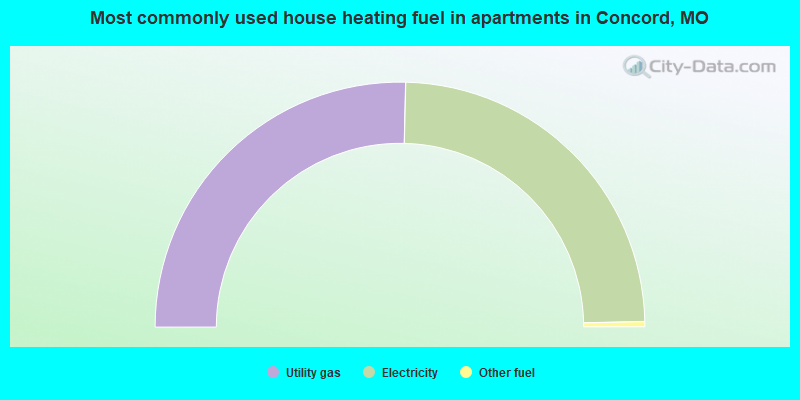
House heating fuel used in apartments - Utility gas (%)
House heating fuel used in apartments - Bottled, tank, or LP gas (%)
House heating fuel used in apartments - Electricity (%)
House heating fuel used in apartments - Fuel oil, kerosene, etc. (%)
House heating fuel used in apartments - Coal or coke (%)
House heating fuel used in apartments - Wood (%)
House heating fuel used in apartments - Solar energy (%)
House heating fuel used in apartments - Other fuel (%)
House heating fuel used in apartments - No fuel used (%)
Latest news about housing in Concord, MO collected exclusively by city-data.com from local newspapers, TV, and radio stations
Median year house/condo built: 1967Median year apartment built: 1984Household type by relationship:
Households: 18,433
Male householders: 3,873 (775 living alone ), Female householders: 3,710 (1,279 living alone )3,768 spouses (3,763 opposite-sex spouses ), 591 unmarried partners , (569 opposite-sex unmarried partners ), 5,458 children (5,035 natural , 234 adopted , 188 stepchildren ), 106 grandchildren , 100 brothers or sisters , 136 parents , 0 foster children , 238 other relatives , 435 non-relatives In group quarters: 11
Size of family households: 2,526 2-persons , 1,111 3-persons , 925 4-persons , 363 5-persons , 189 6-persons , 14 7-or-more-persons .
Size of nonfamily households: 2,032 1-person , 452 2-persons , 73 4-persons .
2,597 married couples with children. single-parent households (385 men , 582 women ).
91.0% of residents of Concord speak English at home. of residents speak Spanish at home (79% speak English very well , 21% speak English well ).of residents speak other Indo-European language at home (71% speak English very well , 17% speak English well , 10% speak English not well , 2% don't speak English at all ).of residents speak Asian or Pacific Island language at home (53% speak English very well , 27% speak English well , 16% speak English not well , 3% don't speak English at all ).of residents speak other language at home (80% speak English very well , 20% speak English well ).
Foreign born population: 1,014 (5.5%)of them are naturalized citizens )
Median number of rooms in houses and condos:
Median number of rooms in apartments
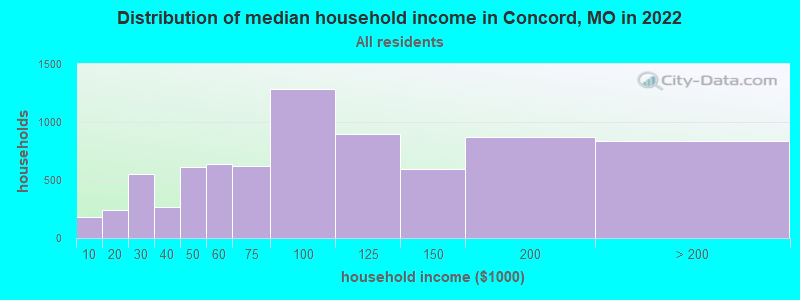
Concord, MO household income distribution 181 Less than $10,000244 $10,000 to $19,999555 $20,000 to $29,999271 $30,000 to $39,999610 $40,000 to $49,999641 $50,000 to $59,999623 $60,000 to $74,9991,285 $75,000 to $99,999900 $100,000 to $124,999592 $125,000 to $149,999874 $150,000 to $199,999838 $200,000 or more
Home value of owner - occupied houses in 2022 in Concord, MO 24 Less than $10,00022 $15,000 to $19,99934 $50,000 to $59,99949 $70,000 to $79,9995 $90,000 to $99,99986 $100,000 to $124,999117 $125,000 to $149,999408 $150,000 to $174,999379 $175,000 to $199,9991,709 $200,000 to $249,9991,667 $250,000 to $299,9991,150 $300,000 to $399,999678 $400,000 to $499,999380 $500,000 to $749,99950 $750,000 to $999,99951 $1,500,000 to $1,999,99912 $2,000,000 or moreRent paid by renters in 2022 in Concord, MO 20 $450 to $49919 $600 to $64975 $650 to $69929 $700 to $74969 $750 to $79988 $800 to $899147 $900 to $999275 $1,000 to $1,24916 $1,250 to $1,49995 $1,500 to $1,99956 $2,000 to $2,499149 No cash rent
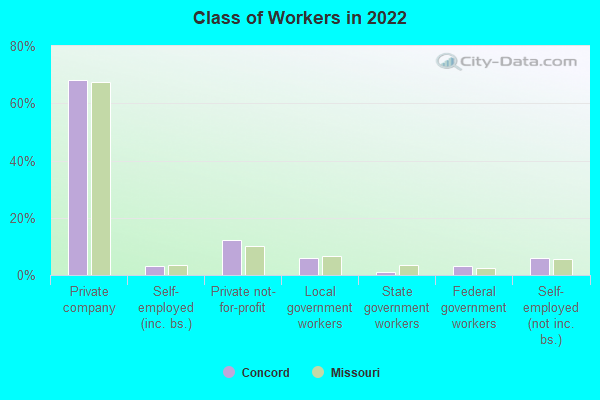
Percentage of workers working in this county: 74.6%Number of people working at home: 1,426 (15.4% of all workers )
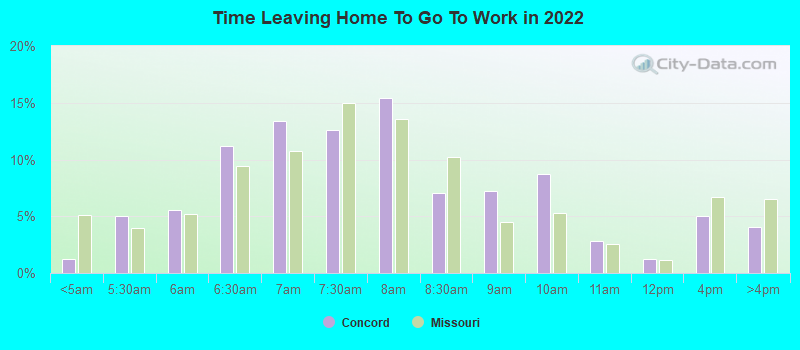
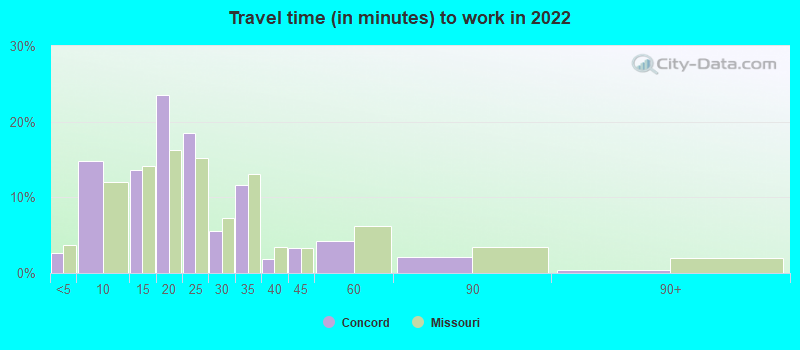
Travel time to work (commute)
Less than 5 minutes: 1745 to 9 minutes: 50710 to 14 minutes: 71315 to 19 minutes: 1,47220 to 24 minutes: 1,43325 to 29 minutes: 86530 to 34 minutes: 1,39835 to 39 minutes: 18940 to 44 minutes: 33245 to 59 minutes: 35960 to 89 minutes: 18590 or more minutes: 92
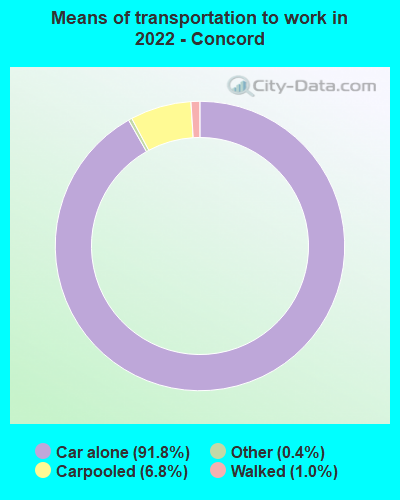
Means of transportation to work:
Drove a car alone: 4,897 (73.8%)Carpooled: 344 (5.2%)Taxi: 20 (0.3%)Walked: 60 (0.9%)Worked at home: 1,426 (21.5%)
Unemployment by race in 2022
Unemployment rate for White non-Hispanic residents 4.3% Males1.2% FemalesUnemployment rate for Asian residents 34.6% Males
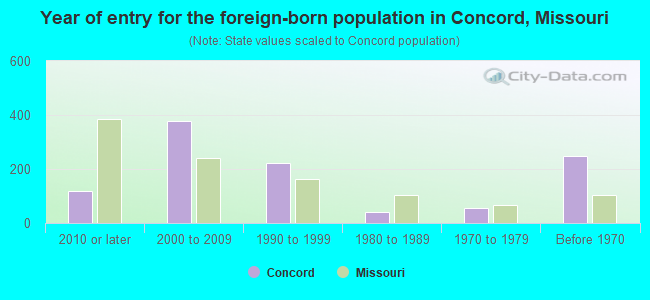
Year of entry for the foreign-born population in Concord, Missouri
120 2010 or later 377 2000 to 2009 224 1990 to 1999 41 1980 to 1989 55 1970 to 1979 247 Before 1970
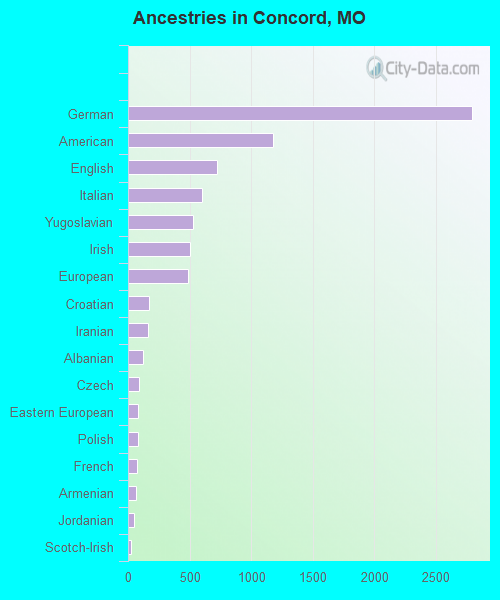
First ancestries reported:
German: 2,792 (32.1%)
American: 1,178 (13.5%)
English: 720 (8.3%)
Italian: 603 (6.9%)
Yugoslavian: 526 (6.0%)
Irish: 504 (5.8%)
European: 488 (5.6%)
Croatian: 168 (1.9%)
Iranian: 166 (1.9%)
Albanian: 124 (1.4%)
Czech: 88 (1.0%)
Eastern European: 79 (0.9%)
Polish: 79 (0.9%)
French: 76 (0.9%)
Armenian: 61 (0.7%)
Jordanian: 45 (0.5%)
Scotch-Irish: 27 (0.3%)
Scottish: 24 (0.3%)
Ukrainian: 23 (0.3%)
Palestinian: 22 (0.3%)
British: 22 (0.3%)
Romanian: 22 (0.3%)
Canadian: 21 (0.2%)
Dutch: 21 (0.2%)
Hungarian: 21 (0.2%)
Serbian: 21 (0.2%)
Norwegian: 18 (0.2%)
Russian: 16 (0.2%)
Austrian: 14 (0.2%)
French Canadian: 11 (0.1%)
Northern European: 11 (0.1%)
Greek: 9 (0.1%)
Scandinavian: 8 (0.09%)
Swiss: 7 (0.08%)
Welsh: 7 (0.08%) Most common places of birth for foreign-born residents (%): Bosnia and Herzegovina Concord:
17.0% (170)Missouri:
3.2% (8,168)
Other Eastern Europe Concord:
8.9% (89)Missouri:
0.5% (1,295)
Albania Concord:
8.8% (88)Missouri:
0.4% (1,155)
Iran Concord:
6.9% (69)Missouri:
0.6% (1,625)
Cambodia Concord:
6.7% (67)Missouri:
0.3% (764)
Italy Concord:
5.2% (52)Missouri:
0.7% (1,681)
Vietnam Concord:
5.0% (50)Missouri:
4.1% (10,700)
Kuwait Concord:
4.2% (42)Missouri:
0.2% (406)
China, excluding Hong Kong and Taiwan Concord:
3.5% (35)Missouri:
6.6% (17,002)
Romania Concord:
3.2% (32)Missouri:
0.6% (1,481)
Mexico Concord:
3.2% (32)Missouri:
14.9% (38,568)
Russia Concord:
2.6% (26)Missouri:
1.5% (3,767)
Germany Concord:
2.4% (24)Missouri:
3.0% (7,803)
Canada Concord:
2.0% (20)Missouri:
1.9% (4,806)
India Concord:
1.9% (19)Missouri:
8.9% (22,932)
Guatemala Concord:
1.9% (19)Missouri:
2.8% (7,146)
Philippines Concord:
1.7% (17)Missouri:
4.2% (10,873)
Bhutan Concord:
1.6% (16)Missouri:
0.1% (379)
Place of birth for U.S.-born residents:
This state: 13,988Other state: 3,238Northeast: 265Midwest: 1,538South: 724West: 705 91.9% of Concord residents lived in the same house 1 years ago.
Out of people who lived in different houses, 34.6% lived in this county.
Out of people who lived in different counties, 74.6% lived in Missouri.
Concord:
91.9%State average:
87.1%
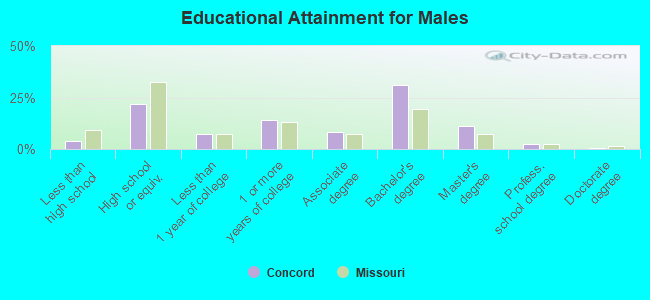
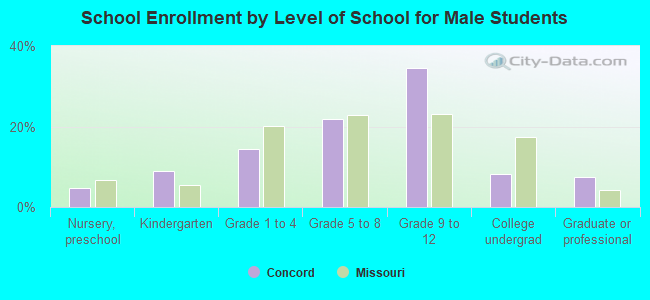
Education attainment for males 25 years and older:
No schooling: 72Nursery to 4th grade: 05th and 6th grade: 187th and 8th grade: 259th grade: 010th grade: 2211th grade: 012th grade, no diploma: 90High school graduate (or equivalency): 1,349Less than 1 year of college: 440Some college more than 1 year, no degree: 869Associate degree: 523Bachelor's degree: 1,933Master's degree: 697Professional school degree: 161Doctorate degree: 24
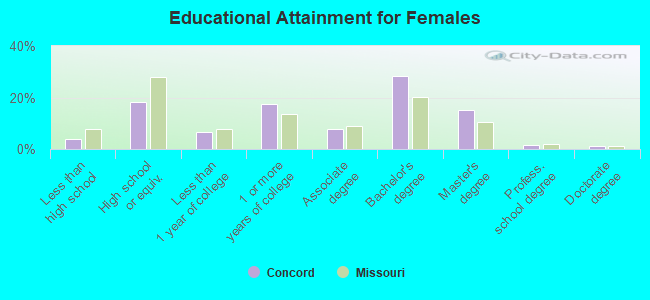
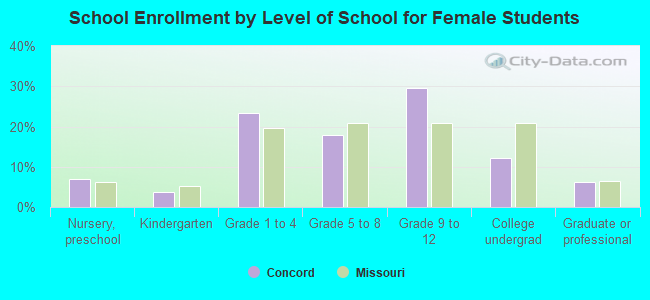
Education attainment for females 25 years and older:
No schooling: 34Nursery to 4th grade: 05th and 6th grade: 247th and 8th grade: 219th grade: 1010th grade: 6211th grade: 6512th grade, no diploma: 63High school graduate (or equivalency): 1,293Less than 1 year of college: 455Some college more than 1 year, no degree: 1,217Associate degree: 556Bachelor's degree: 1,985Master's degree: 1,056Professional school degree: 108Doctorate degree: 74
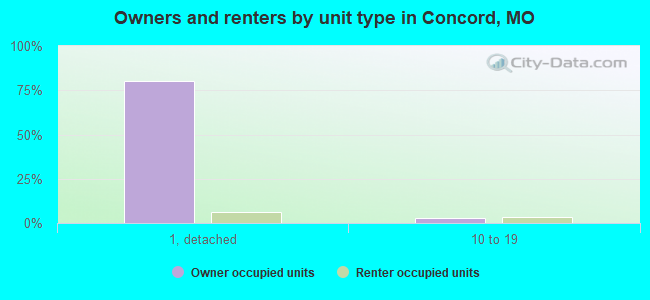
Housing units in structures:
One, detached: 6,439One, attached: 464Two: 743 or 4: 1485 to 9: 10210 to 19: 50720 to 49: 11050 or more: 17Housing units lacking complete kitchen facilities in 2022: 0.9%House/condo owner moved in on average 14 years ago
Renter moved in on average 2 years ago
Private vs. public school enrollment:
Students in private schools in grades 1 to 8 (elementary and middle school): 250 Students in private schools in grades 9 to 12 (high school): 191 Students in private undergraduate colleges: 34