Races in Concord, Missouri (MO) Detailed Stats
Data:
Races - White alone (%)
Races - White alone (% change since 2000)
Races - Black alone (%)
Races - Black alone (% change since 2000)
Races - American Indian alone (%)
Races - American Indian alone (% change since 2000)
Races - Asian alone (%)
Races - Asian alone (% change since 2000)
Races - Hispanic (%)
Races - Hispanic (% change since 2000)
Races - Native Hawaiian and Other Pacific Islander alone (%)
Races - Native Hawaiian and Other Pacific Islander alone (% change since 2000)
Races - Two or more races(%)
Races - Two or more races(% change since 2000)
Races - Other race alone (%)
Races - Other race alone (% change since 2000)
Racial diversity
Place of birth - Born in state of residence (%)
Place of birth - Born in state of residence (%) - White
Place of birth - Born in state of residence (%) - Black or African American
Place of birth - Born in state of residence (%) - Asian
Place of birth - Born in state of residence (%) - Hispanic or Latino
Place of birth - Born in state of residence (%) - American Indian and Alaska Native
Place of birth - Born in state of residence (%) - Multirace
Place of birth - Born in state of residence (%) - Other Race
Place of birth - Born in other state (%)
Place of birth - Born in other state (%) - White
Place of birth - Born in other state (%) - Black or African American
Place of birth - Born in other state (%) - Asian
Place of birth - Born in other state (%) - Hispanic or Latino
Place of birth - Born in other state (%) - American Indian and Alaska Native
Place of birth - Born in other state (%) - Multirace
Place of birth - Born in other state (%) - Other Race
Place of birth - Native, outside of US (%)
Place of birth - Native, outside of US (%) - White
Place of birth - Native, outside of US (%) - Black or African American
Place of birth - Native, outside of US (%) - Asian
Place of birth - Native, outside of US (%) - Hispanic or Latino
Place of birth - Native, outside of US (%) - American Indian and Alaska Native
Place of birth - Native, outside of US (%) - Multirace
Place of birth - Native, outside of US (%) - Other Race
Place of birth - Foreign born (%)
Place of birth - Foreign born (%) - White
Place of birth - Foreign born (%) - Black or African American
Place of birth - Foreign born (%) - Asian
Place of birth - Foreign born (%) - Hispanic or Latino
Place of birth - Foreign born (%) - American Indian and Alaska Native
Place of birth - Foreign born (%) - Multirace
Place of birth - Foreign born (%) - Other Race
Residents speaking English at home (%)
Residents speaking English at home - Born in the United States (%)
Residents speaking English at home - Native, born elsewhere (%)
Residents speaking English at home - Foreign born (%)
Residents speaking Spanish at home (%)
Residents speaking Spanish at home - Born in the United States (%)
Residents speaking Spanish at home - Native, born elsewhere (%)
Residents speaking Spanish at home - Foreign born (%)
Residents speaking other language at home (%)
Residents speaking other language at home - Born in the United States (%)
Residents speaking other language at home - Native, born elsewhere (%)
Residents speaking other language at home - Foreign born (%)
Marital status - Never married (%)
Marital status - Now married (%)
Marital status - Separated (%)
Marital status - Widowed (%)
Marital status - Divorced (%)
Ancestries Reported - Arab (%)
Ancestries Reported - Czech (%)
Ancestries Reported - Danish (%)
Ancestries Reported - Dutch (%)
Ancestries Reported - English (%)
Ancestries Reported - French (%)
Ancestries Reported - French Canadian (%)
Ancestries Reported - German (%)
Ancestries Reported - Greek (%)
Ancestries Reported - Hungarian (%)
Ancestries Reported - Irish (%)
Ancestries Reported - Italian (%)
Ancestries Reported - Lithuanian (%)
Ancestries Reported - Norwegian (%)
Ancestries Reported - Polish (%)
Ancestries Reported - Portuguese (%)
Ancestries Reported - Russian (%)
Ancestries Reported - Scotch-Irish (%)
Ancestries Reported - Scottish (%)
Ancestries Reported - Slovak (%)
Ancestries Reported - Subsaharan African (%)
Ancestries Reported - Swedish (%)
Ancestries Reported - Swiss (%)
Ancestries Reported - Ukrainian (%)
Ancestries Reported - United States (%)
Ancestries Reported - Welsh (%)
Ancestries Reported - West Indian (%)
Ancestries Reported - Other (%)
Geographical mobility - Same house 1 year ago (%)
Geographical mobility - Same house 1 year ago (%) - White
Geographical mobility - Same house 1 year ago (%) - Black or African American
Geographical mobility - Same house 1 year ago (%) - Asian
Geographical mobility - Same house 1 year ago (%) - Hispanic or Latino
Geographical mobility - Same house 1 year ago (%) - American Indian and Alaska Native
Geographical mobility - Same house 1 year ago (%) - Multirace
Geographical mobility - Same house 1 year ago (%) - Other Race
Geographical mobility - Moved within same county (%)
Geographical mobility - Moved within same county (%) - White
Geographical mobility - Moved within same county (%) - Black or African American
Geographical mobility - Moved within same county (%) - Asian
Geographical mobility - Moved within same county (%) - Hispanic or Latino
Geographical mobility - Moved within same county (%) - American Indian and Alaska Native
Geographical mobility - Moved within same county (%) - Multirace
Geographical mobility - Moved within same county (%) - Other Race
Geographical mobility - Moved from different county within same state (%)
Geographical mobility - Moved from different county within same state (%) - White
Geographical mobility - Moved from different county within same state (%) - Black or African American
Geographical mobility - Moved from different county within same state (%) - Asian
Geographical mobility - Moved from different county within same state (%) - Hispanic or Latino
Geographical mobility - Moved from different county within same state (%) - American Indian and Alaska Native
Geographical mobility - Moved from different county within same state (%) - Multirace
Geographical mobility - Moved from different county within same state (%) - Other Race
Geographical mobility - Moved from different state (%)
Geographical mobility - Moved from different state (%) - White
Geographical mobility - Moved from different state (%) - Black or African American
Geographical mobility - Moved from different state (%) - Asian
Geographical mobility - Moved from different state (%) - Hispanic or Latino
Geographical mobility - Moved from different state (%) - American Indian and Alaska Native
Geographical mobility - Moved from different state (%) - Multirace
Geographical mobility - Moved from different state (%) - Other Race
Geographical mobility - Moved from abroad (%)
Geographical mobility - Moved from abroad (%) - White
Geographical mobility - Moved from abroad (%) - Black or African American
Geographical mobility - Moved from abroad (%) - Asian
Geographical mobility - Moved from abroad (%) - Hispanic or Latino
Geographical mobility - Moved from abroad (%) - American Indian and Alaska Native
Geographical mobility - Moved from abroad (%) - Multirace
Geographical mobility - Moved from abroad (%) - Other Race
Place of birth for the foreign-born population - Ireland (%)
Place of birth for the foreign-born population - Denmark (%)
Place of birth for the foreign-born population - Norway (%)
Place of birth for the foreign-born population - Sweden (%)
Place of birth for the foreign-born population - United Kingdom (%)
Place of birth for the foreign-born population - England (%)
Place of birth for the foreign-born population - Scotland (%)
Place of birth for the foreign-born population - Other Northern Europe (%)
Place of birth for the foreign-born population - Austria (%)
Place of birth for the foreign-born population - Belgium (%)
Place of birth for the foreign-born population - France (%)
Place of birth for the foreign-born population - Germany (%)
Place of birth for the foreign-born population - Netherlands (%)
Place of birth for the foreign-born population - Switzerland (%)
Place of birth for the foreign-born population - Other Western Europe (%)
Place of birth for the foreign-born population - Greece (%)
Place of birth for the foreign-born population - Italy (%)
Place of birth for the foreign-born population - Portugal (%)
Place of birth for the foreign-born population - Spain (%)
Place of birth for the foreign-born population - Other Southern Europe (%)
Place of birth for the foreign-born population - Albania (%)
Place of birth for the foreign-born population - Belarus (%)
Place of birth for the foreign-born population - Bosnia and Herzegovina (%)
Place of birth for the foreign-born population - Bulgaria (%)
Place of birth for the foreign-born population - Croatia (%)
Place of birth for the foreign-born population - Czechoslovakia (%)
Place of birth for the foreign-born population - Hungary (%)
Place of birth for the foreign-born population - Latvia (%)
Place of birth for the foreign-born population - Lithuania (%)
Place of birth for the foreign-born population - North Macedonia (Macedonia) (%)
Place of birth for the foreign-born population - Moldova (%)
Place of birth for the foreign-born population - Poland (%)
Place of birth for the foreign-born population - Romania (%)
Place of birth for the foreign-born population - Russia (%)
Place of birth for the foreign-born population - Serbia (%)
Place of birth for the foreign-born population - Ukraine (%)
Place of birth for the foreign-born population - Other Eastern Europe (%)
Place of birth for the foreign-born population - China (%)
Place of birth for the foreign-born population - Hong Kong (%)
Place of birth for the foreign-born population - Taiwan (%)
Place of birth for the foreign-born population - Japan (%)
Place of birth for the foreign-born population - Korea (%)
Place of birth for the foreign-born population - Other Eastern Asia (%)
Place of birth for the foreign-born population - Afghanistan (%)
Place of birth for the foreign-born population - Bangladesh (%)
Place of birth for the foreign-born population - India (%)
Place of birth for the foreign-born population - Iran (%)
Place of birth for the foreign-born population - Kazakhstan (%)
Place of birth for the foreign-born population - Nepal (%)
Place of birth for the foreign-born population - Pakistan (%)
Place of birth for the foreign-born population - Sri Lanka (%)
Place of birth for the foreign-born population - Uzbekistan (%)
Place of birth for the foreign-born population - Other South Central Asia (%)
Place of birth for the foreign-born population - Burma (%)
Place of birth for the foreign-born population - Cambodia (%)
Place of birth for the foreign-born population - Indonesia (%)
Place of birth for the foreign-born population - Laos (%)
Place of birth for the foreign-born population - Malaysia (%)
Place of birth for the foreign-born population - Philippines (%)
Place of birth for the foreign-born population - Singapore (%)
Place of birth for the foreign-born population - Thailand (%)
Place of birth for the foreign-born population - Vietnam (%)
Place of birth for the foreign-born population - Other South Eastern Asia (%)
Place of birth for the foreign-born population - Armenia (%)
Place of birth for the foreign-born population - Iraq (%)
Place of birth for the foreign-born population - Israel (%)
Place of birth for the foreign-born population - Jordan (%)
Place of birth for the foreign-born population - Kuwait (%)
Place of birth for the foreign-born population - Lebanon (%)
Place of birth for the foreign-born population - Saudi Arabia (%)
Place of birth for the foreign-born population - Syria (%)
Place of birth for the foreign-born population - Turkey (%)
Place of birth for the foreign-born population - Yemen (%)
Place of birth for the foreign-born population - Other Western Asia (%)
Place of birth for the foreign-born population - Eritrea (%)
Place of birth for the foreign-born population - Ethiopia (%)
Place of birth for the foreign-born population - Kenya (%)
Place of birth for the foreign-born population - Somalia (%)
Place of birth for the foreign-born population - Uganda (%)
Place of birth for the foreign-born population - Zimbabwe (%)
Place of birth for the foreign-born population - Other Eastern Africa (%)
Place of birth for the foreign-born population - Cameroon (%)
Place of birth for the foreign-born population - Congo (%)
Place of birth for the foreign-born population - Democratic Republic of Congo (Zaire) (%)
Place of birth for the foreign-born population - Other Middle Africa (%)
Place of birth for the foreign-born population - Egypt (%)
Place of birth for the foreign-born population - Morocco (%)
Place of birth for the foreign-born population - Sudan (%)
Place of birth for the foreign-born population - Other Northern Africa (%)
Place of birth for the foreign-born population - South Africa (%)
Place of birth for the foreign-born population - Other Southern Africa (%)
Place of birth for the foreign-born population - Cabo Verde (%)
Place of birth for the foreign-born population - Ghana (%)
Place of birth for the foreign-born population - Liberia (%)
Place of birth for the foreign-born population - Nigeria (%)
Place of birth for the foreign-born population - Senegal (%)
Place of birth for the foreign-born population - Sierra Leone (%)
Place of birth for the foreign-born population - Other Western Africa (%)
Place of birth for the foreign-born population - Australia (%)
Place of birth for the foreign-born population - New Zealand (%)
Place of birth for the foreign-born population - Fiji (%)
Place of birth for the foreign-born population - Micronesia (%)
Place of birth for the foreign-born population - Bahamas (%)
Place of birth for the foreign-born population - Barbados (%)
Place of birth for the foreign-born population - Cuba (%)
Place of birth for the foreign-born population - Dominica (%)
Place of birth for the foreign-born population - Dominican Republic (%)
Place of birth for the foreign-born population - Grenada (%)
Place of birth for the foreign-born population - Haiti (%)
Place of birth for the foreign-born population - Jamaica (%)
Place of birth for the foreign-born population - St. Vincent and the Grenadines (%)
Place of birth for the foreign-born population - Trinidad and Tobago (%)
Place of birth for the foreign-born population - West Indies (%)
Place of birth for the foreign-born population - Other Caribbean (%)
Place of birth for the foreign-born population - Belize (%)
Place of birth for the foreign-born population - Costa Rica (%)
Place of birth for the foreign-born population - El Salvador (%)
Place of birth for the foreign-born population - Guatemala (%)
Place of birth for the foreign-born population - Honduras (%)
Place of birth for the foreign-born population - Mexico (%)
Place of birth for the foreign-born population - Nicaragua (%)
Place of birth for the foreign-born population - Panama (%)
Place of birth for the foreign-born population - Other Central America (%)
Place of birth for the foreign-born population - Argentina (%)
Place of birth for the foreign-born population - Bolivia (%)
Place of birth for the foreign-born population - Brazil (%)
Place of birth for the foreign-born population - Chile (%)
Place of birth for the foreign-born population - Colombia (%)
Place of birth for the foreign-born population - Ecuador (%)
Place of birth for the foreign-born population - Guyana (%)
Place of birth for the foreign-born population - Peru (%)
Place of birth for the foreign-born population - Uruguay (%)
Place of birth for the foreign-born population - Venezuela (%)
Place of birth for the foreign-born population - Other South America (%)
Place of birth for the foreign-born population - Canada (%)
Place of birth for the foreign-born population - Other Northern America (%)
Place of birth for the foreign-born population - Other (%)
Latest news about races in Concord, MO collected exclusively by city-data.com from local newspapers, TV, and radio stations
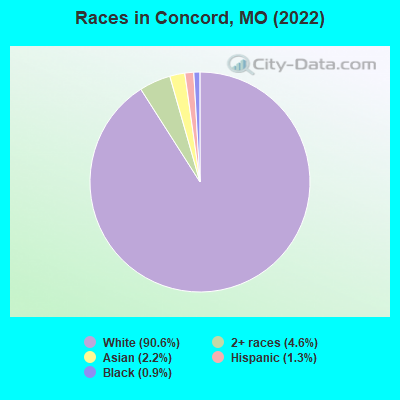
According to 2022 data, the most numerous races in Concord, MO are White alone (16,692 residents), Black alone (175 residents), and Two or more races (845 residents). 90.7% of Concord residents speak English at home. 5.4% of Concord, MO residents are foreign-born (3.3% born in Europe, 1.7% born in Asia), which is 26.3% greater than the foreign-born rate of 4.0% across the entire state of Missouri.
Race distribution in Concord
2000 2022
4,686,474 83.8% White alone 625,667 11.2% Black alone 118,592 2.1% Hispanic 71,905 1.3% Two or more races 61,041 1.1% Asian alone 23,302 0.4% American Indian alone 5,291 0.09% Other race alone 2,939 0.05% Native Hawaiian and Other
4,733,411 76.6% White alone 656,739 10.6% Black alone 316,300 5.1% Two or more races 291,763 4.7% Hispanic 132,436 2.1% Asian alone 27,467 0.4% Other race alone 12,313 0.2% American Indian alone 7,528 0.1% Native Hawaiian and Other
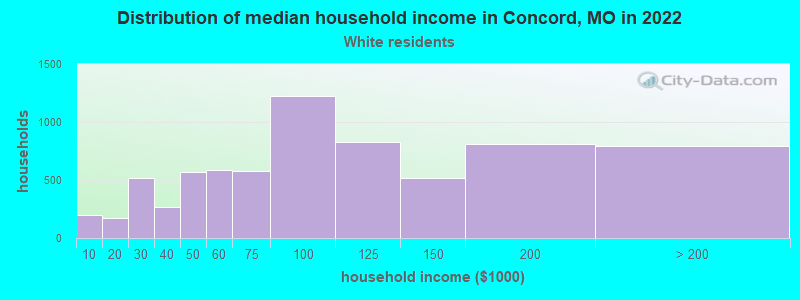
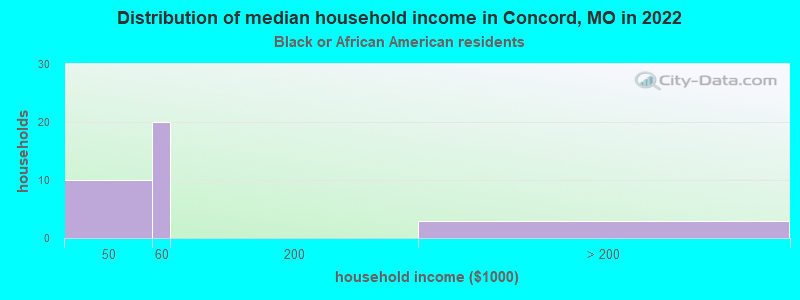
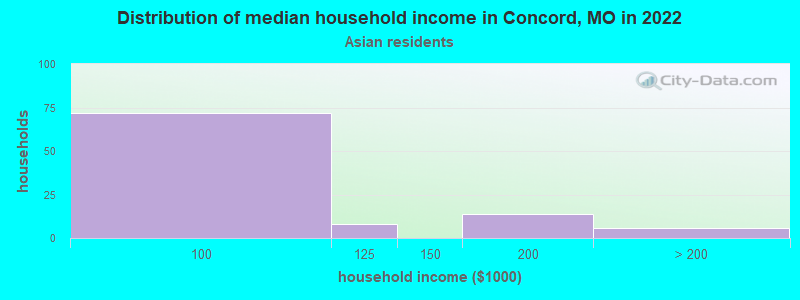
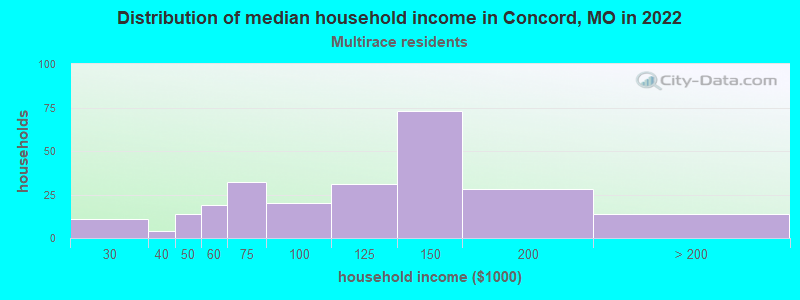
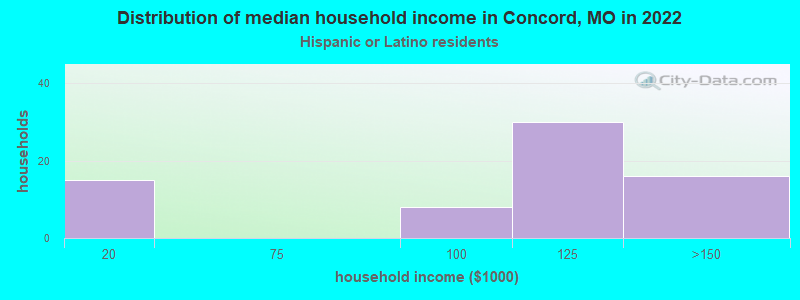
Income and house value in Concord Median household income in 2022 $86,388 White non-Hispanic householders$58,535 Black householders$96,122 Asian householders$103,815 Two or more races householders$118,832 Hispanic or Latino race householdersMedian 2022 house value $284,129 White Non-Hispanic householders $159,743 Asian householders$239,614 Two or more races householders$399,357 Hispanic or Latino householders
Median age by race in Concord
45.1 Median age for White residents43.6 46.9 29.7 Median age for Black or African American residents38.0 -708,675,798.4 -520,187,792.9 Median age for American Indian / Alaska Native residents-644,003,776.5 -505,494,505.0 34.0 Median age for Asian residents30.3 52.6 -710,303,029.6 Median age for Native Hawaiian / Pacific Islander residents-1,449,781,657.9 -752,136,751.4 -630,011,454.1 Median age for Other race residents-623,582,765.8 -652,431,790.6 35.9 Median age for Two or more races residents40.9 21.8 45.2 Median age for White alone residents43.7 47.3 16.7 Median age for Hispanic or Latino residents21.6 16.7
Owner/renter occupied households by race in Concord
House owners and renters - White residents 6,178 86.9% Owner occupied932 13.1% Renter occupiedHouse owners and renters - Black or African American residents 16 48.1% Owner occupied18 51.9% Renter occupiedHouse owners and renters - American Indian / Alaska Native residents 11 100.0% Owner occupiedHouse owners and renters - Asian residents 44 44.6% Owner occupied55 55.4% Renter occupiedHouse owners and renters - Other race residents 26 100.0% Renter occupiedHouse owners and renters - Two or more races residents 243 94.2% Owner occupied15 5.8% Renter occupiedHouse owners and renters - White alone residents 6,194 86.9% Owner occupied937 13.1% Renter occupiedHouse owners and renters - Hispanic or Latino residents 18 33.0% Owner occupied37 67.0% Renter occupied
Language usage in Concord
English speakers - Total 90.7% of residents of Concord speak English at home.
1.9% of residents speak Spanish at home 261 76.5% Speak English very well80 23.5% Speak English less than very well7.3% of residents speak other language at home 861 67.5% Speak English very well415 32.5% Speak English less than very well
English speakers - Born in the United States 93.6% of residents of Concord speak English at home.
4.1% of residents speak Spanish at home 131 100.0% Speak English very well1.8% of residents speak other language at home 52 89.7% Speak English very well6 10.3% Speak English less than very well
English speakers - Native, born elsewhere 22.0% of residents of Concord speak English at home.
109.8% of residents speak other language at home 204 75.6% Speak English very well66 24.4% Speak English less than very well
English speakers - Foreign-born 17.8% of residents of Concord speak English at home.
5.1% of residents speak Spanish at home 52 100.0% Speak English very well75.2% of residents speak other language at home 466 61.0% Speak English very well298 39.0% Speak English less than very well
White (Caucasian) - Speak only English Native:
95.9% (14,718)Foreign-born:
14.3% (96)
White (Caucasian) - Speak another language Native:
4.0% (617)Foreign-born:
87.4% (584)
American Indian / Alaska Native - Speak only English Native:
91.2% (12)Foreign-born:
100.0% (10)
Asian - Speak only English Native:
48.1% (96)Foreign-born:
19.7% (42)
Asian - Speak another language Native:
49.9% (100)Foreign-born:
81.2% (172)
Two or more races - Speak another language Native:
0.6% (5)Foreign-born:
100.0% (12)
White alone - Speak only English Native:
96.4% (14,766)Foreign-born:
14.5% (98)
White alone - Speak another language Native:
3.6% (551)Foreign-born:
87.4% (590)
Hispanic or Latino - Speak only English Native:
32.6% (51)Foreign-born:
21.6% (14)
Hispanic or Latino - Speak another language Native:
58.2% (91)Foreign-born:
75.7% (49)
Foreign-born residents in Concord 1,001 residents are foreign born (3.3% Europe , 1.7% Asia ).
This city:
5.4%Missouri:
4.2%
Marital status for residents in Concord Marital status - White (Caucasian) population 15 years and over
Males 28.0% Never married56.0% Now married0.1% Separated3.9% Widowed11.9% DivorcedFemales 24.4% Never married49.6% Now married1.7% Separated13.7% Widowed10.7% DivorcedWomen who gave birth in the past 12 months Now married:
57.7% (118)Unmarried:
42.3% (87)
Women who did not give birth in the past 12 months Now married:
40.6% (1,288)Unmarried:
59.4% (1,882)
Marital status - Black or African American population 15 years and over
Males 81.2% Never married18.8% Now married0.0% Separated0.0% Widowed0.0% DivorcedFemales 0.0% Never married100.0% Now married0.0% Separated0.0% Widowed0.0% DivorcedWomen who did not give birth in the past 12 months Now married:
100.0% (3)Unmarried:
0.0% (0)
Marital status - American Indian / Alaska Native population 15 years and over
Males 100.0% Never married0.0% Now married0.0% Separated0.0% Widowed0.0% DivorcedFemales 0.0% Never married100.0% Now married0.0% Separated0.0% Widowed0.0% DivorcedWomen who did not give birth in the past 12 months Now married:
100.0% (13)Unmarried:
0.0% (0)
Marital status - Asian population 15 years and over
Males 62.4% Never married32.0% Now married0.0% Separated0.0% Widowed5.7% DivorcedFemales 14.6% Never married47.9% Now married0.0% Separated6.3% Widowed31.3% DivorcedWomen who did not give birth in the past 12 months Now married:
56.5% (41)Unmarried:
43.5% (32)
Marital status - Other race population 15 years and over
Males 100.0% Never married0.0% Now married0.0% Separated0.0% Widowed0.0% DivorcedFemales 0.0% Never married100.0% Now married0.0% Separated0.0% Widowed0.0% DivorcedWomen who did not give birth in the past 12 months Now married:
100.0% (32)Unmarried:
0.0% (0)
Marital status - Two or more races population 15 years and over
Males 38.3% Never married57.9% Now married0.0% Separated0.0% Widowed3.8% DivorcedFemales 57.0% Never married34.2% Now married0.0% Separated2.8% Widowed6.0% DivorcedWomen who did not give birth in the past 12 months Now married:
24.8% (72)Unmarried:
75.2% (220)
Marital status - White alone, not Hispanic / Latino population 15 years and over
Males 28.1% Never married56.0% Now married0.1% Separated3.9% Widowed11.9% DivorcedFemales 24.0% Never married49.8% Now married1.7% Separated13.7% Widowed10.7% DivorcedWomen who gave birth in the past 12 months Now married:
57.7% (119)Unmarried:
42.3% (87)
Women who did not give birth in the past 12 months Now married:
41.1% (1,298)Unmarried:
58.9% (1,858)
Marital status - Hispanic or Latino population 15 years and over
Males 53.3% Never married33.3% Now married0.0% Separated0.0% Widowed13.3% DivorcedFemales 47.1% Never married52.9% Now married0.0% Separated0.0% Widowed0.0% DivorcedWomen who did not give birth in the past 12 months Now married:
47.4% (39)Unmarried:
52.6% (43)
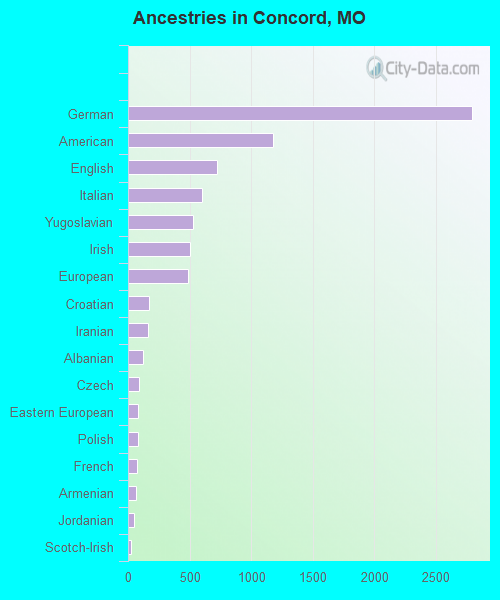
Ancestries in Concord
2,792 32.1% German1,178 13.5% American720 8.3% English603 6.9% Italian526 6.0% Yugoslavian504 5.8% Irish488 5.6% European168 1.9% Croatian166 1.9% Iranian124 1.4% Albanian88 1.0% Czech79 0.9% Eastern European79 0.9% Polish76 0.9% French61 0.7% Armenian45 0.5% Jordanian27 0.3% Scotch-Irish24 0.3% Scottish23 0.3% Ukrainian22 0.3% Palestinian22 0.3% British22 0.3% Romanian21 0.2% Canadian21 0.2% Dutch21 0.2% Hungarian21 0.2% Serbian18 0.2% Norwegian16 0.2% Russian14 0.2% Austrian11 0.1% French Canadian11 0.1% Northern European9 0.1% Greek8 0.09% Scandinavian7 0.08% Swiss7 0.08% Welsh
Children Nativity (place of birth) in Concord
Children under 6 years - Living with two parents Both parents native 640 100.0% NativeBoth parents foreign-born 108 100.0% NativeOne native, one foreign-born parent 75 100.0% NativeChildren under 6 years - Living with one parent Native parent 273 100.0% NativeForeign-born parent 23 100.0% NativeChildren 6 to 17 years - Living with two parents Both parents native 1,531 98.7% Native21 1.3% Foreign-bornBoth parents foreign-born 115 100.0% NativeOne native, one foreign-born parent 125 100.0% NativeChildren 6 to 17 years - Living with one parent Native parent 758 100.0% NativeForeign-born parent 36 48.6% Native38 51.4% Foreign-born
Grandparents responsible for own grandchildren in Concord
Grandparents (30 to 59 years) White / Caucasian 24 100.0% Not responsible for grandchildrenBlack or African American 5 100.0% Not responsible for grandchildrenAsian 79 100.0% Responsible for grandchildrenWhite alone, not Hispanic / Latino 24 100.0% Not responsible for grandchildren
Grandparents (60 years and over) White / Caucasian 29 100.0% Not responsible for grandchildrenWhite alone, not Hispanic / Latino 29 100.0% Not responsible for grandchildren