Colonia, NJ (New Jersey) Houses and Residents
| Colonia: | $469,803 |
| New Jersey: | $428,900 |
Mean price in 2022:
Detached houses: $457,017
Here: $457,017 State: $537,591 Townhouses or other attached units: $623,324
Here: $623,324 State: $381,113 In 2-unit structures: $367,310
Here: $367,310 State: $444,476
Total population: 17,795 (Urban population: 17,756, Rural population: 0)
Houses: 6,395 (6,269 occupied: 5,649 owner occupied, 672 renter occupied)
| % of renters here: | 11% |
| State: | 35% |
Housing density: 1,649 houses/condos per square mile
Median price asked for vacant for-sale houses and condos in 2022: $1,027,737.
Median contract rent in 2022: $1,685 (lower quartile is $1,313, upper quartile is over $2,000)
Median rent asked for vacant for-rent units in 2022: $1,582
Median gross rent in Colonia, NJ in 2022: $1,761
Housing units in Colonia with a mortgage: 3,487 (530 second mortgage, 7 home equity loan, 520 both second mortgage and home equity loan)
Houses without a mortgage: 223
Median household income for houses/condos with a mortgage: $156,918
Median household income for apartments without a mortgage: $87,351
Median monthly housing costs: $2,076
Compare current foreclosures in Colonia, NJ:
| Photo | Address | Area | Beds / Baths | Price | Details |
|---|---|---|---|---|---|

|
#1
Florence Ave
Colonia, NJ 07067
|
1,930 sq. feet
|
2 baths 3 beds |
$599,900
|
show details |

|
#2
Fairview Ave
Colonia, NJ 07067
|
932 sq. feet
|
- baths - beds |
show details | |

|
#3
Marlboro Ln
Colonia, NJ 07067
|
1,537 sq. feet
|
- baths - beds |
show details | |

|
#4
Cleveland Ave
Colonia, NJ 07067
|
1,196 sq. feet
|
- baths - beds |
show details | |

|
#5
Mcfarlane Rd
Colonia, NJ 07067
|
1,229 sq. feet
|
- baths - beds |
show details | |

|
#6
Hayes Ave
Colonia, NJ 07067
|
- sq. feet
|
- baths - beds |
show details | |

|
#7
Woods Ln
Colonia, NJ 07067
|
7,542 sq. feet
|
- baths - beds |
show details | |

|
#8
Princeton Ave
Colonia, NJ 07067
|
3,390 sq. feet
|
- baths - beds |
show details | |

|
#9
E Locust Ave
Colonia, NJ 07067
|
- sq. feet
|
- baths - beds |
show details | |

|
#10
Florence Ave
Colonia, NJ 07067
|
732 sq. feet
|
- baths - beds |
show details |
| Photo | Address | Area | Beds / Baths | Price | Details |
|---|---|---|---|---|---|

|
#11
Cleveland Ave
Colonia, NJ 07067
|
- sq. feet
|
- baths - beds |
show details | |

|
#12
Highland Rd
Colonia, NJ 07067
|
- sq. feet
|
- baths - beds |
show details | |

|
#13
Inman Ave # 2
Colonia, NJ 07067
|
- sq. feet
|
- baths - beds |
show details | |

|
#14
East St
Colonia, NJ 07067
|
- sq. feet
|
- baths - beds |
show details | |

|
#15
S Middlesex Ave
Colonia, NJ 07067
|
- sq. feet
|
- baths - beds |
show details | |

|
#16
New Dover Rd
Colonia, NJ 07067
|
- sq. feet
|
- baths - beds |
show details | |

|
#17
E Cliff Rd
Colonia, NJ 07067
|
- sq. feet
|
- baths - beds |
show details | |

|
#18
Cedar St
Colonia, NJ 07067
|
- sq. feet
|
- baths - beds |
show details | |

|
#19
W Cedar St
Colonia, NJ 07067
|
- sq. feet
|
- baths - beds |
show details | |

|
#20
S Hill Rd
Colonia, NJ 07067
|
- sq. feet
|
- baths - beds |
show details |
| Photo | Address | Area | Beds / Baths | Price | Details |
|---|---|---|---|---|---|

|
#21
N High St
Colonia, NJ 07067
|
- sq. feet
|
- baths - beds |
show details | |

|
#22
Ridge Rd
Colonia, NJ 07067
|
- sq. feet
|
- baths - beds |
show details | |

|
#23
Joanna Pl
Colonia, NJ 07067
|
- sq. feet
|
- baths - beds |
show details | |

|
#24
Phoebe Ct
Colonia, NJ 07067
|
- sq. feet
|
- baths - beds |
show details | |

|
#25
Longfellow Dr
Colonia, NJ 07067
|
- sq. feet
|
- baths - beds |
show details | |

|
#26
Ridge Rd
Colonia, NJ 07067
|
- sq. feet
|
- baths - beds |
show details | |

|
#27
Jeffery Rd
Colonia, NJ 07067
|
- sq. feet
|
- baths - beds |
show details | |

|
#28
Albemarle Rd
Colonia, NJ 07067
|
- sq. feet
|
- baths - beds |
show details | |

|
#29
Pine Tree Dr
Colonia, NJ 07067
|
- sq. feet
|
- baths - beds |
show details | |

|
#30
Linda Ave
Colonia, NJ 07067
|
- sq. feet
|
- baths - beds |
show details |
| Photo | Address | Area | Beds / Baths | Price | Details |
|---|---|---|---|---|---|

|
#31
Montrose Ave
Colonia, NJ 07067
|
- sq. feet
|
- baths - beds |
show details | |

|
#32
Westminster Rd
Colonia, NJ 07067
|
- sq. feet
|
- baths - beds |
show details | |

|
#33
Hawthorne Ave
Colonia, NJ 07067
|
- sq. feet
|
- baths - beds |
show details | |

|
#34
Cypress Dr
Colonia, NJ 07067
|
- sq. feet
|
- baths - beds |
show details | |

|
#35
Brookside Ct
Colonia, NJ 07067
|
- sq. feet
|
- baths - beds |
show details | |

|
#36
Brookside Ct
Colonia, NJ 07067
|
- sq. feet
|
- baths - beds |
show details | |

|
#37
W Hill Rd
Colonia, NJ 07067
|
- sq. feet
|
- baths - beds |
show details | |

|
#38
Kimberly Rd
Colonia, NJ 07067
|
- sq. feet
|
- baths - beds |
show details | |

|
#39
Hawthorne Ave
Colonia, NJ 07067
|
- sq. feet
|
- baths - beds |
show details | |

|
#40
Fairview Ave
Colonia, NJ 07067
|
- sq. feet
|
- baths - beds |
show details |
| Photo | Address | Area | Beds / Baths | Price | Details |
|---|---|---|---|---|---|

|
#41
Arthur Ave
Colonia, NJ 07067
|
- sq. feet
|
- baths - beds |
show details | |

|
#42
Sherold Rd
Colonia, NJ 07067
|
- sq. feet
|
- baths - beds |
show details | |

|
#43
Devon Rd
Colonia, NJ 07067
|
- sq. feet
|
- baths - beds |
show details | |

|
#44
Bonnie Ln
Colonia, NJ 07067
|
- sq. feet
|
- baths - beds |
show details | |

|
#45
Mercury Ave
Colonia, NJ 07067
|
- sq. feet
|
- baths - beds |
show details | |

|
#46
Lincoln Ave
Colonia, NJ 07067
|
- sq. feet
|
- baths - beds |
show details | |

|
#47
W Hill Rd
Colonia, NJ 07067
|
- sq. feet
|
- baths - beds |
show details | |

|
#48
Dewey Ave
Colonia, NJ 07067
|
- sq. feet
|
- baths - beds |
show details | |

|
Check over 1 million property listings on Foreclosure.com!
|
browse all offers | |||

Latest news about housing in Colonia, NJ collected exclusively by city-data.com from local newspapers, TV, and radio stations

 | buying a Mobile home/Trailer in NJ. dont laugh (29 replies) |
| Place in NJ with affordable rental apartments (15 replies) |
| Cranford Condos (17 replies) |
| Where could I potentially live? (54 replies) |
| Looking for home in Central NJ (Metuchen, Colonia, Matawan, Edison, etc.) (8 replies) |
| moving to Colonia NJ (8 replies) |
Median year apartment built: 1971
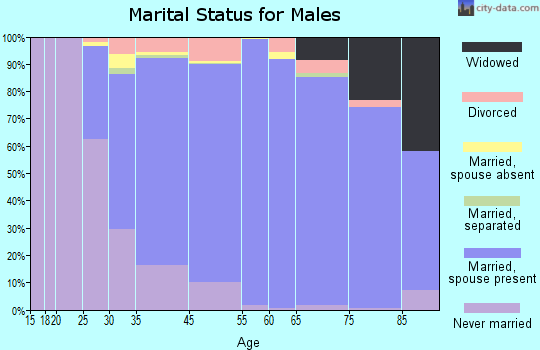
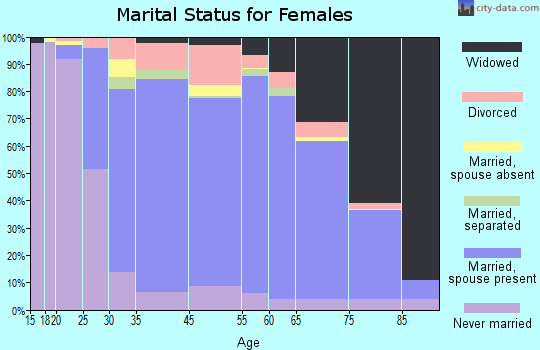
Household type by relationship:
Households: 18,608- Male householders: 2,989 (299 living alone), Female householders: 3,239 (612 living alone)
4,020 spouses (4,010 opposite-sex spouses), 244 unmarried partners, (244 opposite-sex unmarried partners), 6,069 children (5,778 natural, 62 adopted, 229 stepchildren), 258 grandchildren, 90 brothers or sisters, 840 parents, 0 foster children, 408 other relatives, 437 non-relatives
- In group quarters: 9
Size of family households: 1,990 2-persons, 962 3-persons, 1,125 4-persons, 467 5-persons, 356 6-persons, 79 7-or-more-persons.
Size of nonfamily households: 927 1-person, 331 2-persons, 100 3-persons.
2,868 married couples with children.
637 single-parent households (46 men, 591 women).
66.8% of residents of Colonia speak English at home.
7.0% of residents speak Spanish at home (71% speak English very well, 11% speak English well, 12% speak English not well, 6% don't speak English at all).
22.6% of residents speak other Indo-European language at home (64% speak English very well, 18% speak English well, 17% speak English not well, 1% don't speak English at all).
2.4% of residents speak Asian or Pacific Island language at home (64% speak English very well, 24% speak English well, 12% speak English not well).
1.2% of residents speak other language at home (71% speak English very well, 29% speak English well).
Foreign born population: 5,020 (27.0%)
(74.8% of them are naturalized citizens)
| Here: | 7.1 |
| State: | 6.8 |
| Here: | 3.6 |
| State: | 3.9 |
- Bedrooms in owner-occupied houses and condos in Colonia, New Jersey
- 56no bedroom
- 01 bedroom
- 3382 bedrooms
- 2,6133 bedrooms
- 2,1384 bedrooms
- 5045+ bedrooms
- Bedrooms in renter-occupied apartments in Colonia, New Jersey
- 11no bedroom
- 3051 bedroom
- 1712 bedrooms
- 1213 bedrooms
- 654 bedrooms
- 05+ bedrooms
- Cars and other vehicles available in Colonia in owner-occupied houses/condos
- 190no vehicle
- 1,1291 vehicle
- 2,7272 vehicles
- 1,0603 vehicles
- 4484 vehicles
- 955+ vehicles
- Cars and other vehicles available in Colonia in renter-occupied apartments
- 52no vehicle
- 2461 vehicle
- 3582 vehicles
- 173 vehicles
- 04 vehicles
- 05+ vehicles
- Rooms in owner-occupied houses in Colonia, New Jersey
- 231 room
- 02 rooms
- 653 rooms
- 724 rooms
- 6735 rooms
- 1,3926 rooms
- 9867 rooms
- 1,3968 rooms
- 1,0439+ rooms
- Rooms in renter-occupied apartments in Colonia, New Jersey
- 111 room
- 832 rooms
- 2073 rooms
- 1554 rooms
- 1055 rooms
- 646 rooms
- 377 rooms
- 118 rooms
- 09+ rooms
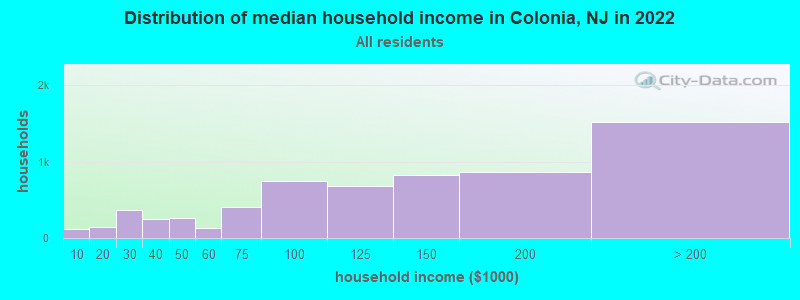
Colonia, NJ household income distribution

- 121Less than $10,000
- 139$10,000 to $19,999
- 368$20,000 to $29,999
- 248$30,000 to $39,999
- 262$40,000 to $49,999
- 137$50,000 to $59,999
- 401$60,000 to $74,999
- 748$75,000 to $99,999
- 678$100,000 to $124,999
- 822$125,000 to $149,999
- 859$150,000 to $199,999
- 1,521$200,000 or more
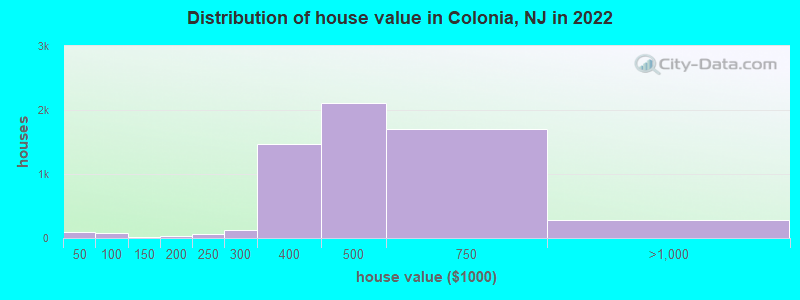
Home value of owner - occupied houses in 2022 in Colonia, NJ
-
- 47Less than $10,000
- 10$35,000 to $39,999
- 40$40,000 to $49,999
- 24$50,000 to $59,999
- 3$80,000 to $89,999
- 2$90,000 to $99,999
- 12$100,000 to $124,999
- 5$125,000 to $149,999
- 33$175,000 to $199,999
- 54$200,000 to $249,999
- 131$250,000 to $299,999
- 1,464$300,000 to $399,999
- 2,101$400,000 to $499,999
- 1,701$500,000 to $749,999
- 247$750,000 to $999,999
- 9$1,000,000 to $1,499,999
- 16$1,500,000 to $1,999,999
- 10$2,000,000 or more
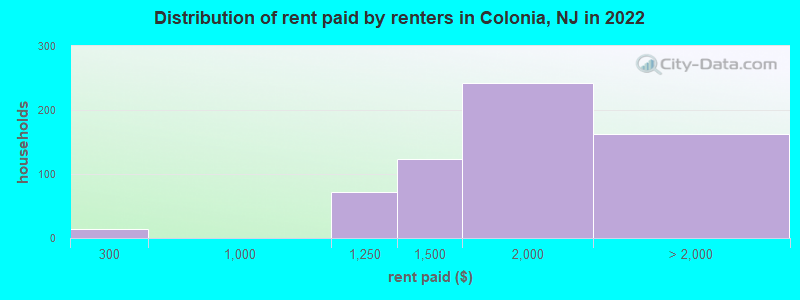
Rent paid by renters in 2022 in Colonia, NJ
-
- 13$200 to $249
- 71$1,000 to $1,249
- 123$1,250 to $1,499
- 242$1,500 to $1,999
- 133$2,000 to $2,499
- 9$3,000 to $3,499
- 20No cash rent
Percentage of workers working in this county: 49.5%
Number of people working at home: 1,330 (13.9% of all workers)
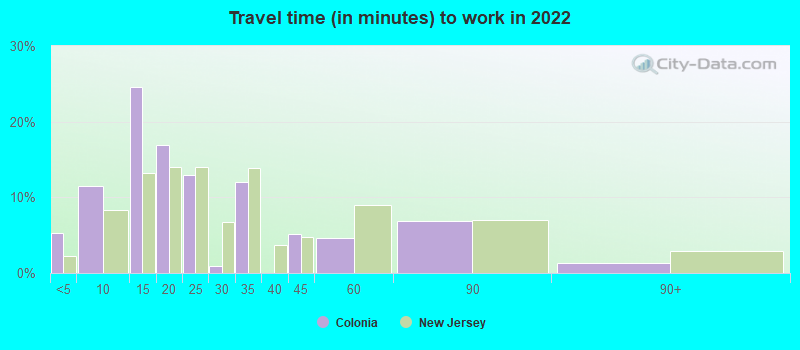
Travel time to work (commute)
- Less than 5 minutes: 145
- 5 to 9 minutes: 447
- 10 to 14 minutes: 938
- 15 to 19 minutes: 965
- 20 to 24 minutes: 974
- 25 to 29 minutes: 590
- 30 to 34 minutes: 1,557
- 35 to 39 minutes: 262
- 40 to 44 minutes: 259
- 45 to 59 minutes: 1,169
- 60 to 89 minutes: 588
- 90 or more minutes: 274
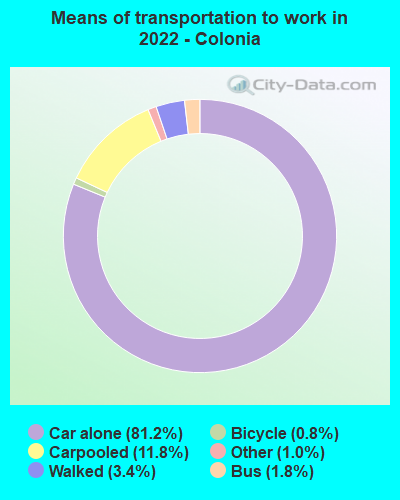
Means of transportation to work:
- Drove a car alone: 1,415 (47.4%)
- Carpooled: 244 (8.2%)
- Bus: 13 (0.4%)
- Taxi: 24 (0.8%)
- Bicycle: 15 (0.5%)
- Walked: 87 (2.9%)
- Worked at home: 1,330 (44.6%)
- Unemployment by race in 2022
- Unemployment rate for White non-Hispanic residents
- 0.4%Males
- 2.3%Females
- Unemployment rate for Black residents
- 34.8%Females
- Unemployment rate for Asian residents
- 4.1%Females
- Unemployment rate for other race residents
- 13.9%Males
- 11.4%Females
- Unemployment rate for two or more race residents
- 5.0%Males
- Unemployment rate for Hispanic or Latino residents
- 3.6%Males
- 1.8%Females
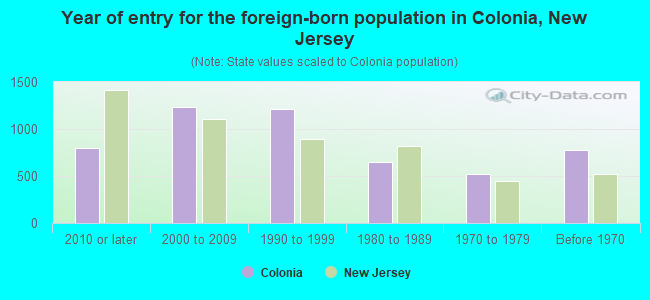
- Year of entry for the foreign-born population in Colonia, New Jersey
- 8032010 or later
- 1,2322000 to 2009
- 1,2111990 to 1999
- 6521980 to 1989
- 5231970 to 1979
- 780Before 1970
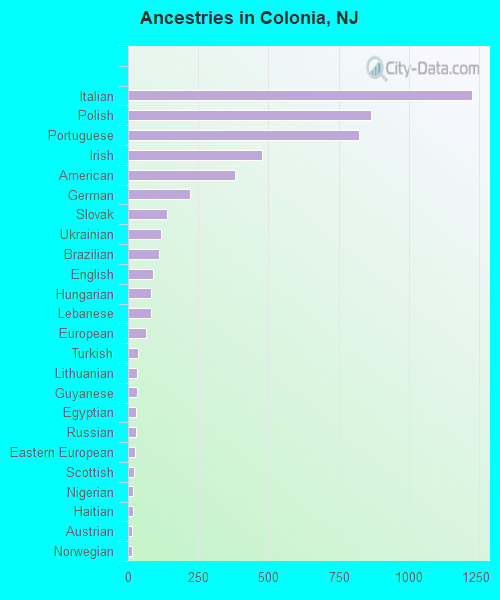
First ancestries reported:
- Italian: 1,224 (13.2%)
- Polish: 864 (9.3%)
- Portuguese: 824 (8.9%)
- Irish: 476 (5.1%)
- American: 381 (4.1%)
- German: 219 (2.4%)
- Slovak: 138 (1.5%)
- Ukrainian: 116 (1.3%)
- Brazilian: 111 (1.2%)
- English: 88 (0.9%)
- Hungarian: 83 (0.9%)
- Lebanese: 81 (0.9%)
- European: 65 (0.7%)
- Turkish: 34 (0.4%)
- Lithuanian: 32 (0.3%)
- Guyanese: 32 (0.3%)
- Egyptian: 30 (0.3%)
- Russian: 27 (0.3%)
- Eastern European: 25 (0.3%)
- Scottish: 23 (0.2%)
- Nigerian: 17 (0.2%)
- Haitian: 17 (0.2%)
- Austrian: 15 (0.2%)
- Norwegian: 14 (0.2%)
- West Indian: 11 (0.1%)
- German Russian: 10 (0.1%)
- Romanian: 9 (0.10%)
- Croatian: 8 (0.09%)
- Trinidadian and Tobagonian: 8 (0.09%)
- Scotch-Irish: 7 (0.08%)
- French Canadian: 7 (0.08%)
- Czechoslovakian: 7 (0.08%)
- Slovene: 6 (0.06%)
- African: 6 (0.06%)
- Albanian: 6 (0.06%)
- Greek: 5 (0.05%)
Most common places of birth for foreign-born residents (%):
| Colonia: | 31.1% (1,519) |
| New Jersey: | 12.8% (274,609) |
| Colonia: | 10.5% (514) |
| New Jersey: | 2.3% (48,811) |
| Colonia: | 8.4% (408) |
| New Jersey: | 1.3% (28,871) |
| Colonia: | 5.2% (252) |
| New Jersey: | 2.1% (46,020) |
| Colonia: | 4.2% (206) |
| New Jersey: | 4.4% (95,275) |
| Colonia: | 3.6% (174) |
| New Jersey: | 9.7% (209,055) |
| Colonia: | 3.0% (147) |
| New Jersey: | 1.6% (33,678) |
| Colonia: | 2.6% (129) |
| New Jersey: | 4.0% (85,934) |
| Colonia: | 2.3% (113) |
| New Jersey: | 4.2% (90,817) |
| Colonia: | 2.3% (111) |
| New Jersey: | 0.8% (17,217) |
| Colonia: | 2.2% (109) |
| New Jersey: | 1.2% (26,173) |
| Colonia: | 2.2% (108) |
| New Jersey: | 0.2% (3,968) |
| Colonia: | 2.0% (100) |
| New Jersey: | 3.7% (78,969) |
| Colonia: | 1.9% (95) |
| New Jersey: | 1.1% (22,760) |
Place of birth for U.S.-born residents:
- This state: 10,828
- Other state: 2,352
- Northeast: 1,904
- Midwest: 145
- South: 210
- West: 95
94.3% of Colonia residents lived in the same house 1 years ago.
Out of people who lived in different houses, 36.3% lived in this county.
Out of people who lived in different counties, 78.0% lived in New Jersey.
| Colonia: | 94.3% |
| State average: | 90.4% |
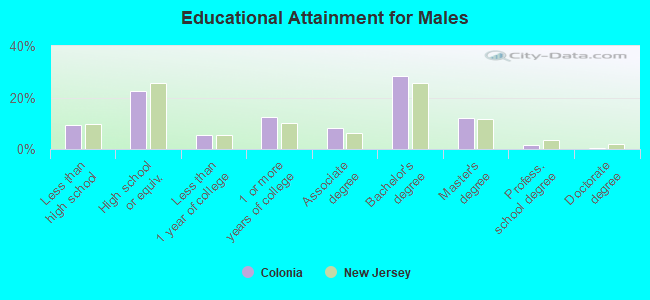
Education attainment for males 25 years and older:
- No schooling: 323
- Nursery to 4th grade: 0
- 5th and 6th grade: 0
- 7th and 8th grade: 5
- 9th grade: 24
- 10th grade: 69
- 11th grade: 10
- 12th grade, no diploma: 165
- High school graduate (or equivalency): 1,456
- Less than 1 year of college: 361
- Some college more than 1 year, no degree: 800
- Associate degree: 517
- Bachelor's degree: 1,843
- Master's degree: 780
- Professional school degree: 101
- Doctorate degree: 35
Education attainment for females 25 years and older:
- No schooling: 122
- Nursery to 4th grade: 0
- 5th and 6th grade: 8
- 7th and 8th grade: 116
- 9th grade: 8
- 10th grade: 53
- 11th grade: 87
- 12th grade, no diploma: 120
- High school graduate (or equivalency): 1,520
- Less than 1 year of college: 511
- Some college more than 1 year, no degree: 743
- Associate degree: 597
- Bachelor's degree: 2,029
- Master's degree: 918
- Professional school degree: 169
- Doctorate degree: 86

Housing units in structures:
- One, detached: 5,721
- One, attached: 110
- Two: 260
- 3 or 4: 11
- 10 to 19: 161
- 20 to 49: 43
- 50 or more: 87
House/condo owner moved in on average 18 years ago
Renter moved in on average 3 years ago
- 88.1%Utility gas
- 7.2%Fuel oil, kerosene, etc.
- 3.6%Electricity
- 0.8%Bottled, tank, or LP gas
- 0.4%Solar energy
- 79.3%Utility gas
- 19.0%Electricity
- 1.7%Fuel oil, kerosene, etc.
Private vs. public school enrollment:
| Here: | 4.5% |
| New Jersey: | 12.3% |
| Here: | 16.9% |
| New Jersey: | 13.1% |
| Here: | 28.2% |
| New Jersey: | 33.2% |