Races in Colonia, New Jersey (NJ) Detailed Stats
Data:
Races - White alone (%)
Races - White alone (% change since 2000)
Races - Black alone (%)
Races - Black alone (% change since 2000)
Races - American Indian alone (%)
Races - American Indian alone (% change since 2000)
Races - Asian alone (%)
Races - Asian alone (% change since 2000)
Races - Hispanic (%)
Races - Hispanic (% change since 2000)
Races - Native Hawaiian and Other Pacific Islander alone (%)
Races - Native Hawaiian and Other Pacific Islander alone (% change since 2000)
Races - Two or more races(%)
Races - Two or more races(% change since 2000)
Races - Other race alone (%)
Races - Other race alone (% change since 2000)
Racial diversity
Place of birth - Born in state of residence (%)
Place of birth - Born in state of residence (%) - White
Place of birth - Born in state of residence (%) - Black or African American
Place of birth - Born in state of residence (%) - Asian
Place of birth - Born in state of residence (%) - Hispanic or Latino
Place of birth - Born in state of residence (%) - American Indian and Alaska Native
Place of birth - Born in state of residence (%) - Multirace
Place of birth - Born in state of residence (%) - Other Race
Place of birth - Born in other state (%)
Place of birth - Born in other state (%) - White
Place of birth - Born in other state (%) - Black or African American
Place of birth - Born in other state (%) - Asian
Place of birth - Born in other state (%) - Hispanic or Latino
Place of birth - Born in other state (%) - American Indian and Alaska Native
Place of birth - Born in other state (%) - Multirace
Place of birth - Born in other state (%) - Other Race
Place of birth - Native, outside of US (%)
Place of birth - Native, outside of US (%) - White
Place of birth - Native, outside of US (%) - Black or African American
Place of birth - Native, outside of US (%) - Asian
Place of birth - Native, outside of US (%) - Hispanic or Latino
Place of birth - Native, outside of US (%) - American Indian and Alaska Native
Place of birth - Native, outside of US (%) - Multirace
Place of birth - Native, outside of US (%) - Other Race
Place of birth - Foreign born (%)
Place of birth - Foreign born (%) - White
Place of birth - Foreign born (%) - Black or African American
Place of birth - Foreign born (%) - Asian
Place of birth - Foreign born (%) - Hispanic or Latino
Place of birth - Foreign born (%) - American Indian and Alaska Native
Place of birth - Foreign born (%) - Multirace
Place of birth - Foreign born (%) - Other Race
Residents speaking English at home (%)
Residents speaking English at home - Born in the United States (%)
Residents speaking English at home - Native, born elsewhere (%)
Residents speaking English at home - Foreign born (%)
Residents speaking Spanish at home (%)
Residents speaking Spanish at home - Born in the United States (%)
Residents speaking Spanish at home - Native, born elsewhere (%)
Residents speaking Spanish at home - Foreign born (%)
Residents speaking other language at home (%)
Residents speaking other language at home - Born in the United States (%)
Residents speaking other language at home - Native, born elsewhere (%)
Residents speaking other language at home - Foreign born (%)
Marital status - Never married (%)
Marital status - Now married (%)
Marital status - Separated (%)
Marital status - Widowed (%)
Marital status - Divorced (%)
Ancestries Reported - Arab (%)
Ancestries Reported - Czech (%)
Ancestries Reported - Danish (%)
Ancestries Reported - Dutch (%)
Ancestries Reported - English (%)
Ancestries Reported - French (%)
Ancestries Reported - French Canadian (%)
Ancestries Reported - German (%)
Ancestries Reported - Greek (%)
Ancestries Reported - Hungarian (%)
Ancestries Reported - Irish (%)
Ancestries Reported - Italian (%)
Ancestries Reported - Lithuanian (%)
Ancestries Reported - Norwegian (%)
Ancestries Reported - Polish (%)
Ancestries Reported - Portuguese (%)
Ancestries Reported - Russian (%)
Ancestries Reported - Scotch-Irish (%)
Ancestries Reported - Scottish (%)
Ancestries Reported - Slovak (%)
Ancestries Reported - Subsaharan African (%)
Ancestries Reported - Swedish (%)
Ancestries Reported - Swiss (%)
Ancestries Reported - Ukrainian (%)
Ancestries Reported - United States (%)
Ancestries Reported - Welsh (%)
Ancestries Reported - West Indian (%)
Ancestries Reported - Other (%)
Geographical mobility - Same house 1 year ago (%)
Geographical mobility - Same house 1 year ago (%) - White
Geographical mobility - Same house 1 year ago (%) - Black or African American
Geographical mobility - Same house 1 year ago (%) - Asian
Geographical mobility - Same house 1 year ago (%) - Hispanic or Latino
Geographical mobility - Same house 1 year ago (%) - American Indian and Alaska Native
Geographical mobility - Same house 1 year ago (%) - Multirace
Geographical mobility - Same house 1 year ago (%) - Other Race
Geographical mobility - Moved within same county (%)
Geographical mobility - Moved within same county (%) - White
Geographical mobility - Moved within same county (%) - Black or African American
Geographical mobility - Moved within same county (%) - Asian
Geographical mobility - Moved within same county (%) - Hispanic or Latino
Geographical mobility - Moved within same county (%) - American Indian and Alaska Native
Geographical mobility - Moved within same county (%) - Multirace
Geographical mobility - Moved within same county (%) - Other Race
Geographical mobility - Moved from different county within same state (%)
Geographical mobility - Moved from different county within same state (%) - White
Geographical mobility - Moved from different county within same state (%) - Black or African American
Geographical mobility - Moved from different county within same state (%) - Asian
Geographical mobility - Moved from different county within same state (%) - Hispanic or Latino
Geographical mobility - Moved from different county within same state (%) - American Indian and Alaska Native
Geographical mobility - Moved from different county within same state (%) - Multirace
Geographical mobility - Moved from different county within same state (%) - Other Race
Geographical mobility - Moved from different state (%)
Geographical mobility - Moved from different state (%) - White
Geographical mobility - Moved from different state (%) - Black or African American
Geographical mobility - Moved from different state (%) - Asian
Geographical mobility - Moved from different state (%) - Hispanic or Latino
Geographical mobility - Moved from different state (%) - American Indian and Alaska Native
Geographical mobility - Moved from different state (%) - Multirace
Geographical mobility - Moved from different state (%) - Other Race
Geographical mobility - Moved from abroad (%)
Geographical mobility - Moved from abroad (%) - White
Geographical mobility - Moved from abroad (%) - Black or African American
Geographical mobility - Moved from abroad (%) - Asian
Geographical mobility - Moved from abroad (%) - Hispanic or Latino
Geographical mobility - Moved from abroad (%) - American Indian and Alaska Native
Geographical mobility - Moved from abroad (%) - Multirace
Geographical mobility - Moved from abroad (%) - Other Race
Place of birth for the foreign-born population - Ireland (%)
Place of birth for the foreign-born population - Denmark (%)
Place of birth for the foreign-born population - Norway (%)
Place of birth for the foreign-born population - Sweden (%)
Place of birth for the foreign-born population - United Kingdom (%)
Place of birth for the foreign-born population - England (%)
Place of birth for the foreign-born population - Scotland (%)
Place of birth for the foreign-born population - Other Northern Europe (%)
Place of birth for the foreign-born population - Austria (%)
Place of birth for the foreign-born population - Belgium (%)
Place of birth for the foreign-born population - France (%)
Place of birth for the foreign-born population - Germany (%)
Place of birth for the foreign-born population - Netherlands (%)
Place of birth for the foreign-born population - Switzerland (%)
Place of birth for the foreign-born population - Other Western Europe (%)
Place of birth for the foreign-born population - Greece (%)
Place of birth for the foreign-born population - Italy (%)
Place of birth for the foreign-born population - Portugal (%)
Place of birth for the foreign-born population - Spain (%)
Place of birth for the foreign-born population - Other Southern Europe (%)
Place of birth for the foreign-born population - Albania (%)
Place of birth for the foreign-born population - Belarus (%)
Place of birth for the foreign-born population - Bosnia and Herzegovina (%)
Place of birth for the foreign-born population - Bulgaria (%)
Place of birth for the foreign-born population - Croatia (%)
Place of birth for the foreign-born population - Czechoslovakia (%)
Place of birth for the foreign-born population - Hungary (%)
Place of birth for the foreign-born population - Latvia (%)
Place of birth for the foreign-born population - Lithuania (%)
Place of birth for the foreign-born population - North Macedonia (Macedonia) (%)
Place of birth for the foreign-born population - Moldova (%)
Place of birth for the foreign-born population - Poland (%)
Place of birth for the foreign-born population - Romania (%)
Place of birth for the foreign-born population - Russia (%)
Place of birth for the foreign-born population - Serbia (%)
Place of birth for the foreign-born population - Ukraine (%)
Place of birth for the foreign-born population - Other Eastern Europe (%)
Place of birth for the foreign-born population - China (%)
Place of birth for the foreign-born population - Hong Kong (%)
Place of birth for the foreign-born population - Taiwan (%)
Place of birth for the foreign-born population - Japan (%)
Place of birth for the foreign-born population - Korea (%)
Place of birth for the foreign-born population - Other Eastern Asia (%)
Place of birth for the foreign-born population - Afghanistan (%)
Place of birth for the foreign-born population - Bangladesh (%)
Place of birth for the foreign-born population - India (%)
Place of birth for the foreign-born population - Iran (%)
Place of birth for the foreign-born population - Kazakhstan (%)
Place of birth for the foreign-born population - Nepal (%)
Place of birth for the foreign-born population - Pakistan (%)
Place of birth for the foreign-born population - Sri Lanka (%)
Place of birth for the foreign-born population - Uzbekistan (%)
Place of birth for the foreign-born population - Other South Central Asia (%)
Place of birth for the foreign-born population - Burma (%)
Place of birth for the foreign-born population - Cambodia (%)
Place of birth for the foreign-born population - Indonesia (%)
Place of birth for the foreign-born population - Laos (%)
Place of birth for the foreign-born population - Malaysia (%)
Place of birth for the foreign-born population - Philippines (%)
Place of birth for the foreign-born population - Singapore (%)
Place of birth for the foreign-born population - Thailand (%)
Place of birth for the foreign-born population - Vietnam (%)
Place of birth for the foreign-born population - Other South Eastern Asia (%)
Place of birth for the foreign-born population - Armenia (%)
Place of birth for the foreign-born population - Iraq (%)
Place of birth for the foreign-born population - Israel (%)
Place of birth for the foreign-born population - Jordan (%)
Place of birth for the foreign-born population - Kuwait (%)
Place of birth for the foreign-born population - Lebanon (%)
Place of birth for the foreign-born population - Saudi Arabia (%)
Place of birth for the foreign-born population - Syria (%)
Place of birth for the foreign-born population - Turkey (%)
Place of birth for the foreign-born population - Yemen (%)
Place of birth for the foreign-born population - Other Western Asia (%)
Place of birth for the foreign-born population - Eritrea (%)
Place of birth for the foreign-born population - Ethiopia (%)
Place of birth for the foreign-born population - Kenya (%)
Place of birth for the foreign-born population - Somalia (%)
Place of birth for the foreign-born population - Uganda (%)
Place of birth for the foreign-born population - Zimbabwe (%)
Place of birth for the foreign-born population - Other Eastern Africa (%)
Place of birth for the foreign-born population - Cameroon (%)
Place of birth for the foreign-born population - Congo (%)
Place of birth for the foreign-born population - Democratic Republic of Congo (Zaire) (%)
Place of birth for the foreign-born population - Other Middle Africa (%)
Place of birth for the foreign-born population - Egypt (%)
Place of birth for the foreign-born population - Morocco (%)
Place of birth for the foreign-born population - Sudan (%)
Place of birth for the foreign-born population - Other Northern Africa (%)
Place of birth for the foreign-born population - South Africa (%)
Place of birth for the foreign-born population - Other Southern Africa (%)
Place of birth for the foreign-born population - Cabo Verde (%)
Place of birth for the foreign-born population - Ghana (%)
Place of birth for the foreign-born population - Liberia (%)
Place of birth for the foreign-born population - Nigeria (%)
Place of birth for the foreign-born population - Senegal (%)
Place of birth for the foreign-born population - Sierra Leone (%)
Place of birth for the foreign-born population - Other Western Africa (%)
Place of birth for the foreign-born population - Australia (%)
Place of birth for the foreign-born population - New Zealand (%)
Place of birth for the foreign-born population - Fiji (%)
Place of birth for the foreign-born population - Micronesia (%)
Place of birth for the foreign-born population - Bahamas (%)
Place of birth for the foreign-born population - Barbados (%)
Place of birth for the foreign-born population - Cuba (%)
Place of birth for the foreign-born population - Dominica (%)
Place of birth for the foreign-born population - Dominican Republic (%)
Place of birth for the foreign-born population - Grenada (%)
Place of birth for the foreign-born population - Haiti (%)
Place of birth for the foreign-born population - Jamaica (%)
Place of birth for the foreign-born population - St. Vincent and the Grenadines (%)
Place of birth for the foreign-born population - Trinidad and Tobago (%)
Place of birth for the foreign-born population - West Indies (%)
Place of birth for the foreign-born population - Other Caribbean (%)
Place of birth for the foreign-born population - Belize (%)
Place of birth for the foreign-born population - Costa Rica (%)
Place of birth for the foreign-born population - El Salvador (%)
Place of birth for the foreign-born population - Guatemala (%)
Place of birth for the foreign-born population - Honduras (%)
Place of birth for the foreign-born population - Mexico (%)
Place of birth for the foreign-born population - Nicaragua (%)
Place of birth for the foreign-born population - Panama (%)
Place of birth for the foreign-born population - Other Central America (%)
Place of birth for the foreign-born population - Argentina (%)
Place of birth for the foreign-born population - Bolivia (%)
Place of birth for the foreign-born population - Brazil (%)
Place of birth for the foreign-born population - Chile (%)
Place of birth for the foreign-born population - Colombia (%)
Place of birth for the foreign-born population - Ecuador (%)
Place of birth for the foreign-born population - Guyana (%)
Place of birth for the foreign-born population - Peru (%)
Place of birth for the foreign-born population - Uruguay (%)
Place of birth for the foreign-born population - Venezuela (%)
Place of birth for the foreign-born population - Other South America (%)
Place of birth for the foreign-born population - Canada (%)
Place of birth for the foreign-born population - Other Northern America (%)
Place of birth for the foreign-born population - Other (%)
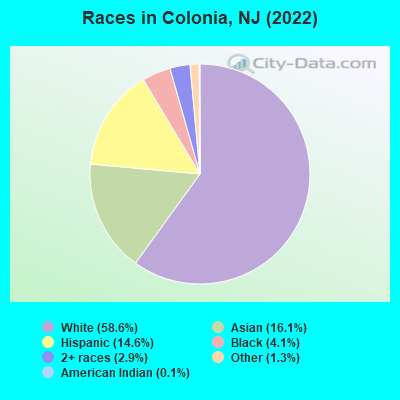
According to 2022 data, the most numerous races in Colonia, NJ are White alone (10,901 residents), Hispanic (2,711 residents), and Black alone (769 residents). 66.6% of Colonia residents speak English at home. 26.3% of Colonia, NJ residents are foreign-born (10.8% born in Asia, 8.3% born in Europe, 5.5% born in Latin America), which is 12.4% greater than the foreign-born rate of 23.0% across the entire state of New Jersey.
Race distribution in Colonia
2000 2022
5,557,209 66.0% White alone 1,117,191 13.3% Hispanic 1,096,171 13.0% Black alone 477,012 5.7% Asian alone 133,689 1.6% Two or more races 19,565 0.2% Other race alone 11,338 0.1% American Indian alone 2,175 0.03% Native Hawaiian and Other
4,766,476 51.5% White alone 2,028,470 21.9% Hispanic 1,111,632 12.0% Black alone 923,546 10.0% Asian alone 332,237 3.6% Two or more races 89,847 1.0% Other race alone 8,557 0.09% American Indian alone 934 0.01% Native Hawaiian and Other
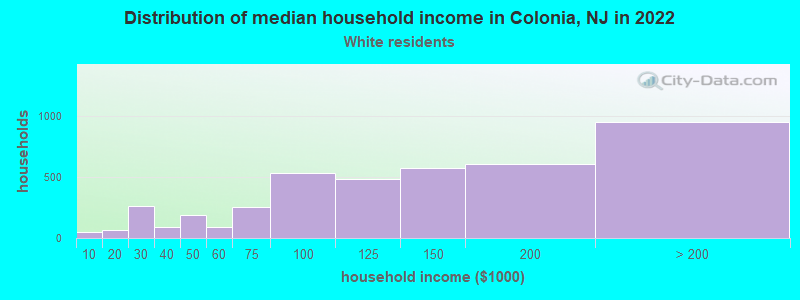
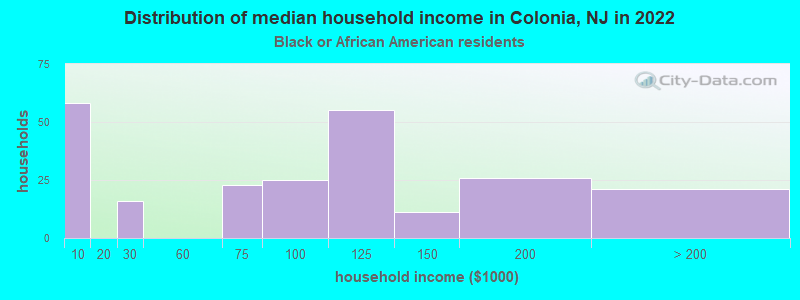
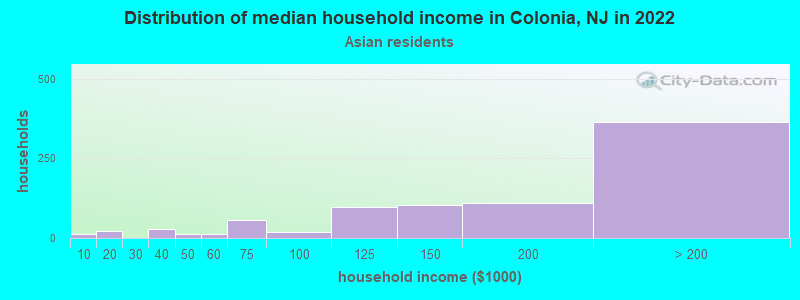
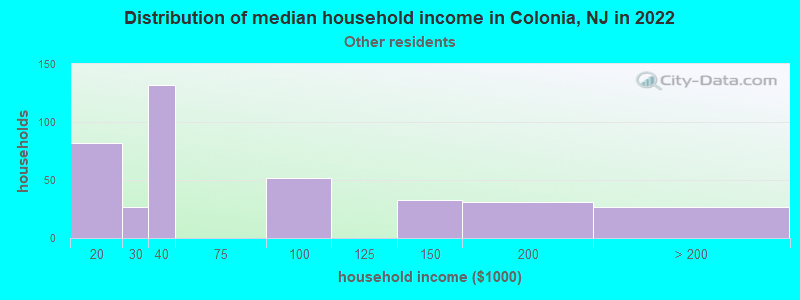
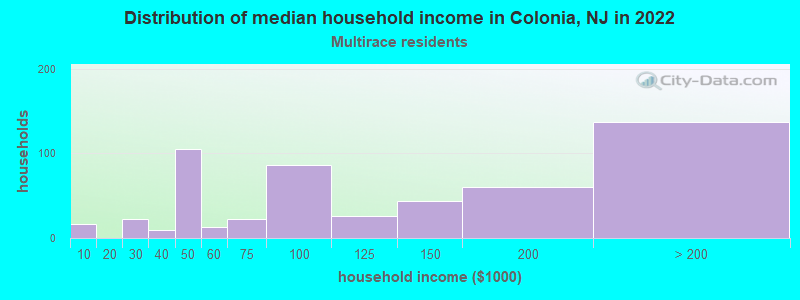
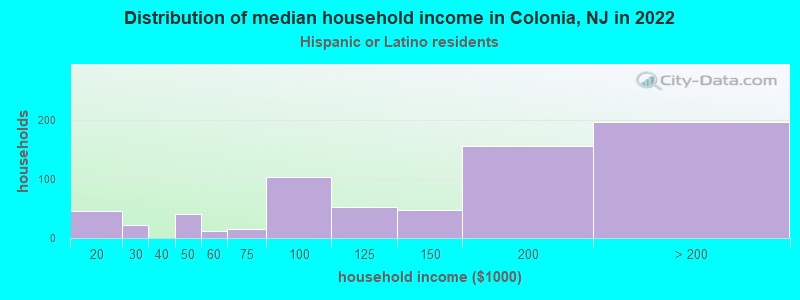
Income and house value in Colonia Median household income in 2022 $115,406 White non-Hispanic householders$105,422 Black householders$166,134 Asian householders$94,659 Two or more races householders$161,466 Hispanic or Latino race householdersMedian 2022 house value $466,954 White Non-Hispanic householders$464,882 Black or African American householders $501,917 Asian householders$480,162 Some other race householders$445,976 Two or more races householders$472,134 Hispanic or Latino householders
Median age by race in Colonia
50.6 Median age for White residents47.4 52.8 27.9 Median age for Black or African American residents22.7 42.4 36.9 Median age for American Indian / Alaska Native residents28.6 40.7 39.3 Median age for Asian residents39.8 36.4 -939,393,938.5 Median age for Native Hawaiian / Pacific Islander residents-860,335,194.7 -713,070,378.3 43.9 Median age for Other race residents34.8 44.1 35.1 Median age for Two or more races residents31.1 33.8 50.0 Median age for White alone residents49.2 50.9 34.0 Median age for Hispanic or Latino residents26.9 36.8
Owner/renter occupied households by race in Colonia
House owners and renters - White residents 4,041 94.1% Owner occupied255 5.9% Renter occupiedHouse owners and renters - Black or African American residents 95 40.6% Owner occupied139 59.4% Renter occupiedHouse owners and renters - American Indian / Alaska Native residents 12 100.0% Owner occupiedHouse owners and renters - Asian residents 765 89.1% Owner occupied94 10.9% Renter occupiedHouse owners and renters - Other race residents 295 80.4% Owner occupied72 19.6% Renter occupiedHouse owners and renters - Two or more races residents 471 86.5% Owner occupied73 13.5% Renter occupiedHouse owners and renters - White alone residents 3,974 93.0% Owner occupied298 7.0% Renter occupiedHouse owners and renters - Hispanic or Latino residents 656 85.5% Owner occupied112 14.5% Renter occupied
Language usage in Colonia
English speakers - Total 66.6% of residents of Colonia speak English at home.
7.2% of residents speak Spanish at home 889 69.8% Speak English very well384 30.2% Speak English less than very well26.0% of residents speak other language at home 2,974 64.5% Speak English very well1,634 35.5% Speak English less than very well
English speakers - Born in the United States 89.5% of residents of Colonia speak English at home.
6.2% of residents speak Spanish at home 125 88.7% Speak English very well16 11.3% Speak English less than very well4.8% of residents speak other language at home 109 100.0% Speak English very well
English speakers - Native, born elsewhere 60.9% of residents of Colonia speak English at home.
25.2% of residents speak Spanish at home 57 75.0% Speak English very well19 25.0% Speak English less than very well16.6% of residents speak other language at home 43 86.0% Speak English very well7 14.0% Speak English less than very well
English speakers - Foreign-born 17.8% of residents of Colonia speak English at home.
14.3% of residents speak Spanish at home 394 54.7% Speak English very well326 45.3% Speak English less than very well66.9% of residents speak other language at home 1,802 53.5% Speak English very well1,564 46.5% Speak English less than very well
White (Caucasian) - Speak only English Native:
96.5% (8,654)Foreign-born:
32.4% (459)
White (Caucasian) - Speak another language Native:
5.5% (495)Foreign-born:
71.6% (1,014)
Black or African American - Speak only English Native:
94.3% (562)Foreign-born:
21.8% (13)
Black or African American - Speak another language Native:
5.9% (35)Foreign-born:
86.1% (52)
American Indian / Alaska Native - Speak another language Native:
41.9% (19)Foreign-born:
97.6% (50)
Asian - Speak only English Native:
34.4% (295)Foreign-born:
8.6% (167)
Asian - Speak another language Native:
66.0% (565)Foreign-born:
91.4% (1,770)
Other race - Speak only English Native:
89.7% (548)Foreign-born:
32.0% (195)
Other race - Speak another language Native:
25.2% (154)Foreign-born:
76.3% (467)
Two or more races - Speak only English Native:
66.9% (720)Foreign-born:
19.9% (105)
Two or more races - Speak another language Native:
32.8% (352)Foreign-born:
79.9% (423)
White alone - Speak only English Native:
94.7% (8,332)Foreign-born:
26.7% (461)
White alone - Speak another language Native:
5.3% (469)Foreign-born:
73.7% (1,272)
Hispanic or Latino - Speak only English Native:
70.2% (1,180)Foreign-born:
16.5% (145)
Hispanic or Latino - Speak another language Native:
33.4% (561)Foreign-born:
86.7% (759)
Foreign-born residents in Colonia 4,885 residents are foreign born (10.8% Asia , 8.3% Europe , 5.5% Latin America ).
This city:
26.3%New Jersey:
23.2%
Marital status for residents in Colonia Marital status - White (Caucasian) population 15 years and over
Males 31.6% Never married59.2% Now married1.0% Separated4.7% Widowed3.4% DivorcedFemales 24.5% Never married51.1% Now married0.4% Separated14.1% Widowed9.9% DivorcedWomen who gave birth in the past 12 months Now married:
93.0% (87)Unmarried:
7.0% (7)
Women who did not give birth in the past 12 months Now married:
40.8% (838)Unmarried:
59.2% (1,217)
Marital status - Black or African American population 15 years and over
Males 51.1% Never married48.9% Now married0.0% Separated0.0% Widowed0.0% DivorcedFemales 38.6% Never married34.3% Now married0.0% Separated8.9% Widowed18.2% DivorcedWomen who did not give birth in the past 12 months Now married:
17.2% (35)Unmarried:
82.8% (168)
Marital status - American Indian / Alaska Native population 15 years and over
Males 63.2% Never married36.8% Now married0.0% Separated0.0% Widowed0.0% DivorcedFemales 62.2% Never married37.8% Now married0.0% Separated0.0% Widowed0.0% DivorcedWomen who did not give birth in the past 12 months Now married:
0.0% (0)Unmarried:
100.0% (36)
Marital status - Asian population 15 years and over
Males 17.0% Never married78.6% Now married1.5% Separated0.5% Widowed2.3% DivorcedFemales 18.4% Never married72.2% Now married0.0% Separated6.7% Widowed2.8% DivorcedWomen who gave birth in the past 12 months Now married:
100.0% (88)Unmarried:
0.0% (0)
Women who did not give birth in the past 12 months Now married:
66.3% (390)Unmarried:
33.7% (198)
Marital status - Other race population 15 years and over
Males 26.3% Never married42.1% Now married0.0% Separated0.0% Widowed31.6% DivorcedFemales 61.5% Never married35.4% Now married0.0% Separated0.0% Widowed3.1% DivorcedWomen who did not give birth in the past 12 months Now married:
52.5% (135)Unmarried:
47.5% (122)
Marital status - Two or more races population 15 years and over
Males 41.8% Never married54.0% Now married0.0% Separated0.0% Widowed4.2% DivorcedFemales 35.4% Never married49.1% Now married1.5% Separated6.1% Widowed7.8% DivorcedWomen who did not give birth in the past 12 months Now married:
45.7% (212)Unmarried:
54.3% (252)
Marital status - White alone, not Hispanic / Latino population 15 years and over
Males 27.8% Never married62.4% Now married0.9% Separated5.2% Widowed3.8% DivorcedFemales 23.6% Never married51.3% Now married0.4% Separated14.2% Widowed10.6% DivorcedWomen who gave birth in the past 12 months Now married:
93.0% (102)Unmarried:
7.0% (8)
Women who did not give birth in the past 12 months Now married:
40.6% (857)Unmarried:
59.4% (1,256)
Marital status - Hispanic or Latino population 15 years and over
Males 47.2% Never married49.6% Now married1.1% Separated0.0% Widowed2.1% DivorcedFemales 35.3% Never married54.5% Now married0.9% Separated6.5% Widowed2.7% DivorcedWomen who did not give birth in the past 12 months Now married:
48.2% (356)Unmarried:
51.8% (382)
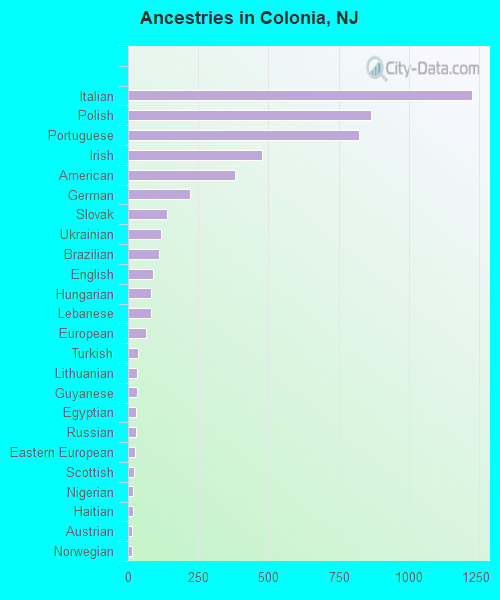
Ancestries in Colonia
1,224 13.2% Italian864 9.3% Polish824 8.9% Portuguese476 5.1% Irish381 4.1% American219 2.4% German138 1.5% Slovak116 1.3% Ukrainian111 1.2% Brazilian88 0.9% English83 0.9% Hungarian81 0.9% Lebanese65 0.7% European34 0.4% Turkish32 0.3% Lithuanian32 0.3% Guyanese30 0.3% Egyptian27 0.3% Russian25 0.3% Eastern European23 0.2% Scottish17 0.2% Nigerian17 0.2% Haitian15 0.2% Austrian14 0.2% Norwegian11 0.1% West Indian10 0.1% German Russian9 0.10% Romanian8 0.09% Croatian8 0.09% Trinidadian and Tobagonian7 0.08% Scotch-Irish7 0.08% French Canadian7 0.08% Czechoslovakian6 0.06% Slovene6 0.06% African6 0.06% Albanian5 0.05% Greek
Geographical mobility in Colonia Same house 1 year ago 10,168 95.6% White (Caucasian)772 97.3% Black or African American84 96.6% American Indian / Alaska Native2,680 92.8% Asian1,226 94.7% Other race1,443 85.8% Two or more races10,289 95.2% White alone, not Hispanic / Latino2,422 89.1% Hispanic or LatinoMoved within same county 296 2.8% White / Caucasian117 4.0% Asian78 4.6% Two or more races362 3.3% White alone, not Hispanic / Latino58 2.1% Hispanic or LatinoMoved within same state 121 1.1% White / Caucasian12 1.5% Black or African American75 2.6% Asian44 3.4% Other race74 4.4% Two or more races104 1.0% White alone, not Hispanic / Latino90 3.3% Hispanic or LatinoMoved from different state 9 0.1% White / Caucasian8 0.3% Asian33 2.0% Two or more races11 0.1% White alone, not Hispanic / Latino89 3.3% Hispanic or LatinoMoved from abroad 53 0.5% White6 0.7% Black or African American26 0.9% Asian61 4.7% Other race35 0.3% White alone, not Hispanic / Latino105 3.9% Hispanic or Latino
Children Nativity (place of birth) in Colonia
Children under 6 years - Living with two parents Both parents native 522 100.0% NativeBoth parents foreign-born 369 100.0% NativeOne native, one foreign-born parent 120 100.0% NativeChildren under 6 years - Living with one parent Native parent 140 100.0% NativeForeign-born parent 33 100.0% NativeChildren 6 to 17 years - Living with two parents Both parents native 943 100.0% NativeBoth parents foreign-born 777 86.1% Native125 13.9% Foreign-bornOne native, one foreign-born parent 229 100.0% NativeChildren 6 to 17 years - Living with one parent Native parent 552 100.0% NativeForeign-born parent 57 55.0% Native47 45.0% Foreign-born
Grandparents responsible for own grandchildren in Colonia
Grandparents (30 to 59 years) White / Caucasian 37 100.0% Not responsible for grandchildrenAsian 9 100.0% Not responsible for grandchildrenTwo or more races 11 100.0% Not responsible for grandchildrenWhite alone, not Hispanic / Latino 44 100.0% Not responsible for grandchildrenHispanic or Latino 9 100.0% Not responsible for grandchildrenGrandparents (60 years and over) White / Caucasian 18 5.4% Responsible for grandchildren321 94.6% Not responsible for grandchildrenAsian 254 100.0% Not responsible for grandchildrenWhite alone, not Hispanic / Latino 25 6.2% Responsible for grandchildren376 93.8% Not responsible for grandchildren