Burlington, WA (Washington) Houses and Residents
| Burlington: | $465,680 |
| Washington: | $569,500 |
Total population: 8,568 (Urban population: 6,623, Rural population: 0)
Houses: 4,234 (3,936 occupied: 1,821 owner occupied, 2,027 renter occupied)
| % of renters here: | 53% |
| State: | 36% |
Housing density: 1,009 houses/condos per square mile
Median price asked for vacant for-sale houses and condos in 2022: $531,408.
Median contract rent in 2022: $1,486 (lower quartile is $1,227, upper quartile is $1,878)
Median rent asked for vacant for-rent units in 2022: $5,093
Median gross rent in Burlington, WA in 2022: $1,679
Housing units in Burlington with a mortgage: 1,296 (286 second mortgage, 0 home equity loan, 237 both second mortgage and home equity loan)
Houses without a mortgage: 31
Median household income for houses/condos with a mortgage: $110,733
Median household income for apartments without a mortgage: $50,730
Median monthly housing costs: $1,626
Compare current foreclosures near Burlington, WA:
| Photo | Address | Area | Beds / Baths | Price | Details |
|---|---|---|---|---|---|

|
#1
Gardner Rd
Burlington, WA 98233
|
1,542 sq. feet
|
2 baths 4 beds |
show details | |

|
#2
Eagle Dr
Burlington, WA 98233
|
2,100 sq. feet
|
2 baths 2 beds |
show details | |

|
#3
Kenkirk Pl
Burlington, WA 98233
|
1,314 sq. feet
|
1 baths 3 beds |
show details | |

|
#4
E Hazel Ave
Burlington, WA 98233
|
2,071 sq. feet
|
2 baths 3 beds |
show details | |

|
#5
Old Highway 99 North Rd # 99
Burlington, WA 98233
|
1,188 sq. feet
|
2 baths - beds |
show details | |

|
#6
Lafayette Rd, Trlr 42
Burlington, WA 98233
|
924 sq. feet
|
1 baths - beds |
show details | |

|
#7
Westar Ln
Burlington, WA 98233
|
- sq. feet
|
- baths - beds |
show details | |

|
#8
Chuckanut Dr
Burlington, WA 98233
|
- sq. feet
|
- baths - beds |
show details | |

|
#9
State Route 20
Burlington, WA 98233
|
- sq. feet
|
- baths - beds |
show details | |

|
#10
Brighton Ct
Burlington, WA 98233
|
- sq. feet
|
- baths - beds |
show details |
| Photo | Address | Area | Beds / Baths | Price | Details |
|---|---|---|---|---|---|

|
#11
E Sharon Ave
Burlington, WA 98233
|
- sq. feet
|
- baths - beds |
show details | |

|
#12
S Burlington Blvd # 402
Burlington, WA 98233
|
- sq. feet
|
- baths - beds |
show details | |

|
#13
N Spruce St
Burlington, WA 98233
|
- sq. feet
|
- baths - beds |
show details | |

|
#14
Filbert Ln
Burlington, WA 98233
|
- sq. feet
|
- baths - beds |
show details | |

|
#15
W Lake Ketchum Rd
Stanwood, WA 98292
|
2,613 sq. feet
|
2 baths 3 beds |
show details | |

|
#16
F And S Grade Rd
Sedro Woolley, WA 98284
|
1,888 sq. feet
|
2 baths 4 beds |
show details | |

|
#17
Fidalgo Pl
Sedro Woolley, WA 98284
|
1,259 sq. feet
|
2 baths 3 beds |
show details | |

|
#18
Wildflower Way
Sedro Woolley, WA 98284
|
908 sq. feet
|
1 baths 2 beds |
show details | |

|
#19
Wildflower Way
Sedro Woolley, WA 98284
|
904 sq. feet
|
1 baths 2 beds |
show details | |

|
#20
Mashie St
Anacortes, WA 98221
|
1,152 sq. feet
|
1 baths 2 beds |
show details |
| Photo | Address | Area | Beds / Baths | Price | Details |
|---|---|---|---|---|---|

|
#21
268th St NW
Stanwood, WA 98292
|
1,420 sq. feet
|
4 baths 6 beds |
show details | |

|
#22
64th Ave NW
Stanwood, WA 98292
|
- sq. feet
|
2 baths 3 beds |
show details | |

|
#23
M Ave
Anacortes, WA 98221
|
1,420 sq. feet
|
2 baths 3 beds |
show details | |

|
#24
285th Pl NW
Stanwood, WA 98292
|
2,268 sq. feet
|
3 baths 3 beds |
show details | |

|
#25
96th Ct NW
Stanwood, WA 98292
|
- sq. feet
|
2 baths 3 beds |
show details | |

|
#26
Finn Settlement Rd
Arlington, WA 98223
|
1,782 sq. feet
|
3 baths 3 beds |
show details | |

|
#27
Sunset Ave
Anacortes, WA 98221
|
1,584 sq. feet
|
1 baths 2 beds |
show details | |

|
#28
Porter St
Mount Vernon, WA 98273
|
2,116 sq. feet
|
1 baths 3 beds |
show details | |

|
#29
Mount Baker Loop
Mount Vernon, WA 98273
|
2,743 sq. feet
|
2 baths 4 beds |
show details | |

|
#30
Fruitdale Rd
Sedro Woolley, WA 98284
|
1,188 sq. feet
|
2 baths 3 beds |
show details |
| Photo | Address | Area | Beds / Baths | Price | Details |
|---|---|---|---|---|---|

|
#31
N 1st St
Mount Vernon, WA 98273
|
1,533 sq. feet
|
2 baths 3 beds |
show details | |

|
#32
Old Samish Rd
Bellingham, WA 98229
|
2,240 sq. feet
|
2 baths 6 beds |
show details | |

|
#33
W 3rd St
Anacortes, WA 98221
|
1,028 sq. feet
|
3 baths 4 beds |
show details | |

|
#34
Reed St
Sedro Woolley, WA 98284
|
1,470 sq. feet
|
1 baths 2 beds |
show details | |

|
#35
72nd Ave NW
Stanwood, WA 98292
|
1,101 sq. feet
|
1 baths 3 beds |
show details | |

|
#36
Park Cottage Pl
Sedro Woolley, WA 98284
|
1,259 sq. feet
|
2 baths 3 beds |
show details | |

|
#37
Alderwood Ln
Sedro Woolley, WA 98284
|
1,735 sq. feet
|
2 baths 3 beds |
show details | |

|
#38
N Laventure Rd
Mount Vernon, WA 98273
|
960 sq. feet
|
1 baths 3 beds |
show details | |

|
#39
Cascadia Dr
Sedro Woolley, WA 98284
|
1,177 sq. feet
|
2 baths 3 beds |
show details | |

|
#40
Marine Heights Way
Anacortes, WA 98221
|
2,175 sq. feet
|
2 baths 3 beds |
show details |
| Photo | Address | Area | Beds / Baths | Price | Details |
|---|---|---|---|---|---|

|
#41
N Belair Dr
Mount Vernon, WA 98273
|
1,120 sq. feet
|
1 baths 3 beds |
show details | |

|
#42
281st Pl NW
Stanwood, WA 98292
|
1,954 sq. feet
|
2 baths 4 beds |
show details | |

|
#43
Prairie Rd
Sedro Woolley, WA 98284
|
1,024 sq. feet
|
1 baths 3 beds |
show details | |

|
#44
284th St NW
Stanwood, WA 98292
|
1,597 sq. feet
|
1 baths 3 beds |
show details | |

|
#45
Aerie Ln
Sedro Woolley, WA 98284
|
1,064 sq. feet
|
2 baths 3 beds |
show details | |

|
#46
N 17th St
Mount Vernon, WA 98273
|
2,780 sq. feet
|
3 baths 5 beds |
show details | |

|
#47
Church Creek Loop NW
Stanwood, WA 98292
|
1,220 sq. feet
|
2 baths 3 beds |
show details | |

|
#48
287th Pl NW
Stanwood, WA 98292
|
2,949 sq. feet
|
2 baths 4 beds |
show details | |

|
#49
W Alder Dr
Sedro Woolley, WA 98284
|
2,365 sq. feet
|
2 baths 3 beds |
show details | |

|
Check over 1 million property listings on Foreclosure.com!
|
browse all offers | |||

Latest news about housing in Burlington, WA collected exclusively by city-data.com from local newspapers, TV, and radio stations


Median year apartment built: 1988
Household type by relationship:
Households: 9,483- Male householders: 1,757 (462 living alone), Female householders: 2,142 (710 living alone)
1,533 spouses (1,490 opposite-sex spouses), 305 unmarried partners, (305 opposite-sex unmarried partners), 2,697 children (2,375 natural, 101 adopted, 220 stepchildren), 107 grandchildren, 126 brothers or sisters, 195 parents, 17 foster children, 233 other relatives, 223 non-relatives
- In group quarters: 141
Size of family households: 898 2-persons, 668 3-persons, 341 4-persons, 160 5-persons, 163 6-persons, 86 7-or-more-persons.
Size of nonfamily households: 1,237 1-person, 262 2-persons, 46 3-persons, 14 5-persons.
1,144 married couples with children.
558 single-parent households (153 men, 405 women).
78.7% of residents of Burlington speak English at home.
18.1% of residents speak Spanish at home (58% speak English very well, 19% speak English well, 21% speak English not well, 2% don't speak English at all).
0.9% of residents speak other Indo-European language at home (87% speak English very well, 13% speak English not well).
1.7% of residents speak Asian or Pacific Island language at home (64% speak English very well, 32% speak English well, 4% speak English not well).
0.1% of residents speak other language at home (100% speak English very well).
Foreign born population: 1,259 (13.3%)
(29.3% of them are naturalized citizens)
| Here: | 6.1 |
| State: | 6.5 |
| Here: | 3.8 |
| State: | 3.9 |

- Bedrooms in owner-occupied houses and condos in Burlington, Washington
- 11no bedroom
- 431 bedroom
- 4432 bedrooms
- 9573 bedrooms
- 2744 bedrooms
- 945+ bedrooms

- Bedrooms in renter-occupied apartments in Burlington, Washington
- 19no bedroom
- 6341 bedroom
- 9302 bedrooms
- 3843 bedrooms
- 494 bedrooms
- 125+ bedrooms

- Cars and other vehicles available in Burlington in owner-occupied houses/condos
- 21no vehicle
- 5041 vehicle
- 5392 vehicles
- 4623 vehicles
- 1544 vehicles
- 1425+ vehicles

- Cars and other vehicles available in Burlington in renter-occupied apartments
- 202no vehicle
- 8661 vehicle
- 6442 vehicles
- 2363 vehicles
- 414 vehicles
- 395+ vehicles

- Rooms in owner-occupied houses in Burlington, Washington
- 01 room
- 302 rooms
- 583 rooms
- 1394 rooms
- 4285 rooms
- 5326 rooms
- 1807 rooms
- 1708 rooms
- 2859+ rooms

- Rooms in renter-occupied apartments in Burlington, Washington
- 141 room
- 3642 rooms
- 4433 rooms
- 5424 rooms
- 2985 rooms
- 2586 rooms
- 977 rooms
- 128 rooms
- 09+ rooms


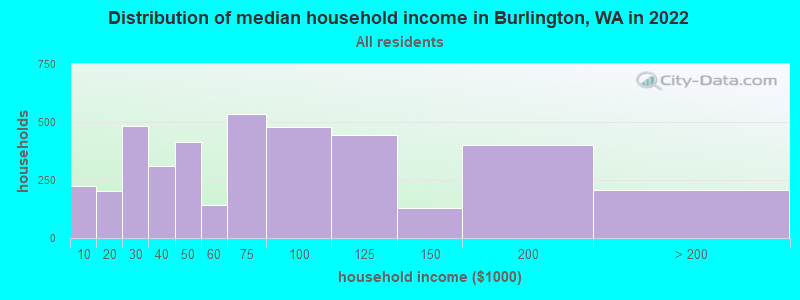
Burlington, WA household income distribution

- 225Less than $10,000
- 202$10,000 to $19,999
- 483$20,000 to $29,999
- 311$30,000 to $39,999
- 415$40,000 to $49,999
- 141$50,000 to $59,999
- 533$60,000 to $74,999
- 480$75,000 to $99,999
- 444$100,000 to $124,999
- 129$125,000 to $149,999
- 399$150,000 to $199,999
- 205$200,000 or more
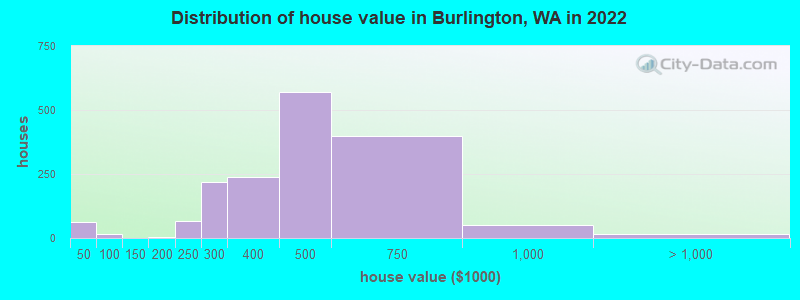
Home value of owner - occupied houses in 2022 in Burlington, WA
-
- 20Less than $10,000
- 9$15,000 to $19,999
- 11$30,000 to $34,999
- 21$35,000 to $39,999
- 16$90,000 to $99,999
- 3$175,000 to $199,999
- 67$200,000 to $249,999
- 219$250,000 to $299,999
- 238$300,000 to $399,999
- 572$400,000 to $499,999
- 399$500,000 to $749,999
- 51$750,000 to $999,999
- 13$1,000,000 to $1,499,999
Rent paid by renters in 2022 in Burlington, WA
-
- 5$100 to $149
- 15$150 to $199
- 8$200 to $249
- 10$250 to $299
- 2$300 to $349
- 19$350 to $399
- 7$700 to $749
- 9$750 to $799
- 30$800 to $899
- 66$900 to $999
- 587$1,000 to $1,249
- 289$1,250 to $1,499
- 684$1,500 to $1,999
- 112$2,000 to $2,499
- 65$2,500 to $2,999
- 24$3,500 or more
- 20No cash rent


Percentage of workers working in this county: 79.2%
Number of people working at home: 289 (6.3% of all workers)
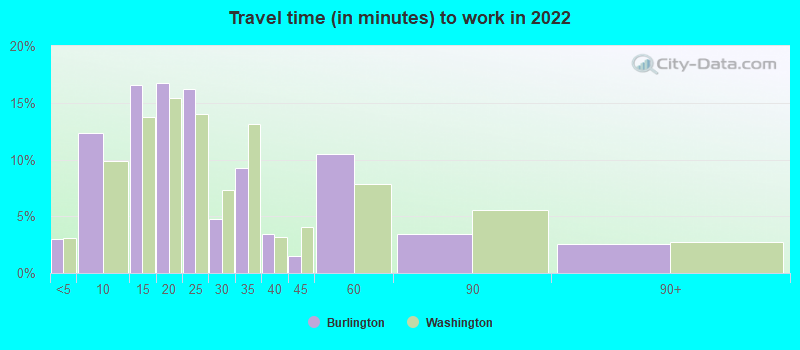
Travel time to work (commute)
- Less than 5 minutes: 152
- 5 to 9 minutes: 818
- 10 to 14 minutes: 1,000
- 15 to 19 minutes: 745
- 20 to 24 minutes: 228
- 25 to 29 minutes: 253
- 30 to 34 minutes: 488
- 35 to 39 minutes: 75
- 40 to 44 minutes: 86
- 45 to 59 minutes: 221
- 60 to 89 minutes: 104
- 90 or more minutes: 137
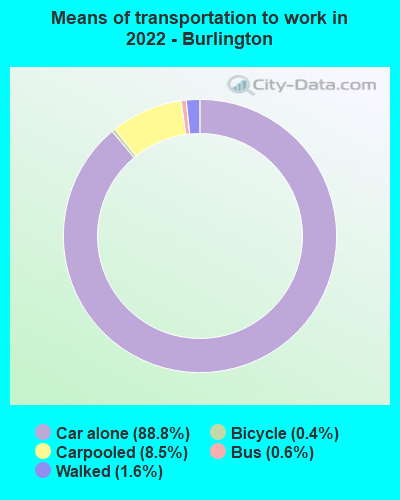
Means of transportation to work:
- Drove a car alone: 8,411 (82.7%)
- Carpooled: 834 (8.2%)
- Bus: 38 (0.4%)
- Taxi: 4 (0.0%)
- Bicycle: 34 (0.3%)
- Walked: 151 (1.5%)
- Worked at home: 289 (2.8%)

- Unemployment by race in 2022
- Unemployment rate for White non-Hispanic residents
- 4.3%Males
- 5.3%Females
- Unemployment rate for American Indian and Alaska Native residents
- 39.3%Males
- 58.6%Females
- Unemployment rate for other race residents
- 11.6%Males
- 18.4%Females
- Unemployment rate for Hispanic or Latino residents
- 6.3%Males
- 9.8%Females

- Year of entry for the foreign-born population in Burlington, Washington
- 4002010 or later
- 3512000 to 2009
- 2931990 to 1999
- 1631980 to 1989
- 941970 to 1979
- 80Before 1970

First ancestries reported:
- American: 487 (13.4%)
- English: 303 (8.4%)
- German: 130 (3.6%)
- Italian: 112 (3.1%)
- European: 111 (3.1%)
- Irish: 98 (2.7%)
- Norwegian: 50 (1.4%)
- Dutch: 48 (1.3%)
- Scottish: 31 (0.9%)
- Northern European: 30 (0.8%)
- Scotch-Irish: 29 (0.8%)
- Danish: 28 (0.8%)
- Swedish: 27 (0.7%)
- Czech: 16 (0.4%)
- French: 14 (0.4%)
- French Canadian: 14 (0.4%)
- Polish: 13 (0.4%)
- Moroccan: 10 (0.3%)
- Finnish: 9 (0.2%)
- Lithuanian: 9 (0.2%)
- Greek: 7 (0.2%)
- African: 2 (0.06%)
- Romanian: 1 (0.03%)
Most common places of birth for foreign-born residents (%):
| Burlington: | 69.2% (882) |
| Washington: | 21.1% (241,655) |
| Burlington: | 9.3% (118) |
| Washington: | 0.1% (1,357) |
| Burlington: | 4.6% (58) |
| Washington: | 6.3% (71,661) |
| Burlington: | 3.3% (42) |
| Washington: | 4.3% (48,886) |
| Burlington: | 1.6% (20) |
| Washington: | 0.2% (2,284) |
Place of birth for U.S.-born residents:
- This state: 5,343
- Other state: 2,760
- Northeast: 133
- Midwest: 610
- South: 688
- West: 1,327
78.2% of Burlington residents lived in the same house 1 years ago.
Out of people who lived in different houses, 27.5% lived in this county.
Out of people who lived in different counties, 86.5% lived in Washington.
| Burlington: | 78.2% |
| State average: | 85.2% |
Education attainment for males 25 years and older:
- No schooling: 59
- Nursery to 4th grade: 25
- 5th and 6th grade: 36
- 7th and 8th grade: 0
- 9th grade: 125
- 10th grade: 0
- 11th grade: 18
- 12th grade, no diploma: 33
- High school graduate (or equivalency): 1,070
- Less than 1 year of college: 154
- Some college more than 1 year, no degree: 495
- Associate degree: 208
- Bachelor's degree: 478
- Master's degree: 48
- Professional school degree: 30
- Doctorate degree: 83

Education attainment for females 25 years and older:
- No schooling: 66
- Nursery to 4th grade: 40
- 5th and 6th grade: 216
- 7th and 8th grade: 11
- 9th grade: 0
- 10th grade: 38
- 11th grade: 20
- 12th grade, no diploma: 41
- High school graduate (or equivalency): 1,122
- Less than 1 year of college: 316
- Some college more than 1 year, no degree: 538
- Associate degree: 346
- Bachelor's degree: 618
- Master's degree: 295
- Professional school degree: 0
- Doctorate degree: 13


Housing units in structures:
- One, detached: 2,330
- One, attached: 277
- Two: 70
- 3 or 4: 345
- 5 to 9: 163
- 10 to 19: 327
- 20 to 49: 410
- 50 or more: 213
- Mobile homes: 96
Housing units lacking complete kitchen facilities in 2022: 5.7%
House/condo owner moved in on average 7 years ago
Renter moved in on average 1 years ago


- 83.8%Utility gas
- 10.0%Electricity
- 2.5%Wood
- 2.0%Bottled, tank, or LP gas
- 1.3%Fuel oil, kerosene, etc.
- 0.4%Solar energy

- 79.9%Electricity
- 19.1%Utility gas
- 0.5%Wood
- 0.4%No fuel used
Private vs. public school enrollment:
| Here: | 19.0% |
| Washington: | 12.4% |
| Here: | 0.8% |
| Washington: | 9.2% |
| Here: | 15.8% |
| Washington: | 16.5% |


