Races in Burlington, Washington (WA) Detailed Stats
Data:
Races - White alone (%)
Races - White alone (% change since 2000)
Races - Black alone (%)
Races - Black alone (% change since 2000)
Races - American Indian alone (%)
Races - American Indian alone (% change since 2000)
Races - Asian alone (%)
Races - Asian alone (% change since 2000)
Races - Hispanic (%)
Races - Hispanic (% change since 2000)
Races - Native Hawaiian and Other Pacific Islander alone (%)
Races - Native Hawaiian and Other Pacific Islander alone (% change since 2000)
Races - Two or more races(%)
Races - Two or more races(% change since 2000)
Races - Other race alone (%)
Races - Other race alone (% change since 2000)
Racial diversity
Place of birth - Born in state of residence (%)
Place of birth - Born in state of residence (%) - White
Place of birth - Born in state of residence (%) - Black or African American
Place of birth - Born in state of residence (%) - Asian
Place of birth - Born in state of residence (%) - Hispanic or Latino
Place of birth - Born in state of residence (%) - American Indian and Alaska Native
Place of birth - Born in state of residence (%) - Multirace
Place of birth - Born in state of residence (%) - Other Race
Place of birth - Born in other state (%)
Place of birth - Born in other state (%) - White
Place of birth - Born in other state (%) - Black or African American
Place of birth - Born in other state (%) - Asian
Place of birth - Born in other state (%) - Hispanic or Latino
Place of birth - Born in other state (%) - American Indian and Alaska Native
Place of birth - Born in other state (%) - Multirace
Place of birth - Born in other state (%) - Other Race
Place of birth - Native, outside of US (%)
Place of birth - Native, outside of US (%) - White
Place of birth - Native, outside of US (%) - Black or African American
Place of birth - Native, outside of US (%) - Asian
Place of birth - Native, outside of US (%) - Hispanic or Latino
Place of birth - Native, outside of US (%) - American Indian and Alaska Native
Place of birth - Native, outside of US (%) - Multirace
Place of birth - Native, outside of US (%) - Other Race
Place of birth - Foreign born (%)
Place of birth - Foreign born (%) - White
Place of birth - Foreign born (%) - Black or African American
Place of birth - Foreign born (%) - Asian
Place of birth - Foreign born (%) - Hispanic or Latino
Place of birth - Foreign born (%) - American Indian and Alaska Native
Place of birth - Foreign born (%) - Multirace
Place of birth - Foreign born (%) - Other Race
Residents speaking English at home (%)
Residents speaking English at home - Born in the United States (%)
Residents speaking English at home - Native, born elsewhere (%)
Residents speaking English at home - Foreign born (%)
Residents speaking Spanish at home (%)
Residents speaking Spanish at home - Born in the United States (%)
Residents speaking Spanish at home - Native, born elsewhere (%)
Residents speaking Spanish at home - Foreign born (%)
Residents speaking other language at home (%)
Residents speaking other language at home - Born in the United States (%)
Residents speaking other language at home - Native, born elsewhere (%)
Residents speaking other language at home - Foreign born (%)
Marital status - Never married (%)
Marital status - Now married (%)
Marital status - Separated (%)
Marital status - Widowed (%)
Marital status - Divorced (%)
Ancestries Reported - Arab (%)
Ancestries Reported - Czech (%)
Ancestries Reported - Danish (%)
Ancestries Reported - Dutch (%)
Ancestries Reported - English (%)
Ancestries Reported - French (%)
Ancestries Reported - French Canadian (%)
Ancestries Reported - German (%)
Ancestries Reported - Greek (%)
Ancestries Reported - Hungarian (%)
Ancestries Reported - Irish (%)
Ancestries Reported - Italian (%)
Ancestries Reported - Lithuanian (%)
Ancestries Reported - Norwegian (%)
Ancestries Reported - Polish (%)
Ancestries Reported - Portuguese (%)
Ancestries Reported - Russian (%)
Ancestries Reported - Scotch-Irish (%)
Ancestries Reported - Scottish (%)
Ancestries Reported - Slovak (%)
Ancestries Reported - Subsaharan African (%)
Ancestries Reported - Swedish (%)
Ancestries Reported - Swiss (%)
Ancestries Reported - Ukrainian (%)
Ancestries Reported - United States (%)
Ancestries Reported - Welsh (%)
Ancestries Reported - West Indian (%)
Ancestries Reported - Other (%)
Geographical mobility - Same house 1 year ago (%)
Geographical mobility - Same house 1 year ago (%) - White
Geographical mobility - Same house 1 year ago (%) - Black or African American
Geographical mobility - Same house 1 year ago (%) - Asian
Geographical mobility - Same house 1 year ago (%) - Hispanic or Latino
Geographical mobility - Same house 1 year ago (%) - American Indian and Alaska Native
Geographical mobility - Same house 1 year ago (%) - Multirace
Geographical mobility - Same house 1 year ago (%) - Other Race
Geographical mobility - Moved within same county (%)
Geographical mobility - Moved within same county (%) - White
Geographical mobility - Moved within same county (%) - Black or African American
Geographical mobility - Moved within same county (%) - Asian
Geographical mobility - Moved within same county (%) - Hispanic or Latino
Geographical mobility - Moved within same county (%) - American Indian and Alaska Native
Geographical mobility - Moved within same county (%) - Multirace
Geographical mobility - Moved within same county (%) - Other Race
Geographical mobility - Moved from different county within same state (%)
Geographical mobility - Moved from different county within same state (%) - White
Geographical mobility - Moved from different county within same state (%) - Black or African American
Geographical mobility - Moved from different county within same state (%) - Asian
Geographical mobility - Moved from different county within same state (%) - Hispanic or Latino
Geographical mobility - Moved from different county within same state (%) - American Indian and Alaska Native
Geographical mobility - Moved from different county within same state (%) - Multirace
Geographical mobility - Moved from different county within same state (%) - Other Race
Geographical mobility - Moved from different state (%)
Geographical mobility - Moved from different state (%) - White
Geographical mobility - Moved from different state (%) - Black or African American
Geographical mobility - Moved from different state (%) - Asian
Geographical mobility - Moved from different state (%) - Hispanic or Latino
Geographical mobility - Moved from different state (%) - American Indian and Alaska Native
Geographical mobility - Moved from different state (%) - Multirace
Geographical mobility - Moved from different state (%) - Other Race
Geographical mobility - Moved from abroad (%)
Geographical mobility - Moved from abroad (%) - White
Geographical mobility - Moved from abroad (%) - Black or African American
Geographical mobility - Moved from abroad (%) - Asian
Geographical mobility - Moved from abroad (%) - Hispanic or Latino
Geographical mobility - Moved from abroad (%) - American Indian and Alaska Native
Geographical mobility - Moved from abroad (%) - Multirace
Geographical mobility - Moved from abroad (%) - Other Race
Place of birth for the foreign-born population - Ireland (%)
Place of birth for the foreign-born population - Denmark (%)
Place of birth for the foreign-born population - Norway (%)
Place of birth for the foreign-born population - Sweden (%)
Place of birth for the foreign-born population - United Kingdom (%)
Place of birth for the foreign-born population - England (%)
Place of birth for the foreign-born population - Scotland (%)
Place of birth for the foreign-born population - Other Northern Europe (%)
Place of birth for the foreign-born population - Austria (%)
Place of birth for the foreign-born population - Belgium (%)
Place of birth for the foreign-born population - France (%)
Place of birth for the foreign-born population - Germany (%)
Place of birth for the foreign-born population - Netherlands (%)
Place of birth for the foreign-born population - Switzerland (%)
Place of birth for the foreign-born population - Other Western Europe (%)
Place of birth for the foreign-born population - Greece (%)
Place of birth for the foreign-born population - Italy (%)
Place of birth for the foreign-born population - Portugal (%)
Place of birth for the foreign-born population - Spain (%)
Place of birth for the foreign-born population - Other Southern Europe (%)
Place of birth for the foreign-born population - Albania (%)
Place of birth for the foreign-born population - Belarus (%)
Place of birth for the foreign-born population - Bosnia and Herzegovina (%)
Place of birth for the foreign-born population - Bulgaria (%)
Place of birth for the foreign-born population - Croatia (%)
Place of birth for the foreign-born population - Czechoslovakia (%)
Place of birth for the foreign-born population - Hungary (%)
Place of birth for the foreign-born population - Latvia (%)
Place of birth for the foreign-born population - Lithuania (%)
Place of birth for the foreign-born population - North Macedonia (Macedonia) (%)
Place of birth for the foreign-born population - Moldova (%)
Place of birth for the foreign-born population - Poland (%)
Place of birth for the foreign-born population - Romania (%)
Place of birth for the foreign-born population - Russia (%)
Place of birth for the foreign-born population - Serbia (%)
Place of birth for the foreign-born population - Ukraine (%)
Place of birth for the foreign-born population - Other Eastern Europe (%)
Place of birth for the foreign-born population - China (%)
Place of birth for the foreign-born population - Hong Kong (%)
Place of birth for the foreign-born population - Taiwan (%)
Place of birth for the foreign-born population - Japan (%)
Place of birth for the foreign-born population - Korea (%)
Place of birth for the foreign-born population - Other Eastern Asia (%)
Place of birth for the foreign-born population - Afghanistan (%)
Place of birth for the foreign-born population - Bangladesh (%)
Place of birth for the foreign-born population - India (%)
Place of birth for the foreign-born population - Iran (%)
Place of birth for the foreign-born population - Kazakhstan (%)
Place of birth for the foreign-born population - Nepal (%)
Place of birth for the foreign-born population - Pakistan (%)
Place of birth for the foreign-born population - Sri Lanka (%)
Place of birth for the foreign-born population - Uzbekistan (%)
Place of birth for the foreign-born population - Other South Central Asia (%)
Place of birth for the foreign-born population - Burma (%)
Place of birth for the foreign-born population - Cambodia (%)
Place of birth for the foreign-born population - Indonesia (%)
Place of birth for the foreign-born population - Laos (%)
Place of birth for the foreign-born population - Malaysia (%)
Place of birth for the foreign-born population - Philippines (%)
Place of birth for the foreign-born population - Singapore (%)
Place of birth for the foreign-born population - Thailand (%)
Place of birth for the foreign-born population - Vietnam (%)
Place of birth for the foreign-born population - Other South Eastern Asia (%)
Place of birth for the foreign-born population - Armenia (%)
Place of birth for the foreign-born population - Iraq (%)
Place of birth for the foreign-born population - Israel (%)
Place of birth for the foreign-born population - Jordan (%)
Place of birth for the foreign-born population - Kuwait (%)
Place of birth for the foreign-born population - Lebanon (%)
Place of birth for the foreign-born population - Saudi Arabia (%)
Place of birth for the foreign-born population - Syria (%)
Place of birth for the foreign-born population - Turkey (%)
Place of birth for the foreign-born population - Yemen (%)
Place of birth for the foreign-born population - Other Western Asia (%)
Place of birth for the foreign-born population - Eritrea (%)
Place of birth for the foreign-born population - Ethiopia (%)
Place of birth for the foreign-born population - Kenya (%)
Place of birth for the foreign-born population - Somalia (%)
Place of birth for the foreign-born population - Uganda (%)
Place of birth for the foreign-born population - Zimbabwe (%)
Place of birth for the foreign-born population - Other Eastern Africa (%)
Place of birth for the foreign-born population - Cameroon (%)
Place of birth for the foreign-born population - Congo (%)
Place of birth for the foreign-born population - Democratic Republic of Congo (Zaire) (%)
Place of birth for the foreign-born population - Other Middle Africa (%)
Place of birth for the foreign-born population - Egypt (%)
Place of birth for the foreign-born population - Morocco (%)
Place of birth for the foreign-born population - Sudan (%)
Place of birth for the foreign-born population - Other Northern Africa (%)
Place of birth for the foreign-born population - South Africa (%)
Place of birth for the foreign-born population - Other Southern Africa (%)
Place of birth for the foreign-born population - Cabo Verde (%)
Place of birth for the foreign-born population - Ghana (%)
Place of birth for the foreign-born population - Liberia (%)
Place of birth for the foreign-born population - Nigeria (%)
Place of birth for the foreign-born population - Senegal (%)
Place of birth for the foreign-born population - Sierra Leone (%)
Place of birth for the foreign-born population - Other Western Africa (%)
Place of birth for the foreign-born population - Australia (%)
Place of birth for the foreign-born population - New Zealand (%)
Place of birth for the foreign-born population - Fiji (%)
Place of birth for the foreign-born population - Micronesia (%)
Place of birth for the foreign-born population - Bahamas (%)
Place of birth for the foreign-born population - Barbados (%)
Place of birth for the foreign-born population - Cuba (%)
Place of birth for the foreign-born population - Dominica (%)
Place of birth for the foreign-born population - Dominican Republic (%)
Place of birth for the foreign-born population - Grenada (%)
Place of birth for the foreign-born population - Haiti (%)
Place of birth for the foreign-born population - Jamaica (%)
Place of birth for the foreign-born population - St. Vincent and the Grenadines (%)
Place of birth for the foreign-born population - Trinidad and Tobago (%)
Place of birth for the foreign-born population - West Indies (%)
Place of birth for the foreign-born population - Other Caribbean (%)
Place of birth for the foreign-born population - Belize (%)
Place of birth for the foreign-born population - Costa Rica (%)
Place of birth for the foreign-born population - El Salvador (%)
Place of birth for the foreign-born population - Guatemala (%)
Place of birth for the foreign-born population - Honduras (%)
Place of birth for the foreign-born population - Mexico (%)
Place of birth for the foreign-born population - Nicaragua (%)
Place of birth for the foreign-born population - Panama (%)
Place of birth for the foreign-born population - Other Central America (%)
Place of birth for the foreign-born population - Argentina (%)
Place of birth for the foreign-born population - Bolivia (%)
Place of birth for the foreign-born population - Brazil (%)
Place of birth for the foreign-born population - Chile (%)
Place of birth for the foreign-born population - Colombia (%)
Place of birth for the foreign-born population - Ecuador (%)
Place of birth for the foreign-born population - Guyana (%)
Place of birth for the foreign-born population - Peru (%)
Place of birth for the foreign-born population - Uruguay (%)
Place of birth for the foreign-born population - Venezuela (%)
Place of birth for the foreign-born population - Other South America (%)
Place of birth for the foreign-born population - Canada (%)
Place of birth for the foreign-born population - Other Northern America (%)
Place of birth for the foreign-born population - Other (%)
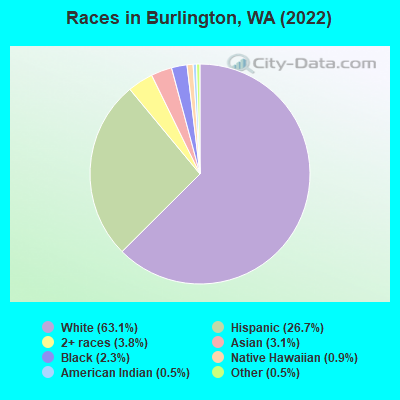
According to 2022 data, the most numerous races in Burlington, WA are White alone (5,982 residents), Hispanic (2,534 residents), and Asian alone (295 residents). 78.7% of Burlington residents speak English at home. 13.4% of Burlington, WA residents are foreign-born (10.8% born in Latin America, 1.7% born in Asia), which is 11.7% less than the foreign-born rate of 15.0% across the entire state of Washington.
Race distribution in Burlington
2000 2022
4,652,490 78.9% White alone 441,509 7.5% Hispanic 319,401 5.4% Asian alone 184,631 3.1% Black alone 175,926 3.0% Two or more races 85,396 1.4% American Indian alone 22,779 0.4% Native Hawaiian and Other 11,989 0.2% Other race alone
4,941,456 63.5% White alone 1,093,313 14.0% Hispanic 755,832 9.7% Asian alone 523,448 6.7% Two or more races 299,537 3.8% Black alone 69,024 0.9% American Indian alone 52,231 0.7% Native Hawaiian and Other 50,945 0.7% Other race alone
Income and house value in Burlington Median household income in 2022 $59,680 White non-Hispanic householdersover $200,000 Black householders$60,502 Asian householders$75,430 Some other race householders$85,412 Two or more races householders$71,410 Hispanic or Latino race householdersMedian 2022 house value $474,711 White Non-Hispanic householders $208,815 Asian householders$302,745 Some other race householders$249,277 Two or more races householders$390,896 Hispanic or Latino householders
Median age by race in Burlington
38.7 Median age for White residents37.3 41.6 41.3 Median age for Black or African American residents40.3 43.5 35.1 Median age for American Indian / Alaska Native residents39.6 26.9 40.3 Median age for Asian residents27.4 54.2 21.1 Median age for Native Hawaiian / Pacific Islander residents-696,774,192.9 20.8 37.0 Median age for Other race residents40.6 23.7 32.0 Median age for Two or more races residents20.3 36.4 39.5 Median age for White alone residents37.6 42.3 35.1 Median age for Hispanic or Latino residents33.7 35.1
Owner/renter occupied households by race in Burlington
House owners and renters - White residents 1,595 54.8% Owner occupied1,314 45.2% Renter occupiedHouse owners and renters - Black or African American residents 17 12.1% Owner occupied125 87.9% Renter occupiedHouse owners and renters - American Indian / Alaska Native residents 22 100.0% Renter occupiedHouse owners and renters - Asian residents 65 40.7% Owner occupied95 59.3% Renter occupiedHouse owners and renters - Native Hawaiian / Pacific Islander residents 23 100.0% Owner occupiedHouse owners and renters - Other race residents 69 17.5% Owner occupied326 82.5% Renter occupiedHouse owners and renters - Two or more races residents 103 60.5% Owner occupied67 39.5% Renter occupiedHouse owners and renters - White alone residents 1,547 57.4% Owner occupied1,147 42.6% Renter occupiedHouse owners and renters - Hispanic or Latino residents 178 26.3% Owner occupied498 73.7% Renter occupied
Language usage in Burlington
English speakers - Total 78.7% of residents of Burlington speak English at home.
18.7% of residents speak Spanish at home 1,017 59.2% Speak English very well700 40.8% Speak English less than very well2.7% of residents speak other language at home 181 73.6% Speak English very well65 26.4% Speak English less than very well
English speakers - Born in the United States 86.8% of residents of Burlington speak English at home.
11.9% of residents speak Spanish at home 274 83.8% Speak English very well53 16.2% Speak English less than very well1.0% of residents speak other language at home 27 100.0% Speak English very well
English speakers - Native, born elsewhere 97.0% of residents of Burlington speak English at home.
13.3% of residents speak Spanish at home 18 100.0% Speak English less than very well
English speakers - Foreign-born 15.6% of residents of Burlington speak English at home.
70.7% of residents speak Spanish at home 284 31.9% Speak English very well607 68.1% Speak English less than very well12.7% of residents speak other language at home 101 63.1% Speak English very well59 36.9% Speak English less than very well
White (Caucasian) - Speak only English Native:
96.1% (5,833)Foreign-born:
24.7% (41)
White (Caucasian) - Speak another language Native:
3.9% (235)Foreign-born:
100.0% (168)
Black or African American - Speak only English Native:
83.2% (201)Foreign-born:
100.0% (3)
American Indian / Alaska Native - Speak only English Native:
97.5% (62)Foreign-born:
67.1% (8)
Asian - Speak only English Native:
78.9% (83)Foreign-born:
8.6% (17)
Asian - Speak another language Native:
17.7% (18)Foreign-born:
98.1% (191)
Other race - Speak only English Native:
16.8% (120)Foreign-born:
11.2% (105)
Other race - Speak another language Native:
76.0% (542)Foreign-born:
85.8% (803)
Two or more races - Speak another language Native:
4.4% (24)Foreign-born:
100.0% (14)
White alone - Speak only English Native:
97.8% (5,641)Foreign-born:
53.0% (20)
White alone - Speak another language Native:
2.2% (126)Foreign-born:
33.9% (13)
Hispanic or Latino - Speak only English Native:
48.7% (692)Foreign-born:
5.8% (58)
Hispanic or Latino - Speak another language Native:
51.9% (737)Foreign-born:
89.3% (893)
Foreign-born residents in Burlington 1,274 residents are foreign born (10.8% Latin America , 1.7% Asia ).
This city:
13.4%Washington:
14.9%
Marital status for residents in Burlington Marital status - White (Caucasian) population 15 years and over
Males 35.4% Never married49.2% Now married1.0% Separated0.7% Widowed13.6% DivorcedFemales 22.9% Never married42.9% Now married2.0% Separated9.1% Widowed23.1% DivorcedWomen who gave birth in the past 12 months Now married:
100.0% (65)Unmarried:
0.0% (0)
Women who did not give birth in the past 12 months Now married:
42.4% (657)Unmarried:
57.6% (892)
Marital status - Black or African American population 15 years and over
Males 33.5% Never married66.5% Now married0.0% Separated0.0% Widowed0.0% DivorcedFemales 0.0% Never married57.3% Now married42.7% Separated0.0% Widowed0.0% DivorcedWomen who did not give birth in the past 12 months Now married:
100.0% (75)Unmarried:
0.0% (0)
Marital status - American Indian / Alaska Native population 15 years and over
Males 57.1% Never married42.9% Now married0.0% Separated0.0% Widowed0.0% DivorcedFemales 39.1% Never married0.0% Now married0.0% Separated0.0% Widowed60.9% DivorcedWomen who did not give birth in the past 12 months Now married:
0.0% (0)Unmarried:
100.0% (27)
Marital status - Asian population 15 years and over
Males 51.7% Never married35.4% Now married0.0% Separated7.5% Widowed5.4% DivorcedFemales 15.1% Never married49.1% Now married0.0% Separated8.5% Widowed27.4% DivorcedWomen who gave birth in the past 12 months Now married:
100.0% (5)Unmarried:
0.0% (0)
Women who did not give birth in the past 12 months Now married:
37.5% (16)Unmarried:
62.5% (27)
Marital status - Native Hawaiian / Pacific Islander population 15 years and over
Males 56.8% Never married43.2% Now married0.0% Separated0.0% Widowed0.0% DivorcedFemales 70.5% Never married21.6% Now married0.0% Separated0.0% Widowed8.0% DivorcedWomen who did not give birth in the past 12 months Now married:
23.5% (20)Unmarried:
76.5% (67)
Marital status - Other race population 15 years and over
Males 52.4% Never married42.3% Now married0.0% Separated0.0% Widowed5.2% DivorcedFemales 57.3% Never married22.3% Now married0.0% Separated3.8% Widowed16.5% DivorcedWomen who did not give birth in the past 12 months Now married:
19.3% (98)Unmarried:
80.7% (410)
Marital status - Two or more races population 15 years and over
Males 54.5% Never married32.4% Now married0.0% Separated13.1% Widowed0.0% DivorcedFemales 26.7% Never married43.0% Now married0.0% Separated5.4% Widowed24.9% DivorcedWomen who did not give birth in the past 12 months Now married:
47.7% (79)Unmarried:
52.3% (87)
Marital status - White alone, not Hispanic / Latino population 15 years and over
Males 33.6% Never married49.9% Now married1.1% Separated0.8% Widowed14.6% DivorcedFemales 19.9% Never married44.6% Now married1.3% Separated9.5% Widowed24.7% DivorcedWomen who gave birth in the past 12 months Now married:
100.0% (67)Unmarried:
0.0% (0)
Women who did not give birth in the past 12 months Now married:
44.4% (599)Unmarried:
55.6% (750)
Marital status - Hispanic or Latino population 15 years and over
Males 55.6% Never married37.3% Now married0.0% Separated2.0% Widowed5.2% DivorcedFemales 53.2% Never married25.5% Now married2.3% Separated4.5% Widowed14.4% DivorcedWomen who did not give birth in the past 12 months Now married:
26.0% (221)Unmarried:
74.0% (628)
Ancestries in Burlington
487 13.4% American303 8.4% English130 3.6% German112 3.1% Italian111 3.1% European98 2.7% Irish50 1.4% Norwegian48 1.3% Dutch31 0.9% Scottish30 0.8% Northern European29 0.8% Scotch-Irish28 0.8% Danish27 0.7% Swedish16 0.4% Czech14 0.4% French14 0.4% French Canadian13 0.4% Polish10 0.3% Moroccan9 0.2% Finnish9 0.2% Lithuanian7 0.2% Greek2 0.06% African1 0.03% Romanian
Children Nativity (place of birth) in Burlington
Children under 6 years - Living with two parents Both parents native 253 100.0% NativeChildren under 6 years - Living with one parent Native parent 102 100.0% NativeChildren 6 to 17 years - Living with two parents Both parents native 693 88.4% Native91 11.6% Foreign-bornBoth parents foreign-born 95 59.2% Native66 40.8% Foreign-bornOne native, one foreign-born parent 12 30.0% Native27 70.0% Foreign-bornChildren 6 to 17 years - Living with one parent Native parent 464 100.0% NativeForeign-born parent 161 48.7% Native169 51.3% Foreign-born
Grandparents responsible for own grandchildren in Burlington
Grandparents (30 to 59 years) White / Caucasian 22 100.0% Responsible for grandchildrenBlack or African American 8 100.0% Not responsible for grandchildrenNative Hawaiian / Pacific Islander 6 100.0% Not responsible for grandchildrenTwo or more races 13 100.0% Not responsible for grandchildrenWhite alone, not Hispanic / Latino 29 100.0% Responsible for grandchildrenHispanic or Latino 12 100.0% Not responsible for grandchildrenGrandparents (60 years and over) White / Caucasian 29 41.2% Responsible for grandchildren41 58.8% Not responsible for grandchildrenBlack or African American 3 100.0% Not responsible for grandchildrenTwo or more races 19 100.0% Not responsible for grandchildrenWhite alone, not Hispanic / Latino 29 40.1% Responsible for grandchildren43 59.9% Not responsible for grandchildrenHispanic or Latino 34 42.2% Responsible for grandchildren46 57.8% Not responsible for grandchildren