Burbank, IL (Illinois) Houses and Residents
Estimated median house or condo value in 2022: $256,657 (it was $137,600 in 2000 )
Burbank:
$256,657Illinois:
$251,600
Lower value quartile - upper value quartile: $211,050 - $305,510Mean price in 2022: Detached houses: $261,861 Here:
$261,861State:
$310,164
Townhouses or other attached units: $92,684 Here:
$92,684State:
$286,230
In 2-unit structures: $142,679 Here:
$142,679State:
$299,638
In 3-to-4-unit structures: $289,749 Here:
$289,749State:
$330,907
In 5-or-more-unit structures: $147,415 Here:
$147,415State:
$318,887
Mobile homes: $194,114 Here:
$194,114State:
$78,855
Total population: 29,218 (Urban population: 27,825, Rural population: 0)
Houses: 9,953 (9,503 occupied: 7,763 owner occupied, 1,901 renter occupied )
% of renters here:
20%State:
33%
Housing density: 2,385 houses/condos per square mile
Median price asked for vacant for-sale houses and condos in 2022: $165,680.
Median contract rent in 2022: $1,078 (lower quartile is $931, upper quartile is $1,292)
Median rent asked for vacant for-rent units in 2022: $1,217
Median gross rent in Burbank, IL in 2022: $1,217
Housing units in Burbank with a mortgage: 4,611 (204 second mortgage, 11 home equity loan, 163 both second mortgage and home equity loan )Houses without a mortgage: 81
Median household income for houses/condos with a mortgage: $90,074
Median household income for apartments without a mortgage: $77,971
Median monthly housing costs: $1,288
Data:
Median house or condo value ($)
Median house or condo value ($ change since 2000)
Median house or condo value ($) - White
Median house or condo value ($) - Black or African American
Median house or condo value ($) - Asian
Median house or condo value ($) - Hispanic or Latino
Median house or condo value ($) - American Indian and Alaska Native
Median house or condo value ($) - Multirace
Median house or condo value ($) - Other Race
Median price asked for mobile homes ($)
Household density (households per square mile)
Mean house or condo value by units in structure - 1, detached ($)
Mean house or condo value by units in structure - 1, attached ($)
Mean house or condo value by units in structure - 2 ($)
Mean house or condo value by units in structure by units in structure - 3 or 4 ($)
Mean house or condo value by units in structure - 5 or more ($)
Mean house or condo value by units in structure - Boat, RV, van, etc. ($)
Mean house or condo value by units in structure - Mobile home ($)
Median contract rent ($)
Median contract rent - Lower quartile ($)
Median contract rent - Upper quartile ($)
Median gross rent ($)
Urban houses (%)
Rural houses (%)
Houses occupied (%)
Houses occupied (% change since 2000)
Houses owner occupied (%)
Houses owner occupied (% change since 2000)
Houses renter occupied (%)
Houses renter occupied (% change since 2000)
Vacant housing units - For rent (%)
Vacant housing units - For rent (% change since 2000)
Vacant housing units - For sale only (%)
Vacant housing units - For sale only (% change since 2000)
Vacant housing units - Rented or sold, not occupied (%)
Vacant housing units - Rented or sold, not occupied (% change since 2000)
Vacant housing units - For seasonal, recreational, or occasional use (%)
Vacant housing units - For seasonal, recreational, or occasional use (% change since 2000)
Vacant housing units - For migrant workers (%)
Vacant housing units - For migrant workers (% change since 2000)
Vacant housing units - Other vacant (%)
Vacant housing units - Other vacant (% change since 2000)
Median monthly housing costs ($)
Median household income for houses/condos with a mortgage ($)
Median household income for houses/condos without a mortgage ($)
Median household income ($)
Median household income ($) - White
Median household income ($) - Black or African American
Median household income ($) - Asian
Median household income ($) - Hispanic or Latino
Median household income ($) - American Indian and Alaska Native
Median household income ($) - Multirace
Median household income ($) - Other Race
Mortgage status - with mortgage (%)
Mortgage status - with second mortgage (%)
Mortgage status - with home equity loan (%)
Mortgage status - with both second mortgage and home equity loan (%)
Mortgage status - without a mortgage (%)
Median year house/condo built
Median year apartment built
Household type by relationship - Male householder living alone (%)
Household type by relationship - Male householder not living alone (%)
Household type by relationship - Female householder living alone (%)
Household type by relationship - Female householder not living alone (%)
Household type by relationship - Opposite-Sex spouse (%)
Household type by relationship - Same-Sex spouse (%)
Household type by relationship - Opposite-Sex unmarried partner (%)
Household type by relationship - Same-Sex unmarried partner (%)
Household type by relationship - In group quarters (%)
Size of family households - 2-person household (%)
Size of family households - 3-person household (%)
Size of family households - 4-person household (%)
Size of family households - 5-person household (%)
Size of family households - 6-person household (%)
Size of family households - 7-or-more-person household (%)
Size of nonfamily households - 1-person household (%)
Size of nonfamily households - 2-person household (%)
Size of nonfamily households - 3-person household (%)
Size of nonfamily households - 4-person household (%)
Size of nonfamily households - 5-person household (%)
Size of nonfamily households - 6-person household (%)
Size of nonfamily households - 7-or-moreperson household (%)
Year house built - Built 2010 or later (%)
Year house built - Built 2000 to 2009 (%)
Year house built - Built 1990 to 1999 (%)
Year house built - Built 1980 to 1989 (%)
Year house built - Built 1970 to 1979 (%)
Year house built - Built 1960 to 1969 (%)
Year house built - Built 1950 to 1959 (%)
Year house built - Built 1940 to 1949 (%)
Year house built - Built 1939 or earlier (%)
Median number of rooms in houses and condos
Median number of rooms in apartments
Median number of bedrooms in owner occupied houses
Mean number of bedrooms in owner occupied houses
Median number of bedrooms in renter occupied houses
Mean number of bedrooms in renter occupied houses
Median number of vehichles in owner occupied houses
Mean number of vehichles in owner occupied houses
Median number of vehichles in renter occupied houses
Mean number of vehichles in renter occupied houses
Rooms in owner-occupied houses - 1 room (%)
Rooms in owner-occupied houses - 2 rooms (%)
Rooms in owner-occupied houses - 3 rooms (%)
Rooms in owner-occupied houses - 4 rooms (%)
Rooms in owner-occupied houses - 5 rooms (%)
Rooms in owner-occupied houses - 6 rooms (%)
Rooms in owner-occupied houses - 7 rooms (%)
Rooms in owner-occupied houses - 8 rooms (%)
Rooms in owner-occupied houses - 9+ rooms (%)
Rooms in renter-occupied houses - 1 room (%)
Rooms in renter-occupied houses - 2 rooms (%)
Rooms in renter-occupied houses - 3 rooms (%)
Rooms in renter-occupied houses - 4 rooms (%)
Rooms in renter-occupied houses - 5 rooms (%)
Rooms in renter-occupied houses - 6 rooms (%)
Rooms in renter-occupied houses - 7 rooms (%)
Rooms in renter-occupied houses - 8 rooms (%)
Rooms in renter-occupied houses - 9+ rooms (%)
Bedrooms in owner-occupied houses - no bedrooms (%)
Bedrooms in owner-occupied houses - 1 bedroom (%)
Bedrooms in owner-occupied houses - 2 bedrooms (%)
Bedrooms in owner-occupied houses - 3 bedrooms (%)
Bedrooms in owner-occupied houses - 4 bedrooms (%)
Bedrooms in owner-occupied houses - 5+ bedrooms (%)
Bedrooms in renter-occupied houses - no bedrooms (%)
Bedrooms in renter-occupied houses - 1 bedroom (%)
Bedrooms in renter-occupied houses - 2 bedrooms (%)
Bedrooms in renter-occupied houses - 3 bedrooms (%)
Bedrooms in renter-occupied houses - 4 bedrooms (%)
Bedrooms in renter-occupied houses - 5+ bedrooms (%)
Vehicles available in owner-occupied houses - no vehicle available (%)
Vehicles available in owner-occupied houses - 1 vehicle available(%)
Vehicles available in owner-occupied houses - 2 Vehicles available (%)
Vehicles available in owner-occupied houses - 3 Vehicles available (%)
Vehicles available in owner-occupied houses - 4 Vehicles available (%)
Vehicles available in owner-occupied houses - 5+ Vehicles available (%)
Vehicles available in renter-occupied houses - no vehicle available (%)
Vehicles available in renter-occupied houses - 1 vehicle available (%)
Vehicles available in renter-occupied houses - 2 Vehicles available (%)
Vehicles available in renter-occupied houses - 3 Vehicles available (%)
Vehicles available in renter-occupied houses - 4 Vehicles available (%)
Vehicles available in renter-occupied houses - 5+ Vehicles available (%)
Housing units in structures - 1, detached (%)
Housing units in structures - 1, attached (%)
Housing units in structures - 2 (%)
Housing units in structures - 3 or 4 (%)
Housing units in structures - 5 to 9 (%)
Housing units in structures - 10 to 19 (%)
Housing units in structures - 20 to 49 (%)
Housing units in structures - 50 or more (%)
Housing units in structures - Mobile home (%)
Housing units in structures - Boat, RV, van, etc. (%)
Housing units in structures - Owners - 1, detached (%)
Housing units in structures - Owners - 1, attached (%)
Housing units in structures - Owners - 2 (%)
Housing units in structures - Owners - 3 or 4 (%)
Housing units in structures - Owners - 5 to 9 (%)
Housing units in structures - Owners - 10 to 19 (%)
Housing units in structures - Owners - 20 to 49 (%)
Housing units in structures - Owners - 50 or more (%)
Housing units in structures - Owners - Mobile home (%)
Housing units in structures - Owners - Boat, RV, van, etc. (%)
Housing units in structures - Renters - 1, detached (%)
Housing units in structures - Renters - 1, attached (%)
Housing units in structures - Renters - 2 (%)
Housing units in structures - Renters - 3 or 4 (%)
Housing units in structures - Renters - 5 to 9 (%)
Housing units in structures - Renters - 10 to 19 (%)
Housing units in structures - Renters - 20 to 49 (%)
Housing units in structures - Renters - 50 or more (%)
Housing units in structures - Renters - Mobile home (%)
Housing units in structures - Renters - Boat, RV, van, etc. (%)
House/condo owner moved in on average (years ago)
Renter moved in on average (years ago)
Year householder moved into unit - Moved in 1999 to March 2000 (%)
Year householder moved into unit - Moved in 1999 to March 2000 (%) - White
Year householder moved into unit - Moved in 1999 to March 2000 (%) - Black or African American
Year householder moved into unit - Moved in 1999 to March 2000 (%) - Asian
Year householder moved into unit - Moved in 1999 to March 2000 (%) - Hispanic or Latino
Year householder moved into unit - Moved in 1999 to March 2000 (%) - American Indian and Alaska Native
Year householder moved into unit - Moved in 1999 to March 2000 (%) - Multirace
Year householder moved into unit - Moved in 1999 to March 2000 (%) - Other Race
Year householder moved into unit - Moved in 1995 to 1998 (%)
Year householder moved into unit - Moved in 1995 to 1998 (%) - White
Year householder moved into unit - Moved in 1995 to 1998 (%) - Black or African American
Year householder moved into unit - Moved in 1995 to 1998 (%) - Asian
Year householder moved into unit - Moved in 1995 to 1998 (%) - Hispanic or Latino
Year householder moved into unit - Moved in 1995 to 1998 (%) - American Indian and Alaska Native
Year householder moved into unit - Moved in 1995 to 1998 (%) - Multirace
Year householder moved into unit - Moved in 1995 to 1998 (%) - Other Race
Year householder moved into unit - Moved in 1990 to 1994 (%)
Year householder moved into unit - Moved in 1990 to 1994 (%) - White
Year householder moved into unit - Moved in 1990 to 1994 (%) - Black or African American
Year householder moved into unit - Moved in 1990 to 1994 (%) - Asian
Year householder moved into unit - Moved in 1990 to 1994 (%) - Hispanic or Latino
Year householder moved into unit - Moved in 1990 to 1994 (%) - American Indian and Alaska Native
Year householder moved into unit - Moved in 1990 to 1994 (%) - Multirace
Year householder moved into unit - Moved in 1990 to 1994 (%) - Other Race
Year householder moved into unit - Moved in 1980 to 1989 (%)
Year householder moved into unit - Moved in 1980 to 1989 (%) - White
Year householder moved into unit - Moved in 1980 to 1989 (%) - Black or African American
Year householder moved into unit - Moved in 1980 to 1989 (%) - Asian
Year householder moved into unit - Moved in 1980 to 1989 (%) - Hispanic or Latino
Year householder moved into unit - Moved in 1980 to 1989 (%) - American Indian and Alaska Native
Year householder moved into unit - Moved in 1980 to 1989 (%) - Multirace
Year householder moved into unit - Moved in 1980 to 1989 (%) - Other Race
Year householder moved into unit - Moved in 1970 to 1979 (%)
Year householder moved into unit - Moved in 1970 to 1979 (%) - White
Year householder moved into unit - Moved in 1970 to 1979 (%) - Black or African American
Year householder moved into unit - Moved in 1970 to 1979 (%) - Asian
Year householder moved into unit - Moved in 1970 to 1979 (%) - Hispanic or Latino
Year householder moved into unit - Moved in 1970 to 1979 (%) - American Indian and Alaska Native
Year householder moved into unit - Moved in 1970 to 1979 (%) - Multirace
Year householder moved into unit - Moved in 1970 to 1979 (%) - Other Race
Year householder moved into unit - Moved in 1969 or earlier (%)
Year householder moved into unit - Moved in 1969 or earlier (%) - White
Year householder moved into unit - Moved in 1969 or earlier (%) - Black or African American
Year householder moved into unit - Moved in 1969 or earlier (%) - Asian
Year householder moved into unit - Moved in 1969 or earlier (%) - Hispanic or Latino
Year householder moved into unit - Moved in 1969 or earlier (%) - American Indian and Alaska Native
Year householder moved into unit - Moved in 1969 or earlier (%) - Multirace
Year householder moved into unit - Moved in 1969 or earlier (%) - Other Race
Housing units lacking complete plumbing facilities (%)
Housing units lacking complete kitchen facilities (%)
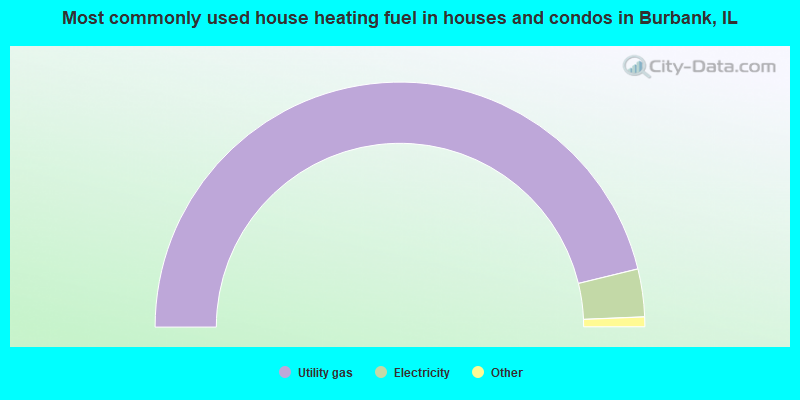
House heating fuel used in houses and condos - Utility gas (%)
House heating fuel used in houses and condos - Bottled, tank, or LP gas (%)
House heating fuel used in houses and condos - Electricity (%)
House heating fuel used in houses and condos - Fuel oil, kerosene, etc. (%)
House heating fuel used in houses and condos - Coal or coke (%)
House heating fuel used in houses and condos - Wood (%)
House heating fuel used in houses and condos - Solar energy (%)
House heating fuel used in houses and condos - Other fuel (%)
House heating fuel used in houses and condos - No fuel used (%)
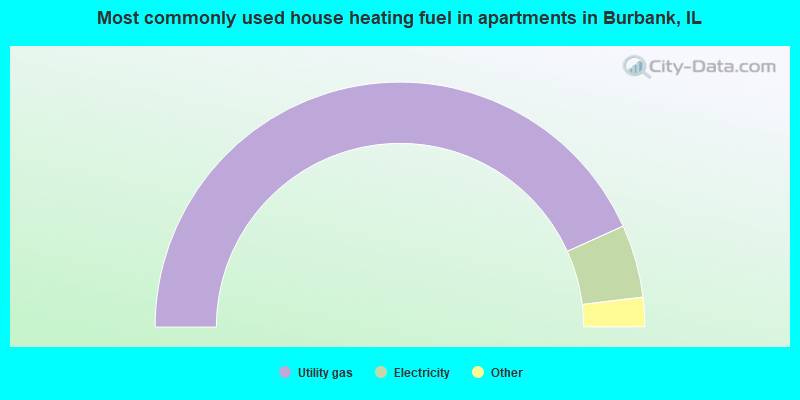
House heating fuel used in apartments - Utility gas (%)
House heating fuel used in apartments - Bottled, tank, or LP gas (%)
House heating fuel used in apartments - Electricity (%)
House heating fuel used in apartments - Fuel oil, kerosene, etc. (%)
House heating fuel used in apartments - Coal or coke (%)
House heating fuel used in apartments - Wood (%)
House heating fuel used in apartments - Solar energy (%)
House heating fuel used in apartments - Other fuel (%)
House heating fuel used in apartments - No fuel used (%)
Latest news about housing in Burbank, IL collected exclusively by city-data.com from local newspapers, TV, and radio stations
Median year house/condo built: 1963Median year apartment built: 1971Household type by relationship:
Households: 28,475
Male householders: 5,295 (1,087 living alone ), Female householders: 3,957 (964 living alone )5,059 spouses (5,037 opposite-sex spouses ), 486 unmarried partners , (486 opposite-sex unmarried partners ), 10,307 children (9,929 natural , 0 adopted , 378 stepchildren ), 845 grandchildren , 500 brothers or sisters , 644 parents , 47 foster children , 503 other relatives , 599 non-relatives In group quarters: 226
Size of family households: 2,484 2-persons , 1,224 3-persons , 1,666 4-persons , 1,157 5-persons , 436 6-persons , 233 7-or-more-persons .
Size of nonfamily households: 2,203 1-person , 70 2-persons , 5 3-persons , 23 4-persons .
4,449 married couples with children. single-parent households (641 men , 1,119 women ).
42.3% of residents of Burbank speak English at home. of residents speak Spanish at home (67% speak English very well , 14% speak English well , 17% speak English not well , 2% don't speak English at all ).of residents speak other Indo-European language at home (38% speak English very well , 28% speak English well , 28% speak English not well , 6% don't speak English at all ).of residents speak Asian or Pacific Island language at home (51% speak English very well , 26% speak English well , 12% speak English not well , 11% don't speak English at all ).of residents speak other language at home (65% speak English very well , 23% speak English well , 8% speak English not well , 4% don't speak English at all ).
Foreign born population: 8,550 (30.0%)of them are naturalized citizens )
Median number of rooms in houses and condos:
Median number of rooms in apartments
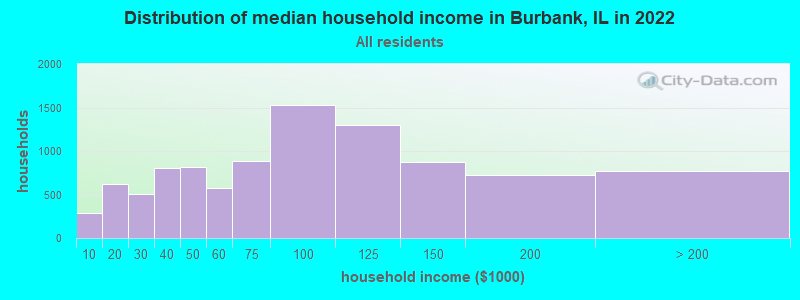
Burbank, IL household income distribution 282 Less than $10,000620 $10,000 to $19,999507 $20,000 to $29,999809 $30,000 to $39,999816 $40,000 to $49,999577 $50,000 to $59,999889 $60,000 to $74,9991,527 $75,000 to $99,9991,301 $100,000 to $124,999871 $125,000 to $149,999722 $150,000 to $199,999765 $200,000 or more
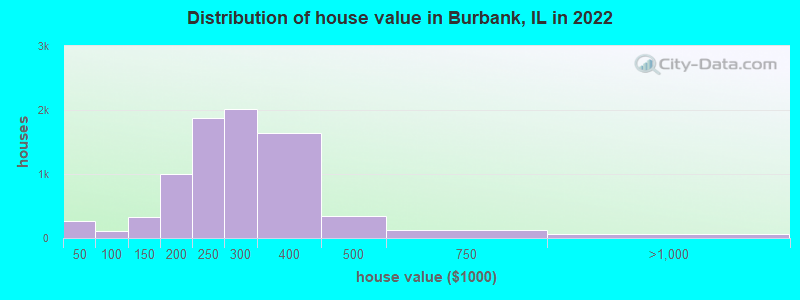
Home value of owner - occupied houses in 2022 in Burbank, IL 76 Less than $10,00019 $10,000 to $14,99931 $15,000 to $19,99935 $20,000 to $24,99988 $25,000 to $29,9999 $30,000 to $34,99912 $35,000 to $39,9997 $60,000 to $69,99938 $80,000 to $89,99964 $90,000 to $99,99995 $100,000 to $124,999238 $125,000 to $149,999496 $150,000 to $174,999500 $175,000 to $199,9991,873 $200,000 to $249,9992,023 $250,000 to $299,9991,634 $300,000 to $399,999339 $400,000 to $499,999123 $500,000 to $749,99941 $750,000 to $999,99922 $2,000,000 or moreRent paid by renters in 2022 in Burbank, IL 50 $200 to $24940 $300 to $34912 $550 to $59921 $750 to $799185 $800 to $899358 $900 to $999614 $1,000 to $1,249275 $1,250 to $1,499196 $1,500 to $1,99910 $2,000 to $2,499136 No cash rent
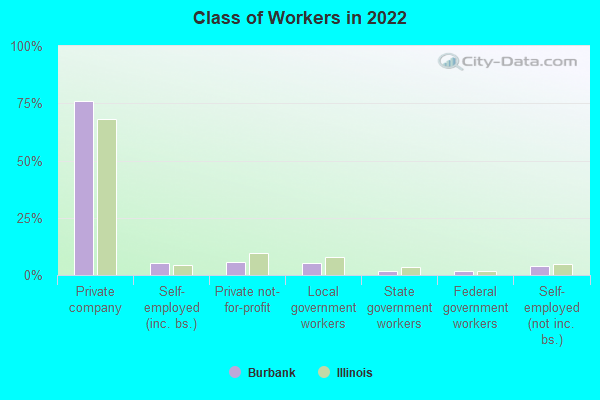
Percentage of workers working in this county: 89.3%Number of people working at home: 750 (5.8% of all workers )
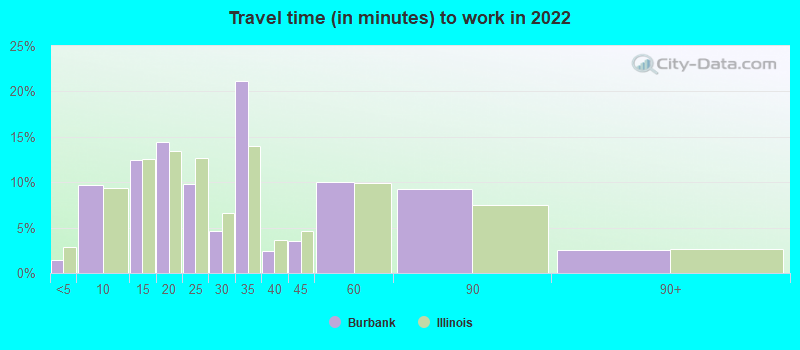
Travel time to work (commute)
Less than 5 minutes: 1335 to 9 minutes: 90710 to 14 minutes: 96115 to 19 minutes: 1,30620 to 24 minutes: 1,70225 to 29 minutes: 83930 to 34 minutes: 1,92235 to 39 minutes: 38840 to 44 minutes: 52945 to 59 minutes: 1,41260 to 89 minutes: 1,17390 or more minutes: 497
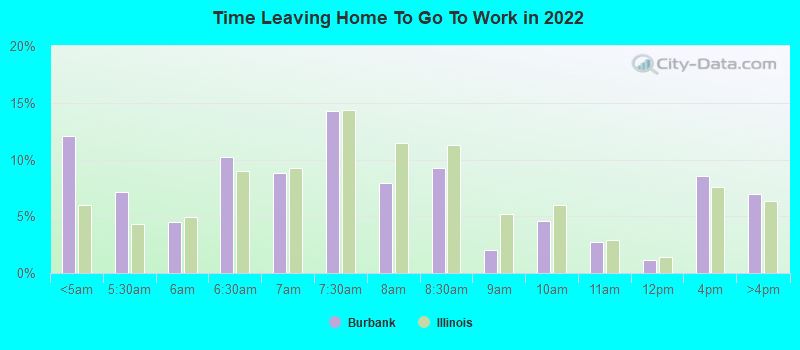
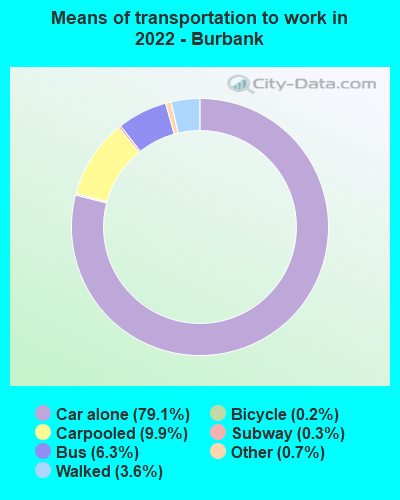
Means of transportation to work:
Drove a car alone: 4,208 (69.5%)Carpooled: 564 (9.3%)Bus : 308 (5.1%)Long-distance train or commuter rail : 12 (0.2%)Taxi: 35 (0.6%)Bicycle: 10 (0.2%)Walked: 198 (3.3%)Worked at home: 750 (12.4%)
Unemployment by race in 2022
Unemployment rate for White non-Hispanic residents 5.2% Males4.0% FemalesUnemployment rate for Black residents 26.5% Males26.6% FemalesUnemployment rate for Asian residents 4.7% MalesUnemployment rate for other race residents 16.2% Males0.8% FemalesUnemployment rate for two or more race residents 8.2% Males10.0% FemalesUnemployment rate for Hispanic or Latino residents 9.2% Males5.7% Females
Year of entry for the foreign-born population in Burbank, Illinois
1,341 2010 or later 1,778 2000 to 2009 2,624 1990 to 1999 1,468 1980 to 1989 1,061 1970 to 1979 1,174 Before 1970
First ancestries reported:
Polish: 3,587 (19.9%)
Palestinian: 754 (4.2%)
Irish: 342 (1.9%)
Italian: 327 (1.8%)
American: 316 (1.8%)
German: 310 (1.7%)
Moroccan: 139 (0.8%)
English: 121 (0.7%)
Lithuanian: 108 (0.6%)
Arab: 101 (0.6%)
Romanian: 96 (0.5%)
Jordanian: 83 (0.5%)
Ukrainian: 52 (0.3%)
Slovak: 45 (0.2%)
Czechoslovakian: 38 (0.2%)
Greek: 27 (0.1%)
Brazilian: 25 (0.1%)
Czech: 25 (0.1%)
African: 24 (0.1%)
Northern European: 21 (0.1%)
Croatian: 16 (0.09%)
Eastern European: 12 (0.07%)
Slovene: 11 (0.06%)
French Canadian: 10 (0.06%)
Norwegian: 9 (0.05%)
Dutch: 7 (0.04%)
Swiss: 6 (0.03%)
British: 4 (0.02%)
Danish: 4 (0.02%) Most common places of birth for foreign-born residents (%): Mexico Burbank:
47.6% (4,070)Illinois:
34.7% (626,958)
Poland Burbank:
27.9% (2,383)Illinois:
6.9% (124,474)
Colombia Burbank:
4.4% (372)Illinois:
0.9% (16,553)
Asia, n.e.c. Burbank:
3.6% (309)Illinois:
0.4% (7,117)
Jordan Burbank:
3.5% (303)Illinois:
0.5% (8,827)
Vietnam Burbank:
2.1% (179)Illinois:
1.2% (22,269)
Philippines Burbank:
1.7% (147)Illinois:
5.2% (93,003)
India Burbank:
1.5% (129)Illinois:
9.2% (166,409)
Place of birth for U.S.-born residents:
This state: 18,367Other state: 1,010Northeast: 147Midwest: 294South: 381West: 176 92.8% of Burbank residents lived in the same house 1 years ago.
Out of people who lived in different houses, 47.0% lived in this county.
Out of people who lived in different counties, 43.8% lived in Illinois.
Burbank:
92.8%State average:
88.3%
Education attainment for males 25 years and older:
No schooling: 362Nursery to 4th grade: 1175th and 6th grade: 2387th and 8th grade: 2099th grade: 14910th grade: 17411th grade: 24412th grade, no diploma: 380High school graduate (or equivalency): 3,495Less than 1 year of college: 685Some college more than 1 year, no degree: 1,429Associate degree: 609Bachelor's degree: 889Master's degree: 261Professional school degree: 53Doctorate degree: 24
Education attainment for females 25 years and older:
No schooling: 447Nursery to 4th grade: 995th and 6th grade: 2407th and 8th grade: 2089th grade: 27610th grade: 6311th grade: 23112th grade, no diploma: 481High school graduate (or equivalency): 3,363Less than 1 year of college: 591Some college more than 1 year, no degree: 1,005Associate degree: 621Bachelor's degree: 1,211Master's degree: 390Professional school degree: 30Doctorate degree: 39
Housing units in structures:
One, detached: 7,974One, attached: 208Two: 2303 or 4: 5255 to 9: 53710 to 19: 30920 to 49: 6950 or more: 41Mobile homes: 56Median worth of mobile homes: $323,555
Housing units lacking complete plumbing facilities in 2022: 0.5%Housing units lacking complete kitchen facilities in 2022: 1.1%House/condo owner moved in on average 17 years ago
Renter moved in on average 6 years ago
Private vs. public school enrollment:
Students in private schools in grades 1 to 8 (elementary and middle school): 177 Students in private schools in grades 9 to 12 (high school): 137 Students in private undergraduate colleges: 458