Races in Burbank, Illinois (IL) Detailed Stats
Data:
Races - White alone (%)
Races - White alone (% change since 2000)
Races - Black alone (%)
Races - Black alone (% change since 2000)
Races - American Indian alone (%)
Races - American Indian alone (% change since 2000)
Races - Asian alone (%)
Races - Asian alone (% change since 2000)
Races - Hispanic (%)
Races - Hispanic (% change since 2000)
Races - Native Hawaiian and Other Pacific Islander alone (%)
Races - Native Hawaiian and Other Pacific Islander alone (% change since 2000)
Races - Two or more races(%)
Races - Two or more races(% change since 2000)
Races - Other race alone (%)
Races - Other race alone (% change since 2000)
Racial diversity
Place of birth - Born in state of residence (%)
Place of birth - Born in state of residence (%) - White
Place of birth - Born in state of residence (%) - Black or African American
Place of birth - Born in state of residence (%) - Asian
Place of birth - Born in state of residence (%) - Hispanic or Latino
Place of birth - Born in state of residence (%) - American Indian and Alaska Native
Place of birth - Born in state of residence (%) - Multirace
Place of birth - Born in state of residence (%) - Other Race
Place of birth - Born in other state (%)
Place of birth - Born in other state (%) - White
Place of birth - Born in other state (%) - Black or African American
Place of birth - Born in other state (%) - Asian
Place of birth - Born in other state (%) - Hispanic or Latino
Place of birth - Born in other state (%) - American Indian and Alaska Native
Place of birth - Born in other state (%) - Multirace
Place of birth - Born in other state (%) - Other Race
Place of birth - Native, outside of US (%)
Place of birth - Native, outside of US (%) - White
Place of birth - Native, outside of US (%) - Black or African American
Place of birth - Native, outside of US (%) - Asian
Place of birth - Native, outside of US (%) - Hispanic or Latino
Place of birth - Native, outside of US (%) - American Indian and Alaska Native
Place of birth - Native, outside of US (%) - Multirace
Place of birth - Native, outside of US (%) - Other Race
Place of birth - Foreign born (%)
Place of birth - Foreign born (%) - White
Place of birth - Foreign born (%) - Black or African American
Place of birth - Foreign born (%) - Asian
Place of birth - Foreign born (%) - Hispanic or Latino
Place of birth - Foreign born (%) - American Indian and Alaska Native
Place of birth - Foreign born (%) - Multirace
Place of birth - Foreign born (%) - Other Race
Residents speaking English at home (%)
Residents speaking English at home - Born in the United States (%)
Residents speaking English at home - Native, born elsewhere (%)
Residents speaking English at home - Foreign born (%)
Residents speaking Spanish at home (%)
Residents speaking Spanish at home - Born in the United States (%)
Residents speaking Spanish at home - Native, born elsewhere (%)
Residents speaking Spanish at home - Foreign born (%)
Residents speaking other language at home (%)
Residents speaking other language at home - Born in the United States (%)
Residents speaking other language at home - Native, born elsewhere (%)
Residents speaking other language at home - Foreign born (%)
Marital status - Never married (%)
Marital status - Now married (%)
Marital status - Separated (%)
Marital status - Widowed (%)
Marital status - Divorced (%)
Ancestries Reported - Arab (%)
Ancestries Reported - Czech (%)
Ancestries Reported - Danish (%)
Ancestries Reported - Dutch (%)
Ancestries Reported - English (%)
Ancestries Reported - French (%)
Ancestries Reported - French Canadian (%)
Ancestries Reported - German (%)
Ancestries Reported - Greek (%)
Ancestries Reported - Hungarian (%)
Ancestries Reported - Irish (%)
Ancestries Reported - Italian (%)
Ancestries Reported - Lithuanian (%)
Ancestries Reported - Norwegian (%)
Ancestries Reported - Polish (%)
Ancestries Reported - Portuguese (%)
Ancestries Reported - Russian (%)
Ancestries Reported - Scotch-Irish (%)
Ancestries Reported - Scottish (%)
Ancestries Reported - Slovak (%)
Ancestries Reported - Subsaharan African (%)
Ancestries Reported - Swedish (%)
Ancestries Reported - Swiss (%)
Ancestries Reported - Ukrainian (%)
Ancestries Reported - United States (%)
Ancestries Reported - Welsh (%)
Ancestries Reported - West Indian (%)
Ancestries Reported - Other (%)
Geographical mobility - Same house 1 year ago (%)
Geographical mobility - Same house 1 year ago (%) - White
Geographical mobility - Same house 1 year ago (%) - Black or African American
Geographical mobility - Same house 1 year ago (%) - Asian
Geographical mobility - Same house 1 year ago (%) - Hispanic or Latino
Geographical mobility - Same house 1 year ago (%) - American Indian and Alaska Native
Geographical mobility - Same house 1 year ago (%) - Multirace
Geographical mobility - Same house 1 year ago (%) - Other Race
Geographical mobility - Moved within same county (%)
Geographical mobility - Moved within same county (%) - White
Geographical mobility - Moved within same county (%) - Black or African American
Geographical mobility - Moved within same county (%) - Asian
Geographical mobility - Moved within same county (%) - Hispanic or Latino
Geographical mobility - Moved within same county (%) - American Indian and Alaska Native
Geographical mobility - Moved within same county (%) - Multirace
Geographical mobility - Moved within same county (%) - Other Race
Geographical mobility - Moved from different county within same state (%)
Geographical mobility - Moved from different county within same state (%) - White
Geographical mobility - Moved from different county within same state (%) - Black or African American
Geographical mobility - Moved from different county within same state (%) - Asian
Geographical mobility - Moved from different county within same state (%) - Hispanic or Latino
Geographical mobility - Moved from different county within same state (%) - American Indian and Alaska Native
Geographical mobility - Moved from different county within same state (%) - Multirace
Geographical mobility - Moved from different county within same state (%) - Other Race
Geographical mobility - Moved from different state (%)
Geographical mobility - Moved from different state (%) - White
Geographical mobility - Moved from different state (%) - Black or African American
Geographical mobility - Moved from different state (%) - Asian
Geographical mobility - Moved from different state (%) - Hispanic or Latino
Geographical mobility - Moved from different state (%) - American Indian and Alaska Native
Geographical mobility - Moved from different state (%) - Multirace
Geographical mobility - Moved from different state (%) - Other Race
Geographical mobility - Moved from abroad (%)
Geographical mobility - Moved from abroad (%) - White
Geographical mobility - Moved from abroad (%) - Black or African American
Geographical mobility - Moved from abroad (%) - Asian
Geographical mobility - Moved from abroad (%) - Hispanic or Latino
Geographical mobility - Moved from abroad (%) - American Indian and Alaska Native
Geographical mobility - Moved from abroad (%) - Multirace
Geographical mobility - Moved from abroad (%) - Other Race
Place of birth for the foreign-born population - Ireland (%)
Place of birth for the foreign-born population - Denmark (%)
Place of birth for the foreign-born population - Norway (%)
Place of birth for the foreign-born population - Sweden (%)
Place of birth for the foreign-born population - United Kingdom (%)
Place of birth for the foreign-born population - England (%)
Place of birth for the foreign-born population - Scotland (%)
Place of birth for the foreign-born population - Other Northern Europe (%)
Place of birth for the foreign-born population - Austria (%)
Place of birth for the foreign-born population - Belgium (%)
Place of birth for the foreign-born population - France (%)
Place of birth for the foreign-born population - Germany (%)
Place of birth for the foreign-born population - Netherlands (%)
Place of birth for the foreign-born population - Switzerland (%)
Place of birth for the foreign-born population - Other Western Europe (%)
Place of birth for the foreign-born population - Greece (%)
Place of birth for the foreign-born population - Italy (%)
Place of birth for the foreign-born population - Portugal (%)
Place of birth for the foreign-born population - Spain (%)
Place of birth for the foreign-born population - Other Southern Europe (%)
Place of birth for the foreign-born population - Albania (%)
Place of birth for the foreign-born population - Belarus (%)
Place of birth for the foreign-born population - Bosnia and Herzegovina (%)
Place of birth for the foreign-born population - Bulgaria (%)
Place of birth for the foreign-born population - Croatia (%)
Place of birth for the foreign-born population - Czechoslovakia (%)
Place of birth for the foreign-born population - Hungary (%)
Place of birth for the foreign-born population - Latvia (%)
Place of birth for the foreign-born population - Lithuania (%)
Place of birth for the foreign-born population - North Macedonia (Macedonia) (%)
Place of birth for the foreign-born population - Moldova (%)
Place of birth for the foreign-born population - Poland (%)
Place of birth for the foreign-born population - Romania (%)
Place of birth for the foreign-born population - Russia (%)
Place of birth for the foreign-born population - Serbia (%)
Place of birth for the foreign-born population - Ukraine (%)
Place of birth for the foreign-born population - Other Eastern Europe (%)
Place of birth for the foreign-born population - China (%)
Place of birth for the foreign-born population - Hong Kong (%)
Place of birth for the foreign-born population - Taiwan (%)
Place of birth for the foreign-born population - Japan (%)
Place of birth for the foreign-born population - Korea (%)
Place of birth for the foreign-born population - Other Eastern Asia (%)
Place of birth for the foreign-born population - Afghanistan (%)
Place of birth for the foreign-born population - Bangladesh (%)
Place of birth for the foreign-born population - India (%)
Place of birth for the foreign-born population - Iran (%)
Place of birth for the foreign-born population - Kazakhstan (%)
Place of birth for the foreign-born population - Nepal (%)
Place of birth for the foreign-born population - Pakistan (%)
Place of birth for the foreign-born population - Sri Lanka (%)
Place of birth for the foreign-born population - Uzbekistan (%)
Place of birth for the foreign-born population - Other South Central Asia (%)
Place of birth for the foreign-born population - Burma (%)
Place of birth for the foreign-born population - Cambodia (%)
Place of birth for the foreign-born population - Indonesia (%)
Place of birth for the foreign-born population - Laos (%)
Place of birth for the foreign-born population - Malaysia (%)
Place of birth for the foreign-born population - Philippines (%)
Place of birth for the foreign-born population - Singapore (%)
Place of birth for the foreign-born population - Thailand (%)
Place of birth for the foreign-born population - Vietnam (%)
Place of birth for the foreign-born population - Other South Eastern Asia (%)
Place of birth for the foreign-born population - Armenia (%)
Place of birth for the foreign-born population - Iraq (%)
Place of birth for the foreign-born population - Israel (%)
Place of birth for the foreign-born population - Jordan (%)
Place of birth for the foreign-born population - Kuwait (%)
Place of birth for the foreign-born population - Lebanon (%)
Place of birth for the foreign-born population - Saudi Arabia (%)
Place of birth for the foreign-born population - Syria (%)
Place of birth for the foreign-born population - Turkey (%)
Place of birth for the foreign-born population - Yemen (%)
Place of birth for the foreign-born population - Other Western Asia (%)
Place of birth for the foreign-born population - Eritrea (%)
Place of birth for the foreign-born population - Ethiopia (%)
Place of birth for the foreign-born population - Kenya (%)
Place of birth for the foreign-born population - Somalia (%)
Place of birth for the foreign-born population - Uganda (%)
Place of birth for the foreign-born population - Zimbabwe (%)
Place of birth for the foreign-born population - Other Eastern Africa (%)
Place of birth for the foreign-born population - Cameroon (%)
Place of birth for the foreign-born population - Congo (%)
Place of birth for the foreign-born population - Democratic Republic of Congo (Zaire) (%)
Place of birth for the foreign-born population - Other Middle Africa (%)
Place of birth for the foreign-born population - Egypt (%)
Place of birth for the foreign-born population - Morocco (%)
Place of birth for the foreign-born population - Sudan (%)
Place of birth for the foreign-born population - Other Northern Africa (%)
Place of birth for the foreign-born population - South Africa (%)
Place of birth for the foreign-born population - Other Southern Africa (%)
Place of birth for the foreign-born population - Cabo Verde (%)
Place of birth for the foreign-born population - Ghana (%)
Place of birth for the foreign-born population - Liberia (%)
Place of birth for the foreign-born population - Nigeria (%)
Place of birth for the foreign-born population - Senegal (%)
Place of birth for the foreign-born population - Sierra Leone (%)
Place of birth for the foreign-born population - Other Western Africa (%)
Place of birth for the foreign-born population - Australia (%)
Place of birth for the foreign-born population - New Zealand (%)
Place of birth for the foreign-born population - Fiji (%)
Place of birth for the foreign-born population - Micronesia (%)
Place of birth for the foreign-born population - Bahamas (%)
Place of birth for the foreign-born population - Barbados (%)
Place of birth for the foreign-born population - Cuba (%)
Place of birth for the foreign-born population - Dominica (%)
Place of birth for the foreign-born population - Dominican Republic (%)
Place of birth for the foreign-born population - Grenada (%)
Place of birth for the foreign-born population - Haiti (%)
Place of birth for the foreign-born population - Jamaica (%)
Place of birth for the foreign-born population - St. Vincent and the Grenadines (%)
Place of birth for the foreign-born population - Trinidad and Tobago (%)
Place of birth for the foreign-born population - West Indies (%)
Place of birth for the foreign-born population - Other Caribbean (%)
Place of birth for the foreign-born population - Belize (%)
Place of birth for the foreign-born population - Costa Rica (%)
Place of birth for the foreign-born population - El Salvador (%)
Place of birth for the foreign-born population - Guatemala (%)
Place of birth for the foreign-born population - Honduras (%)
Place of birth for the foreign-born population - Mexico (%)
Place of birth for the foreign-born population - Nicaragua (%)
Place of birth for the foreign-born population - Panama (%)
Place of birth for the foreign-born population - Other Central America (%)
Place of birth for the foreign-born population - Argentina (%)
Place of birth for the foreign-born population - Bolivia (%)
Place of birth for the foreign-born population - Brazil (%)
Place of birth for the foreign-born population - Chile (%)
Place of birth for the foreign-born population - Colombia (%)
Place of birth for the foreign-born population - Ecuador (%)
Place of birth for the foreign-born population - Guyana (%)
Place of birth for the foreign-born population - Peru (%)
Place of birth for the foreign-born population - Uruguay (%)
Place of birth for the foreign-born population - Venezuela (%)
Place of birth for the foreign-born population - Other South America (%)
Place of birth for the foreign-born population - Canada (%)
Place of birth for the foreign-born population - Other Northern America (%)
Place of birth for the foreign-born population - Other (%)
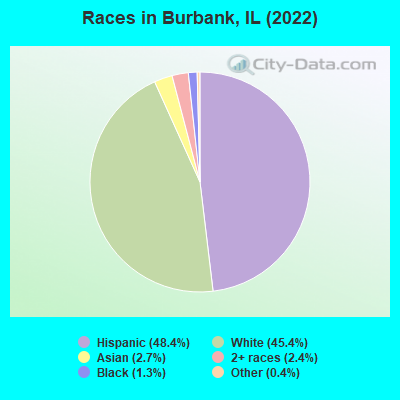
According to 2022 data, the most numerous races in Burbank, IL are White alone (12,924 residents), Hispanic (13,771 residents), and Black alone (356 residents). 42.0% of Burbank residents speak English at home. 30.0% of Burbank, IL residents are foreign-born (15.6% born in Latin America, 9.5% born in Europe, 4.2% born in Asia), which is 53.4% greater than the foreign-born rate of 14.0% across the entire state of Illinois.
Race distribution in Burbank
2000 2022
8,424,140 67.8% White alone 1,856,152 14.9% Black alone 1,530,262 12.3% Hispanic 419,916 3.4% Asian alone 153,996 1.2% Two or more races 13,479 0.1% Other race alone 18,232 0.1% American Indian alone 3,116 0.03% Native Hawaiian and Other
7,356,301 58.5% White alone 2,299,726 18.3% Hispanic 1,660,423 13.2% Black alone 747,296 5.9% Asian alone 458,599 3.6% Two or more races 45,386 0.4% Other race alone 10,405 0.08% American Indian alone 3,896 0.03% Native Hawaiian and Other
Income and house value in Burbank Median household income in 2022 $68,690 White non-Hispanic householders$83,048 Black householders$109,356 Asian householders$105,671 Some other race householders$96,916 Two or more races householders$98,079 Hispanic or Latino race householdersMedian 2022 house value $254,978 White Non-Hispanic householders$209,839 American Indian or Alaska Native householders $351,597 Asian householders$257,403 Some other race householders$300,490 Two or more races householders$272,884 Hispanic or Latino householders
Median age by race in Burbank
46.4 Median age for White residents44.7 48.5 37.1 Median age for Black or African American residents40.7 37.2 26.0 Median age for American Indian / Alaska Native residents32.2 20.7 49.5 Median age for Asian residents51.3 38.0 -687,999,999.3 Median age for Native Hawaiian / Pacific Islander residents-918,721,460.3 -610,229,276.3 35.1 Median age for Other race residents35.1 35.1 26.8 Median age for Two or more races residents20.6 32.8 52.3 Median age for White alone residents50.6 54.8 29.9 Median age for Hispanic or Latino residents28.8 31.3
Owner/renter occupied households by race in Burbank
House owners and renters - White residents 4,910 79.8% Owner occupied1,245 20.2% Renter occupiedHouse owners and renters - Black or African American residents 31 17.3% Owner occupied149 82.7% Renter occupiedHouse owners and renters - American Indian / Alaska Native residents 70 100.0% Owner occupiedHouse owners and renters - Asian residents 174 83.4% Owner occupied35 16.6% Renter occupiedHouse owners and renters - Other race residents 1,382 90.6% Owner occupied144 9.4% Renter occupiedHouse owners and renters - Two or more races residents 1,506 82.6% Owner occupied316 17.4% Renter occupiedHouse owners and renters - White alone residents 4,285 80.2% Owner occupied1,055 19.8% Renter occupiedHouse owners and renters - Hispanic or Latino residents 3,134 83.9% Owner occupied603 16.1% Renter occupied
Language usage in Burbank
English speakers - Total 42.0% of residents of Burbank speak English at home.
37.6% of residents speak Spanish at home 6,765 66.9% Speak English very well3,342 33.1% Speak English less than very well20.7% of residents speak other language at home 2,540 45.7% Speak English very well3,019 54.3% Speak English less than very well
English speakers - Born in the United States 58.9% of residents of Burbank speak English at home.
33.7% of residents speak Spanish at home 267 80.7% Speak English very well64 19.3% Speak English less than very well6.8% of residents speak other language at home 55 82.1% Speak English very well12 17.9% Speak English less than very well
English speakers - Native, born elsewhere 25.4% of residents of Burbank speak English at home.
37.0% of residents speak Spanish at home 116 59.8% Speak English very well78 40.2% Speak English less than very well38.5% of residents speak other language at home 84 41.6% Speak English very well118 58.4% Speak English less than very well
English speakers - Foreign-born 6.4% of residents of Burbank speak English at home.
50.3% of residents speak Spanish at home 1,572 36.6% Speak English very well2,721 63.4% Speak English less than very well43.6% of residents speak other language at home 1,070 28.8% Speak English very well2,651 71.2% Speak English less than very well
White (Caucasian) - Speak only English Native:
73.6% (8,196)Foreign-born:
5.6% (186)
White (Caucasian) - Speak another language Native:
22.0% (2,448)Foreign-born:
93.7% (3,097)
Black or African American - Speak another language Native:
11.6% (45)Foreign-born:
91.2% (11)
American Indian / Alaska Native - Speak another language Native:
100.0% (143)Foreign-born:
100.0% (58)
Asian - Speak only English Native:
47.5% (104)Foreign-born:
13.1% (67)
Asian - Speak another language Native:
52.4% (115)Foreign-born:
86.6% (438)
Other race - Speak only English Native:
27.4% (742)Foreign-born:
6.6% (145)
Other race - Speak another language Native:
72.8% (1,973)Foreign-born:
93.1% (2,038)
Two or more races - Speak only English Native:
34.6% (1,558)Foreign-born:
8.1% (208)
Two or more races - Speak another language Native:
67.2% (3,027)Foreign-born:
91.9% (2,347)
White alone - Speak only English Native:
81.0% (7,518)Foreign-born:
6.2% (205)
White alone - Speak another language Native:
20.1% (1,870)Foreign-born:
94.9% (3,152)
Hispanic or Latino - Speak only English Native:
29.6% (2,381)Foreign-born:
4.5% (202)
Hispanic or Latino - Speak another language Native:
70.2% (5,638)Foreign-born:
95.5% (4,290)
Foreign-born residents in Burbank 8,550 residents are foreign born (15.6% Latin America , 9.5% Europe , 4.2% Asia ).
This city:
30.0%Illinois:
14.1%
Marital status for residents in Burbank Marital status - White (Caucasian) population 15 years and over
Males 34.9% Never married52.5% Now married2.1% Separated4.5% Widowed5.9% DivorcedFemales 27.7% Never married48.5% Now married1.6% Separated12.2% Widowed10.0% DivorcedWomen who gave birth in the past 12 months Now married:
77.9% (114)Unmarried:
22.1% (32)
Women who did not give birth in the past 12 months Now married:
41.6% (1,196)Unmarried:
58.4% (1,679)
Marital status - Black or African American population 15 years and over
Males 63.5% Never married32.6% Now married0.0% Separated3.9% Widowed0.0% DivorcedFemales 30.4% Never married52.9% Now married0.0% Separated16.7% Widowed0.0% DivorcedWomen who did not give birth in the past 12 months Now married:
75.0% (51)Unmarried:
25.0% (17)
Marital status - American Indian / Alaska Native population 15 years and over
Males 30.4% Never married69.6% Now married0.0% Separated0.0% Widowed0.0% DivorcedFemales 7.7% Never married92.3% Now married0.0% Separated0.0% Widowed0.0% DivorcedWomen who did not give birth in the past 12 months Now married:
87.5% (38)Unmarried:
12.5% (5)
Marital status - Asian population 15 years and over
Males 31.5% Never married62.3% Now married0.0% Separated0.0% Widowed6.2% DivorcedFemales 33.0% Never married58.1% Now married0.0% Separated0.0% Widowed8.9% DivorcedWomen who did not give birth in the past 12 months Now married:
49.2% (126)Unmarried:
50.8% (130)
Marital status - Other race population 15 years and over
Males 47.7% Never married50.1% Now married0.8% Separated0.0% Widowed1.4% DivorcedFemales 42.9% Never married39.3% Now married4.8% Separated0.6% Widowed12.4% DivorcedWomen who did not give birth in the past 12 months Now married:
40.7% (560)Unmarried:
59.3% (817)
Marital status - Two or more races population 15 years and over
Males 47.0% Never married40.8% Now married8.2% Separated0.0% Widowed4.0% DivorcedFemales 39.9% Never married52.5% Now married2.6% Separated1.5% Widowed3.5% DivorcedWomen who gave birth in the past 12 months Now married:
6.5% (4)Unmarried:
93.5% (60)
Women who did not give birth in the past 12 months Now married:
48.3% (867)Unmarried:
51.7% (928)
Marital status - White alone, not Hispanic / Latino population 15 years and over
Males 33.8% Never married51.6% Now married2.1% Separated5.3% Widowed7.3% DivorcedFemales 26.2% Never married48.0% Now married1.5% Separated14.2% Widowed10.1% DivorcedWomen who gave birth in the past 12 months Now married:
68.8% (31)Unmarried:
31.3% (14)
Women who did not give birth in the past 12 months Now married:
38.2% (860)Unmarried:
61.8% (1,394)
Marital status - Hispanic or Latino population 15 years and over
Males 44.7% Never married49.0% Now married4.2% Separated0.4% Widowed1.7% DivorcedFemales 39.1% Never married47.2% Now married3.2% Separated1.8% Widowed8.7% DivorcedWomen who gave birth in the past 12 months Now married:
61.2% (104)Unmarried:
38.8% (66)
Women who did not give birth in the past 12 months Now married:
46.2% (1,578)Unmarried:
53.8% (1,840)
Ancestries in Burbank
3,587 19.9% Polish754 4.2% Palestinian342 1.9% Irish327 1.8% Italian316 1.8% American310 1.7% German139 0.8% Moroccan121 0.7% English108 0.6% Lithuanian101 0.6% Arab96 0.5% Romanian83 0.5% Jordanian52 0.3% Ukrainian45 0.2% Slovak38 0.2% Czechoslovakian27 0.1% Greek25 0.1% Brazilian25 0.1% Czech24 0.1% African21 0.1% Northern European16 0.09% Croatian12 0.07% Eastern European11 0.06% Slovene10 0.06% French Canadian9 0.05% Norwegian7 0.04% Dutch6 0.03% Swiss4 0.02% British4 0.02% Danish
Geographical mobility in Burbank Same house 1 year ago 14,266 94.4% White (Caucasian)381 92.6% Black or African American258 93.4% American Indian / Alaska Native716 95.1% Asian5,013 94.2% Other race6,321 83.8% Two or more races12,238 94.9% White alone, not Hispanic / Latino12,307 90.6% Hispanic or LatinoMoved within same county 473 3.1% White / Caucasian29 7.1% Black or African American17 6.2% American Indian / Alaska Native31 4.1% Asian253 4.8% Other race1,110 14.7% Two or more races363 2.8% White alone, not Hispanic / Latino1,053 7.8% Hispanic or LatinoMoved within same state 95 0.6% White / Caucasian65 0.5% White alone, not Hispanic / Latino39 0.3% Hispanic or LatinoMoved from different state 88 0.6% White / Caucasian36 0.7% Other race90 0.7% White alone, not Hispanic / Latino49 0.4% Hispanic or LatinoMoved from abroad 72 0.5% White20 0.4% Other race69 0.9% Two or more races79 0.6% White alone, not Hispanic / Latino70 0.5% Hispanic or Latino
Children Nativity (place of birth) in Burbank
Children under 6 years - Living with two parents Both parents native 521 100.0% NativeBoth parents foreign-born 470 100.0% NativeOne native, one foreign-born parent 189 100.0% NativeChildren under 6 years - Living with one parent Native parent 469 100.0% NativeForeign-born parent 57 68.6% Native26 31.4% Foreign-bornChildren 6 to 17 years - Living with two parents Both parents native 911 100.0% NativeBoth parents foreign-born 1,671 94.9% Native90 5.1% Foreign-bornOne native, one foreign-born parent 817 100.0% NativeChildren 6 to 17 years - Living with one parent Native parent 591 100.0% NativeForeign-born parent 956 53.0% Native848 47.0% Foreign-born
Grandparents responsible for own grandchildren in Burbank
Grandparents (30 to 59 years) White / Caucasian 24 17.1% Responsible for grandchildren118 82.9% Not responsible for grandchildrenAsian 49 100.0% Not responsible for grandchildrenOther race 61 100.0% Not responsible for grandchildrenTwo or more races 88 56.3% Responsible for grandchildren68 43.7% Not responsible for grandchildrenWhite alone, not Hispanic / Latino 18 19.0% Responsible for grandchildren78 81.0% Not responsible for grandchildrenHispanic or Latino 94 39.9% Responsible for grandchildren141 60.1% Not responsible for grandchildrenGrandparents (60 years and over) White / Caucasian 15 5.4% Responsible for grandchildren264 94.6% Not responsible for grandchildrenAsian 15 100.0% Not responsible for grandchildrenOther race 61 100.0% Not responsible for grandchildrenTwo or more races 2 1.7% Responsible for grandchildren122 98.3% Not responsible for grandchildrenWhite alone, not Hispanic / Latino 17 5.2% Responsible for grandchildren316 94.8% Not responsible for grandchildrenHispanic or Latino 3 1.6% Responsible for grandchildren157 98.4% Not responsible for grandchildren