Bolingbrook, IL (Illinois) Houses and Residents
| Bolingbrook: | $293,200 |
| Illinois: | $251,600 |
Mean price in 2022:
Detached houses: $327,856
Here: $327,856 State: $310,164 Townhouses or other attached units: $218,276
Here: $218,276 State: $286,230 In 2-unit structures: $331,722
Here: $331,722 State: $299,638 In 3-to-4-unit structures: $148,767
Here: $148,767 State: $330,907 In 5-or-more-unit structures: $140,297
Here: $140,297 State: $318,887 Mobile homes: $452,860
Here: $452,860 State: $78,855
Total population: 74,180 (Urban population: 56,399, Rural population: 55 (13 farm, 42 nonfarm))
Houses: 27,001 (26,585 occupied: 20,935 owner occupied, 5,650 renter occupied)
| % of renters here: | 21% |
| State: | 33% |
Housing density: 1,317 houses/condos per square mile
Median price asked for vacant for-sale houses and condos in 2022: $184,301.
Median contract rent in 2022: $1,562 (lower quartile is $1,029, upper quartile is $1,914)
Median rent asked for vacant for-rent units in 2022: $1,348
Median gross rent in Bolingbrook, IL in 2022: $1,717
Housing units in Bolingbrook with a mortgage: 14,416 (1,067 second mortgage, 0 home equity loan, 826 both second mortgage and home equity loan)
Houses without a mortgage: 497
Median household income for houses/condos with a mortgage: $113,866
Median household income for apartments without a mortgage: $69,782
Median monthly housing costs: $1,724
Compare current foreclosures in Bolingbrook, IL:
| Photo | Address | Area | Beds / Baths | Price | Details |
|---|---|---|---|---|---|

|
#1
Stonegate Rd
Bolingbrook, IL 60440
|
2,800 sq. feet
|
2 baths 4 beds |
show details | |

|
#2
Riverside Dr
Bolingbrook, IL 60440
|
895 sq. feet
|
2 baths 3 beds |
show details | |

|
#3
Coral Ct
Bolingbrook, IL 60440
|
1,329 sq. feet
|
- baths 3 beds |
show details | |

|
#4
Metropolitan Ave
Bolingbrook, IL 60490
|
3,205 sq. feet
|
- baths - beds |
show details | |

|
#5
Patricia Dr
Bolingbrook, IL 60490
|
- sq. feet
|
- baths - beds |
show details | |

|
#6
Woodcreek Dr, Apt 313
Bolingbrook, IL 60440
|
- sq. feet
|
- baths - beds |
show details | |

|
#7
Eagle Ct Unit C
Bolingbrook, IL 60440
|
- sq. feet
|
- baths - beds |
show details | |

|
#8
Fernwood D D
Bolingbrook, IL 60440
|
- sq. feet
|
- baths - beds |
show details | |

|
#9
Hadleigh Rd
Bolingbrook, IL 60440
|
- sq. feet
|
- baths - beds |
show details | |

|
#10
Raes Creek Dr
Bolingbrook, IL 60490
|
- sq. feet
|
- baths - beds |
show details |
| Photo | Address | Area | Beds / Baths | Price | Details |
|---|---|---|---|---|---|

|
#11
Janes Ave, # 7-208
Bolingbrook, IL 60440
|
- sq. feet
|
- baths - beds |
show details | |

|
#12
Regal Ln
Bolingbrook, IL 60490
|
- sq. feet
|
- baths - beds |
show details | |

|
#13
Langford Dr
Bolingbrook, IL 60440
|
- sq. feet
|
- baths - beds |
show details | |

|
#14
W Crossroads Pkwy Ste I
Bolingbrook, IL 60490
|
- sq. feet
|
- baths - beds |
show details | |

|
#15
Fernwood Dr
Bolingbrook, IL 60440
|
- sq. feet
|
- baths - beds |
show details | |

|
#16
Evans Street
Bolingbrook, IL 60490
|
- sq. feet
|
- baths - beds |
show details | |

|
#17
Fernwood Dr
Bolingbrook, IL 60440
|
- sq. feet
|
- baths - beds |
show details | |

|
#18
Gettysburg Dr
Bolingbrook, IL 60440
|
- sq. feet
|
- baths - beds |
show details | |

|
#19
Calumet Ct Unit A
Bolingbrook, IL 60440
|
- sq. feet
|
- baths - beds |
show details | |

|
#20
Standish Ct
Bolingbrook, IL 60440
|
- sq. feet
|
- baths - beds |
show details |
| Photo | Address | Area | Beds / Baths | Price | Details |
|---|---|---|---|---|---|

|
#21
Spruce Rd
Bolingbrook, IL 60440
|
- sq. feet
|
- baths - beds |
show details | |

|
#22
Lake Shore Dr # 317
Bolingbrook, IL 60440
|
- sq. feet
|
- baths - beds |
show details | |

|
#23
Lily Cache Ln, Apt 219
Bolingbrook, IL 60490
|
- sq. feet
|
- baths - beds |
show details | |

|
#24
Dubois Cir
Bolingbrook, IL 60440
|
- sq. feet
|
- baths - beds |
show details | |

|
#25
Elm Ct
Bolingbrook, IL 60440
|
- sq. feet
|
- baths - beds |
show details | |

|
#26
Williamsburg Ln
Bolingbrook, IL 60440
|
- sq. feet
|
- baths - beds |
show details | |

|
#27
Enclave Cir Unit D
Bolingbrook, IL 60440
|
- sq. feet
|
- baths - beds |
show details | |

|
#28
Janes Ave, Unit 204
Bolingbrook, IL 60440
|
- sq. feet
|
- baths - beds |
show details | |

|
#29
Lake Shore Dr
Bolingbrook, IL 60440
|
- sq. feet
|
- baths - beds |
show details | |

|
#30
Whitewater Dr, Apt 102
Bolingbrook, IL 60440
|
- sq. feet
|
- baths - beds |
show details |
| Photo | Address | Area | Beds / Baths | Price | Details |
|---|---|---|---|---|---|

|
#31
Fernwood Dr
Bolingbrook, IL 60440
|
- sq. feet
|
- baths - beds |
show details | |

|
#32
River Hills Ln
Bolingbrook, IL 60490
|
- sq. feet
|
- baths - beds |
show details | |

|
#33
Pacific Dr
Bolingbrook, IL 60440
|
- sq. feet
|
- baths - beds |
show details | |

|
#34
Lexington Dr
Bolingbrook, IL 60440
|
- sq. feet
|
- baths - beds |
show details | |

|
#35
Foxhead Ct Unit A
Bolingbrook, IL 60440
|
- sq. feet
|
- baths - beds |
show details | |

|
#36
Enclave Cir Unit A
Bolingbrook, IL 60440
|
- sq. feet
|
- baths - beds |
show details | |

|
#37
Enclave Cir Unit D
Bolingbrook, IL 60440
|
- sq. feet
|
- baths - beds |
show details | |

|
#38
Whitewater Dr Apt 305
Bolingbrook, IL 60440
|
- sq. feet
|
- baths - beds |
show details | |

|
#39
Kildeer Dr Apt 358
Bolingbrook, IL 60440
|
- sq. feet
|
- baths - beds |
show details | |

|
#40
E 83rd St
Bolingbrook, IL 60440
|
- sq. feet
|
- baths - beds |
show details |
| Photo | Address | Area | Beds / Baths | Price | Details |
|---|---|---|---|---|---|

|
#41
Preston Dr Apt 304
Bolingbrook, IL 60440
|
- sq. feet
|
- baths - beds |
show details | |

|
#42
Skokie Ln
Bolingbrook, IL 60440
|
- sq. feet
|
- baths - beds |
show details | |

|
#43
Thomas Rd
Bolingbrook, IL 60440
|
- sq. feet
|
- baths - beds |
show details | |

|
#44
S Ashbury Ave
Bolingbrook, IL 60440
|
- sq. feet
|
- baths - beds |
show details | |

|
#45
Pinebrook Dr
Bolingbrook, IL 60490
|
- sq. feet
|
- baths - beds |
show details | |

|
#46
Aristocrat Dr
Bolingbrook, IL 60490
|
- sq. feet
|
- baths - beds |
show details | |

|
#47
Picnic Ct
Bolingbrook, IL 60490
|
- sq. feet
|
- baths - beds |
show details | |

|
#48
Bluebird Dr
Bolingbrook, IL 60440
|
- sq. feet
|
- baths - beds |
show details | |

|
#49
Pinebrook Dr
Bolingbrook, IL 60490
|
- sq. feet
|
- baths - beds |
show details | |

|
Check over 1 million property listings on Foreclosure.com!
|
browse all offers | |||

Latest news about housing in Bolingbrook, IL collected exclusively by city-data.com from local newspapers, TV, and radio stations

 | Large Dog Friendly Apartment/Townhome/House Rentals (1 reply) |
| Chicago Suburbs Real Estate (111 replies) |
| Any cheap studio apartments in this area? (2 replies) |
| Very weak housing market in Highland Park (66 replies) |
| Bolingbrook Home Rental (8 replies) |
| Naperville, Aurora, Bolingbrook SD 204 concerns (2 replies) |

Median year apartment built: 1978
Household type by relationship:
Households: 75,444- Male householders: 13,526 (2,791 living alone), Female householders: 13,059 (2,844 living alone)
14,938 spouses (14,851 opposite-sex spouses), 1,780 unmarried partners, (1,780 opposite-sex unmarried partners), 24,202 children (22,389 natural, 541 adopted, 1,272 stepchildren), 1,357 grandchildren, 1,217 brothers or sisters, 2,488 parents, 0 foster children, 760 other relatives, 1,762 non-relatives
- In group quarters: 355
Size of family households: 6,491 2-persons, 4,174 3-persons, 5,262 4-persons, 2,800 5-persons, 671 6-persons, 247 7-or-more-persons.
Size of nonfamily households: 5,635 1-person, 1,166 2-persons, 122 3-persons, 17 4-persons.
10,767 married couples with children.
3,550 single-parent households (601 men, 2,949 women).
64.7% of residents of Bolingbrook speak English at home.
21.4% of residents speak Spanish at home (62% speak English very well, 22% speak English well, 10% speak English not well, 6% don't speak English at all).
8.1% of residents speak other Indo-European language at home (63% speak English very well, 22% speak English well, 11% speak English not well, 4% don't speak English at all).
5.8% of residents speak Asian or Pacific Island language at home (76% speak English very well, 21% speak English well, 4% speak English not well).
1.2% of residents speak other language at home (88% speak English very well, 11% speak English well, 1% speak English not well).
Foreign born population: 19,291 (25.6%)
(56.2% of them are naturalized citizens)
| Here: | 7.2 |
| State: | 6.4 |
| Here: | 4.6 |
| State: | 4.1 |

- Bedrooms in owner-occupied houses and condos in Bolingbrook, Illinois
- 0no bedroom
- 01 bedroom
- 1,7882 bedrooms
- 8,9043 bedrooms
- 8,9244 bedrooms
- 1,3195+ bedrooms

- Bedrooms in renter-occupied apartments in Bolingbrook, Illinois
- 458no bedroom
- 1,1941 bedroom
- 1,6302 bedrooms
- 1,3203 bedrooms
- 1,0204 bedrooms
- 285+ bedrooms

- Cars and other vehicles available in Bolingbrook in owner-occupied houses/condos
- 262no vehicle
- 4,0521 vehicle
- 10,7452 vehicles
- 4,3843 vehicles
- 1,4064 vehicles
- 865+ vehicles

- Cars and other vehicles available in Bolingbrook in renter-occupied apartments
- 615no vehicle
- 2,6891 vehicle
- 9372 vehicles
- 8843 vehicles
- 5254 vehicles
- 05+ vehicles

- Rooms in owner-occupied houses in Bolingbrook, Illinois
- 01 room
- 02 rooms
- 2133 rooms
- 8714 rooms
- 1,8575 rooms
- 4,3586 rooms
- 4,6837 rooms
- 3,7388 rooms
- 5,2159+ rooms

- Rooms in renter-occupied apartments in Bolingbrook, Illinois
- 4581 room
- 1052 rooms
- 1,1653 rooms
- 1,0364 rooms
- 9555 rooms
- 7566 rooms
- 4367 rooms
- 2148 rooms
- 5259+ rooms


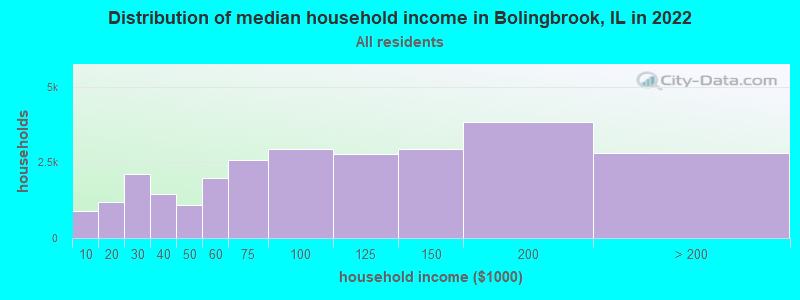
Bolingbrook, IL household income distribution

- 880Less than $10,000
- 1,190$10,000 to $19,999
- 2,099$20,000 to $29,999
- 1,449$30,000 to $39,999
- 1,092$40,000 to $49,999
- 1,996$50,000 to $59,999
- 2,578$60,000 to $74,999
- 2,942$75,000 to $99,999
- 2,778$100,000 to $124,999
- 2,954$125,000 to $149,999
- 3,830$150,000 to $199,999
- 2,797$200,000 or more
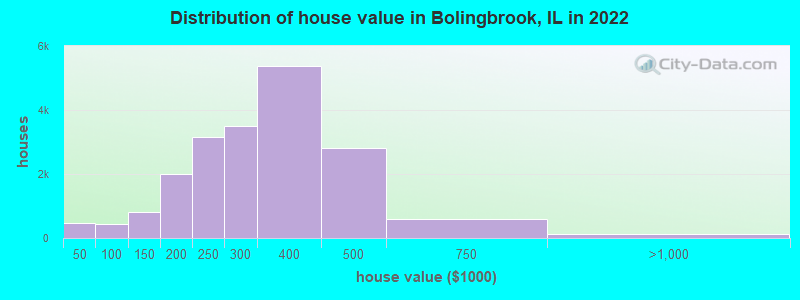
Home value of owner - occupied houses in 2022 in Bolingbrook, IL
-
- 236Less than $10,000
- 19$10,000 to $14,999
- 37$15,000 to $19,999
- 23$20,000 to $24,999
- 35$25,000 to $29,999
- 47$35,000 to $39,999
- 64$40,000 to $49,999
- 144$50,000 to $59,999
- 34$60,000 to $69,999
- 97$70,000 to $79,999
- 27$80,000 to $89,999
- 78$90,000 to $99,999
- 422$100,000 to $124,999
- 400$125,000 to $149,999
- 986$150,000 to $174,999
- 1,004$175,000 to $199,999
- 3,168$200,000 to $249,999
- 3,508$250,000 to $299,999
- 5,374$300,000 to $399,999
- 2,817$400,000 to $499,999
- 600$500,000 to $749,999
- 41$750,000 to $999,999
- 50$1,000,000 to $1,499,999
- 26$2,000,000 or more
Rent paid by renters in 2022 in Bolingbrook, IL
-
- 31$150 to $199
- 5$250 to $299
- 80$300 to $349
- 123$400 to $449
- 22$450 to $499
- 40$500 to $549
- 13$550 to $599
- 16$600 to $649
- 70$650 to $699
- 105$700 to $749
- 6$750 to $799
- 167$800 to $899
- 263$900 to $999
- 1,095$1,000 to $1,249
- 734$1,250 to $1,499
- 1,857$1,500 to $1,999
- 608$2,000 to $2,499
- 125$2,500 to $2,999
- 17$3,000 to $3,499
- 8$3,500 or more
- 88No cash rent


Percentage of workers working in this county: 50.5%
Number of people working at home: 6,625 (17.1% of all workers)
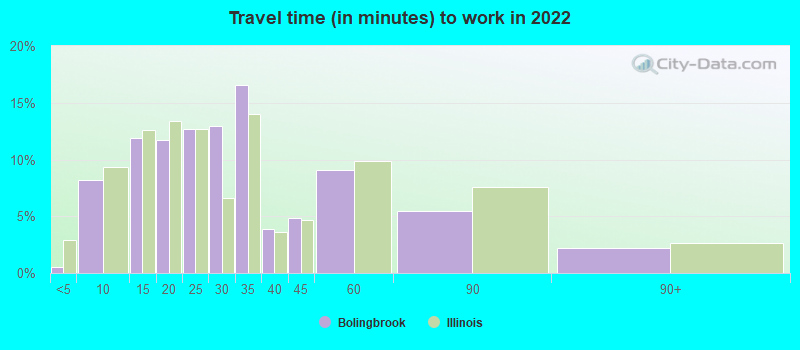
Travel time to work (commute)
- Less than 5 minutes: 216
- 5 to 9 minutes: 1,756
- 10 to 14 minutes: 4,817
- 15 to 19 minutes: 5,346
- 20 to 24 minutes: 2,567
- 25 to 29 minutes: 2,036
- 30 to 34 minutes: 5,360
- 35 to 39 minutes: 1,197
- 40 to 44 minutes: 2,232
- 45 to 59 minutes: 3,578
- 60 to 89 minutes: 2,788
- 90 or more minutes: 1,071
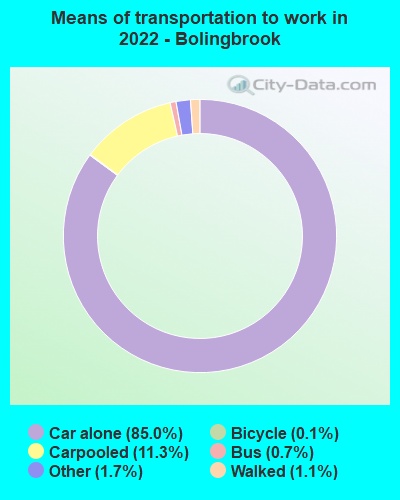
Means of transportation to work:
- Drove a car alone: 30,616 (71.8%)
- Carpooled: 4,100 (9.6%)
- Bus: 186 (0.4%)
- Long-distance train or commuter rail: 16 (0.0%)
- Taxi: 647 (1.5%)
- Bicycle: 47 (0.1%)
- Walked: 309 (0.7%)
- Worked at home: 6,625 (15.5%)

- Unemployment by race in 2022
- Unemployment rate for White non-Hispanic residents
- 2.3%Males
- Unemployment rate for Black residents
- 9.4%Males
- 8.6%Females
- Unemployment rate for Asian residents
- 4.3%Males
- 1.5%Females
- Unemployment rate for other race residents
- 1.7%Males
- 2.4%Females
- Unemployment rate for two or more race residents
- 2.2%Males
- 7.6%Females
- Unemployment rate for Hispanic or Latino residents
- 1.5%Males
- 5.2%Females

- Year of entry for the foreign-born population in Bolingbrook, Illinois
- 3,8832010 or later
- 5,3192000 to 2009
- 4,2941990 to 1999
- 2,0691980 to 1989
- 1,2661970 to 1979
- 924Before 1970

First ancestries reported:
- German: 2,171 (5.3%)
- Polish: 1,899 (4.7%)
- African: 1,317 (3.2%)
- Irish: 1,054 (2.6%)
- Italian: 975 (2.4%)
- American: 860 (2.1%)
- English: 667 (1.6%)
- European: 546 (1.3%)
- Romanian: 519 (1.3%)
- Afghan: 325 (0.8%)
- Lithuanian: 252 (0.6%)
- Nigerian: 230 (0.6%)
- Norwegian: 171 (0.4%)
- Ghanaian: 167 (0.4%)
- Czech: 163 (0.4%)
- Greek: 133 (0.3%)
- Haitian: 132 (0.3%)
- Scandinavian: 124 (0.3%)
- Jamaican: 112 (0.3%)
- Dutch: 94 (0.2%)
- Swedish: 88 (0.2%)
- Yugoslavian: 85 (0.2%)
- Serbian: 77 (0.2%)
- French: 71 (0.2%)
- Arab: 62 (0.2%)
- Belizean: 61 (0.2%)
- Eastern European: 61 (0.2%)
- Ukrainian: 57 (0.1%)
- Lebanese: 53 (0.1%)
- Kenyan: 50 (0.1%)
- Northern European: 48 (0.1%)
- Austrian: 48 (0.1%)
- French Canadian: 46 (0.1%)
- Macedonian: 41 (0.1%)
- Russian: 40 (0.10%)
- Bulgarian: 40 (0.10%)
- Albanian: 39 (0.10%)
- Assyrian: 37 (0.09%)
- Portuguese: 36 (0.09%)
- Scottish: 35 (0.09%)
- Slovak: 34 (0.08%)
- British: 34 (0.08%)
- Czechoslovakian: 23 (0.06%)
- Canadian: 22 (0.05%)
- Croatian: 20 (0.05%)
- Jordanian: 15 (0.04%)
- Slovene: 15 (0.04%)
- West Indian: 14 (0.03%)
- Scotch-Irish: 13 (0.03%)
- British West Indian: 13 (0.03%)
- Pennsylvania German: 11 (0.03%)
- Armenian: 10 (0.02%)
- Egyptian: 8 (0.02%)
- Hungarian: 8 (0.02%)
- Finnish: 7 (0.02%)
- Welsh: 7 (0.02%)
- Ethiopian: 6 (0.01%)
- Israeli: 3 (0.01%)
Most common places of birth for foreign-born residents (%):
| Bolingbrook: | 41.4% (6,543) |
| Illinois: | 34.7% (626,958) |
| Bolingbrook: | 15.4% (2,427) |
| Illinois: | 9.2% (166,409) |
| Bolingbrook: | 9.5% (1,493) |
| Illinois: | 5.2% (93,003) |
| Bolingbrook: | 3.8% (595) |
| Illinois: | 1.6% (29,519) |
| Bolingbrook: | 2.6% (404) |
| Illinois: | 4.1% (74,364) |
| Bolingbrook: | 2.1% (329) |
| Illinois: | 0.3% (4,938) |
| Bolingbrook: | 1.9% (293) |
| Illinois: | 6.9% (124,474) |
| Bolingbrook: | 1.7% (272) |
| Illinois: | 0.1% (1,312) |
Place of birth for U.S.-born residents:
- This state: 45,868
- Other state: 9,716
- Northeast: 1,155
- Midwest: 3,960
- South: 2,148
- West: 2,453
91.8% of Bolingbrook residents lived in the same house 1 years ago.
Out of people who lived in different houses, 29.4% lived in this county.
Out of people who lived in different counties, 87.3% lived in Illinois.
| Bolingbrook: | 91.8% |
| State average: | 88.3% |
Education attainment for males 25 years and older:
- No schooling: 882
- Nursery to 4th grade: 0
- 5th and 6th grade: 555
- 7th and 8th grade: 454
- 9th grade: 595
- 10th grade: 224
- 11th grade: 253
- 12th grade, no diploma: 697
- High school graduate (or equivalency): 5,898
- Less than 1 year of college: 2,641
- Some college more than 1 year, no degree: 2,399
- Associate degree: 2,429
- Bachelor's degree: 7,205
- Master's degree: 1,495
- Professional school degree: 219
- Doctorate degree: 210

Education attainment for females 25 years and older:
- No schooling: 636
- Nursery to 4th grade: 55
- 5th and 6th grade: 613
- 7th and 8th grade: 545
- 9th grade: 166
- 10th grade: 186
- 11th grade: 245
- 12th grade, no diploma: 531
- High school graduate (or equivalency): 5,972
- Less than 1 year of college: 1,541
- Some college more than 1 year, no degree: 2,658
- Associate degree: 2,349
- Bachelor's degree: 7,806
- Master's degree: 2,499
- Professional school degree: 369
- Doctorate degree: 469


Housing units in structures:
- One, detached: 19,930
- One, attached: 3,669
- Two: 67
- 3 or 4: 613
- 5 to 9: 351
- 10 to 19: 329
- 20 to 49: 964
- 50 or more: 1,078
Housing units lacking complete kitchen facilities in 2022: 1.8%
House/condo owner moved in on average 14 years ago
Renter moved in on average 2 years ago

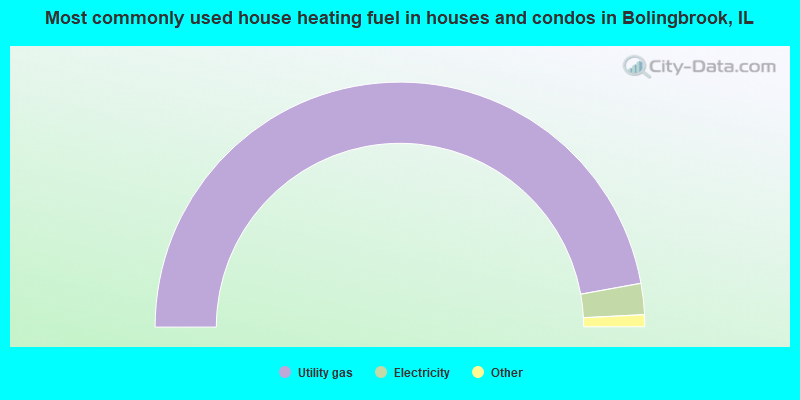
- 94.3%Utility gas
- 4.1%Electricity
- 1.1%Bottled, tank, or LP gas
- 0.3%Other fuel
- 0.1%No fuel used
- 0.1%Solar energy
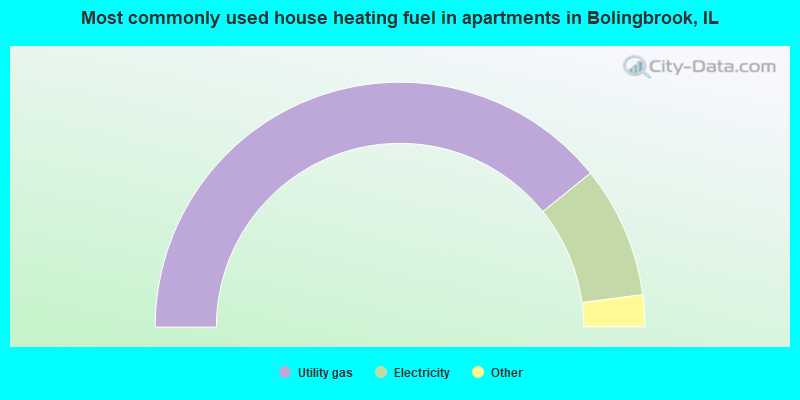
- 78.4%Utility gas
- 17.4%Electricity
- 3.7%Bottled, tank, or LP gas
- 0.4%No fuel used
- 0.2%Other fuel
Private vs. public school enrollment:
| Here: | 3.8% |
| Illinois: | 13.3% |
| Here: | 6.7% |
| Illinois: | 9.9% |
| Here: | 18.4% |
| Illinois: | 27.4% |


