Races in Bolingbrook, Illinois (IL) Detailed Stats
Data:
Races - White alone (%)
Races - White alone (% change since 2000)
Races - Black alone (%)
Races - Black alone (% change since 2000)
Races - American Indian alone (%)
Races - American Indian alone (% change since 2000)
Races - Asian alone (%)
Races - Asian alone (% change since 2000)
Races - Hispanic (%)
Races - Hispanic (% change since 2000)
Races - Native Hawaiian and Other Pacific Islander alone (%)
Races - Native Hawaiian and Other Pacific Islander alone (% change since 2000)
Races - Two or more races(%)
Races - Two or more races(% change since 2000)
Races - Other race alone (%)
Races - Other race alone (% change since 2000)
Racial diversity
Place of birth - Born in state of residence (%)
Place of birth - Born in state of residence (%) - White
Place of birth - Born in state of residence (%) - Black or African American
Place of birth - Born in state of residence (%) - Asian
Place of birth - Born in state of residence (%) - Hispanic or Latino
Place of birth - Born in state of residence (%) - American Indian and Alaska Native
Place of birth - Born in state of residence (%) - Multirace
Place of birth - Born in state of residence (%) - Other Race
Place of birth - Born in other state (%)
Place of birth - Born in other state (%) - White
Place of birth - Born in other state (%) - Black or African American
Place of birth - Born in other state (%) - Asian
Place of birth - Born in other state (%) - Hispanic or Latino
Place of birth - Born in other state (%) - American Indian and Alaska Native
Place of birth - Born in other state (%) - Multirace
Place of birth - Born in other state (%) - Other Race
Place of birth - Native, outside of US (%)
Place of birth - Native, outside of US (%) - White
Place of birth - Native, outside of US (%) - Black or African American
Place of birth - Native, outside of US (%) - Asian
Place of birth - Native, outside of US (%) - Hispanic or Latino
Place of birth - Native, outside of US (%) - American Indian and Alaska Native
Place of birth - Native, outside of US (%) - Multirace
Place of birth - Native, outside of US (%) - Other Race
Place of birth - Foreign born (%)
Place of birth - Foreign born (%) - White
Place of birth - Foreign born (%) - Black or African American
Place of birth - Foreign born (%) - Asian
Place of birth - Foreign born (%) - Hispanic or Latino
Place of birth - Foreign born (%) - American Indian and Alaska Native
Place of birth - Foreign born (%) - Multirace
Place of birth - Foreign born (%) - Other Race
Residents speaking English at home (%)
Residents speaking English at home - Born in the United States (%)
Residents speaking English at home - Native, born elsewhere (%)
Residents speaking English at home - Foreign born (%)
Residents speaking Spanish at home (%)
Residents speaking Spanish at home - Born in the United States (%)
Residents speaking Spanish at home - Native, born elsewhere (%)
Residents speaking Spanish at home - Foreign born (%)
Residents speaking other language at home (%)
Residents speaking other language at home - Born in the United States (%)
Residents speaking other language at home - Native, born elsewhere (%)
Residents speaking other language at home - Foreign born (%)
Marital status - Never married (%)
Marital status - Now married (%)
Marital status - Separated (%)
Marital status - Widowed (%)
Marital status - Divorced (%)
Ancestries Reported - Arab (%)
Ancestries Reported - Czech (%)
Ancestries Reported - Danish (%)
Ancestries Reported - Dutch (%)
Ancestries Reported - English (%)
Ancestries Reported - French (%)
Ancestries Reported - French Canadian (%)
Ancestries Reported - German (%)
Ancestries Reported - Greek (%)
Ancestries Reported - Hungarian (%)
Ancestries Reported - Irish (%)
Ancestries Reported - Italian (%)
Ancestries Reported - Lithuanian (%)
Ancestries Reported - Norwegian (%)
Ancestries Reported - Polish (%)
Ancestries Reported - Portuguese (%)
Ancestries Reported - Russian (%)
Ancestries Reported - Scotch-Irish (%)
Ancestries Reported - Scottish (%)
Ancestries Reported - Slovak (%)
Ancestries Reported - Subsaharan African (%)
Ancestries Reported - Swedish (%)
Ancestries Reported - Swiss (%)
Ancestries Reported - Ukrainian (%)
Ancestries Reported - United States (%)
Ancestries Reported - Welsh (%)
Ancestries Reported - West Indian (%)
Ancestries Reported - Other (%)
Geographical mobility - Same house 1 year ago (%)
Geographical mobility - Same house 1 year ago (%) - White
Geographical mobility - Same house 1 year ago (%) - Black or African American
Geographical mobility - Same house 1 year ago (%) - Asian
Geographical mobility - Same house 1 year ago (%) - Hispanic or Latino
Geographical mobility - Same house 1 year ago (%) - American Indian and Alaska Native
Geographical mobility - Same house 1 year ago (%) - Multirace
Geographical mobility - Same house 1 year ago (%) - Other Race
Geographical mobility - Moved within same county (%)
Geographical mobility - Moved within same county (%) - White
Geographical mobility - Moved within same county (%) - Black or African American
Geographical mobility - Moved within same county (%) - Asian
Geographical mobility - Moved within same county (%) - Hispanic or Latino
Geographical mobility - Moved within same county (%) - American Indian and Alaska Native
Geographical mobility - Moved within same county (%) - Multirace
Geographical mobility - Moved within same county (%) - Other Race
Geographical mobility - Moved from different county within same state (%)
Geographical mobility - Moved from different county within same state (%) - White
Geographical mobility - Moved from different county within same state (%) - Black or African American
Geographical mobility - Moved from different county within same state (%) - Asian
Geographical mobility - Moved from different county within same state (%) - Hispanic or Latino
Geographical mobility - Moved from different county within same state (%) - American Indian and Alaska Native
Geographical mobility - Moved from different county within same state (%) - Multirace
Geographical mobility - Moved from different county within same state (%) - Other Race
Geographical mobility - Moved from different state (%)
Geographical mobility - Moved from different state (%) - White
Geographical mobility - Moved from different state (%) - Black or African American
Geographical mobility - Moved from different state (%) - Asian
Geographical mobility - Moved from different state (%) - Hispanic or Latino
Geographical mobility - Moved from different state (%) - American Indian and Alaska Native
Geographical mobility - Moved from different state (%) - Multirace
Geographical mobility - Moved from different state (%) - Other Race
Geographical mobility - Moved from abroad (%)
Geographical mobility - Moved from abroad (%) - White
Geographical mobility - Moved from abroad (%) - Black or African American
Geographical mobility - Moved from abroad (%) - Asian
Geographical mobility - Moved from abroad (%) - Hispanic or Latino
Geographical mobility - Moved from abroad (%) - American Indian and Alaska Native
Geographical mobility - Moved from abroad (%) - Multirace
Geographical mobility - Moved from abroad (%) - Other Race
Place of birth for the foreign-born population - Ireland (%)
Place of birth for the foreign-born population - Denmark (%)
Place of birth for the foreign-born population - Norway (%)
Place of birth for the foreign-born population - Sweden (%)
Place of birth for the foreign-born population - United Kingdom (%)
Place of birth for the foreign-born population - England (%)
Place of birth for the foreign-born population - Scotland (%)
Place of birth for the foreign-born population - Other Northern Europe (%)
Place of birth for the foreign-born population - Austria (%)
Place of birth for the foreign-born population - Belgium (%)
Place of birth for the foreign-born population - France (%)
Place of birth for the foreign-born population - Germany (%)
Place of birth for the foreign-born population - Netherlands (%)
Place of birth for the foreign-born population - Switzerland (%)
Place of birth for the foreign-born population - Other Western Europe (%)
Place of birth for the foreign-born population - Greece (%)
Place of birth for the foreign-born population - Italy (%)
Place of birth for the foreign-born population - Portugal (%)
Place of birth for the foreign-born population - Spain (%)
Place of birth for the foreign-born population - Other Southern Europe (%)
Place of birth for the foreign-born population - Albania (%)
Place of birth for the foreign-born population - Belarus (%)
Place of birth for the foreign-born population - Bosnia and Herzegovina (%)
Place of birth for the foreign-born population - Bulgaria (%)
Place of birth for the foreign-born population - Croatia (%)
Place of birth for the foreign-born population - Czechoslovakia (%)
Place of birth for the foreign-born population - Hungary (%)
Place of birth for the foreign-born population - Latvia (%)
Place of birth for the foreign-born population - Lithuania (%)
Place of birth for the foreign-born population - North Macedonia (Macedonia) (%)
Place of birth for the foreign-born population - Moldova (%)
Place of birth for the foreign-born population - Poland (%)
Place of birth for the foreign-born population - Romania (%)
Place of birth for the foreign-born population - Russia (%)
Place of birth for the foreign-born population - Serbia (%)
Place of birth for the foreign-born population - Ukraine (%)
Place of birth for the foreign-born population - Other Eastern Europe (%)
Place of birth for the foreign-born population - China (%)
Place of birth for the foreign-born population - Hong Kong (%)
Place of birth for the foreign-born population - Taiwan (%)
Place of birth for the foreign-born population - Japan (%)
Place of birth for the foreign-born population - Korea (%)
Place of birth for the foreign-born population - Other Eastern Asia (%)
Place of birth for the foreign-born population - Afghanistan (%)
Place of birth for the foreign-born population - Bangladesh (%)
Place of birth for the foreign-born population - India (%)
Place of birth for the foreign-born population - Iran (%)
Place of birth for the foreign-born population - Kazakhstan (%)
Place of birth for the foreign-born population - Nepal (%)
Place of birth for the foreign-born population - Pakistan (%)
Place of birth for the foreign-born population - Sri Lanka (%)
Place of birth for the foreign-born population - Uzbekistan (%)
Place of birth for the foreign-born population - Other South Central Asia (%)
Place of birth for the foreign-born population - Burma (%)
Place of birth for the foreign-born population - Cambodia (%)
Place of birth for the foreign-born population - Indonesia (%)
Place of birth for the foreign-born population - Laos (%)
Place of birth for the foreign-born population - Malaysia (%)
Place of birth for the foreign-born population - Philippines (%)
Place of birth for the foreign-born population - Singapore (%)
Place of birth for the foreign-born population - Thailand (%)
Place of birth for the foreign-born population - Vietnam (%)
Place of birth for the foreign-born population - Other South Eastern Asia (%)
Place of birth for the foreign-born population - Armenia (%)
Place of birth for the foreign-born population - Iraq (%)
Place of birth for the foreign-born population - Israel (%)
Place of birth for the foreign-born population - Jordan (%)
Place of birth for the foreign-born population - Kuwait (%)
Place of birth for the foreign-born population - Lebanon (%)
Place of birth for the foreign-born population - Saudi Arabia (%)
Place of birth for the foreign-born population - Syria (%)
Place of birth for the foreign-born population - Turkey (%)
Place of birth for the foreign-born population - Yemen (%)
Place of birth for the foreign-born population - Other Western Asia (%)
Place of birth for the foreign-born population - Eritrea (%)
Place of birth for the foreign-born population - Ethiopia (%)
Place of birth for the foreign-born population - Kenya (%)
Place of birth for the foreign-born population - Somalia (%)
Place of birth for the foreign-born population - Uganda (%)
Place of birth for the foreign-born population - Zimbabwe (%)
Place of birth for the foreign-born population - Other Eastern Africa (%)
Place of birth for the foreign-born population - Cameroon (%)
Place of birth for the foreign-born population - Congo (%)
Place of birth for the foreign-born population - Democratic Republic of Congo (Zaire) (%)
Place of birth for the foreign-born population - Other Middle Africa (%)
Place of birth for the foreign-born population - Egypt (%)
Place of birth for the foreign-born population - Morocco (%)
Place of birth for the foreign-born population - Sudan (%)
Place of birth for the foreign-born population - Other Northern Africa (%)
Place of birth for the foreign-born population - South Africa (%)
Place of birth for the foreign-born population - Other Southern Africa (%)
Place of birth for the foreign-born population - Cabo Verde (%)
Place of birth for the foreign-born population - Ghana (%)
Place of birth for the foreign-born population - Liberia (%)
Place of birth for the foreign-born population - Nigeria (%)
Place of birth for the foreign-born population - Senegal (%)
Place of birth for the foreign-born population - Sierra Leone (%)
Place of birth for the foreign-born population - Other Western Africa (%)
Place of birth for the foreign-born population - Australia (%)
Place of birth for the foreign-born population - New Zealand (%)
Place of birth for the foreign-born population - Fiji (%)
Place of birth for the foreign-born population - Micronesia (%)
Place of birth for the foreign-born population - Bahamas (%)
Place of birth for the foreign-born population - Barbados (%)
Place of birth for the foreign-born population - Cuba (%)
Place of birth for the foreign-born population - Dominica (%)
Place of birth for the foreign-born population - Dominican Republic (%)
Place of birth for the foreign-born population - Grenada (%)
Place of birth for the foreign-born population - Haiti (%)
Place of birth for the foreign-born population - Jamaica (%)
Place of birth for the foreign-born population - St. Vincent and the Grenadines (%)
Place of birth for the foreign-born population - Trinidad and Tobago (%)
Place of birth for the foreign-born population - West Indies (%)
Place of birth for the foreign-born population - Other Caribbean (%)
Place of birth for the foreign-born population - Belize (%)
Place of birth for the foreign-born population - Costa Rica (%)
Place of birth for the foreign-born population - El Salvador (%)
Place of birth for the foreign-born population - Guatemala (%)
Place of birth for the foreign-born population - Honduras (%)
Place of birth for the foreign-born population - Mexico (%)
Place of birth for the foreign-born population - Nicaragua (%)
Place of birth for the foreign-born population - Panama (%)
Place of birth for the foreign-born population - Other Central America (%)
Place of birth for the foreign-born population - Argentina (%)
Place of birth for the foreign-born population - Bolivia (%)
Place of birth for the foreign-born population - Brazil (%)
Place of birth for the foreign-born population - Chile (%)
Place of birth for the foreign-born population - Colombia (%)
Place of birth for the foreign-born population - Ecuador (%)
Place of birth for the foreign-born population - Guyana (%)
Place of birth for the foreign-born population - Peru (%)
Place of birth for the foreign-born population - Uruguay (%)
Place of birth for the foreign-born population - Venezuela (%)
Place of birth for the foreign-born population - Other South America (%)
Place of birth for the foreign-born population - Canada (%)
Place of birth for the foreign-born population - Other Northern America (%)
Place of birth for the foreign-born population - Other (%)
Latest news about races in Bolingbrook, IL collected exclusively by city-data.com from local newspapers, TV, and radio stations
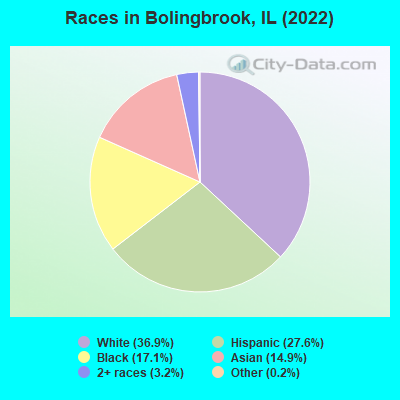
According to 2022 data, the most numerous races in Bolingbrook, IL are White alone (27,843 residents), Hispanic (20,858 residents), and Black alone (12,883 residents). 63.0% of Bolingbrook residents speak English at home. 21.4% of Bolingbrook, IL residents are foreign-born (10.1% born in Latin America, 8.1% born in Asia), which is 34.6% greater than the foreign-born rate of 14.0% across the entire state of Illinois.
Race distribution in Bolingbrook
2000 2022
32,618 57.9% White alone 11,324 20.1% Black alone 7,371 13.1% Hispanic 3,570 6.3% Asian alone 1,159 2.1% Two or more races 170 0.3% Other race alone 83 0.1% American Indian alone 26 0.05% Native Hawaiian and Other
27,843 36.9% White alone 20,858 27.6% Hispanic 12,883 17.1% Black alone 11,258 14.9% Asian alone 2,434 3.2% Two or more races 128 0.2% Other race alone 40 0.05% American Indian alone
2000 2022
8,424,140 67.8% White alone 1,856,152 14.9% Black alone 1,530,262 12.3% Hispanic 419,916 3.4% Asian alone 153,996 1.2% Two or more races 13,479 0.1% Other race alone 18,232 0.1% American Indian alone 3,116 0.03% Native Hawaiian and Other
7,356,301 58.5% White alone 2,299,726 18.3% Hispanic 1,660,423 13.2% Black alone 747,296 5.9% Asian alone 458,599 3.6% Two or more races 45,386 0.4% Other race alone 10,405 0.08% American Indian alone 3,896 0.03% Native Hawaiian and Other
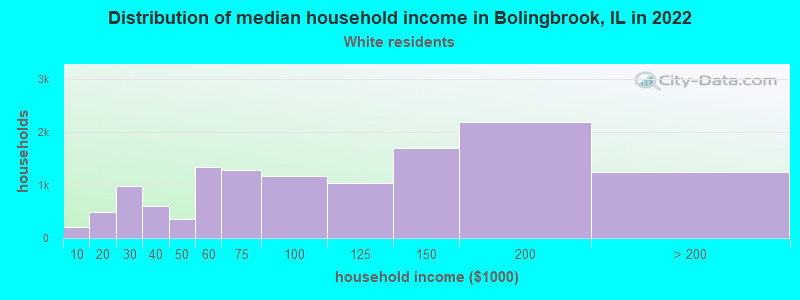
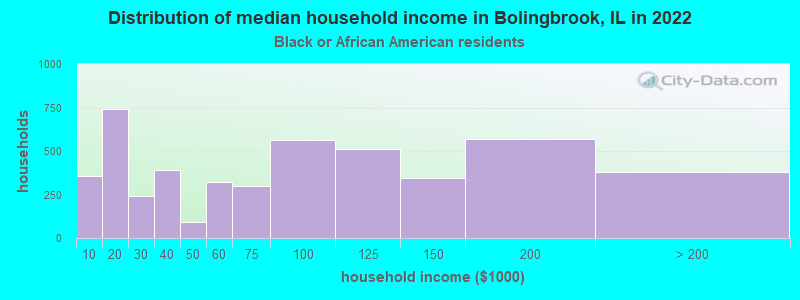
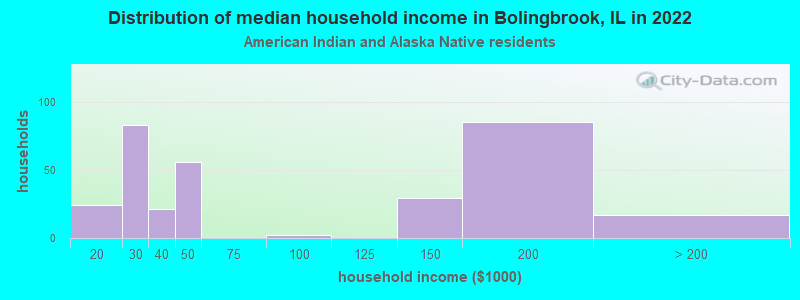
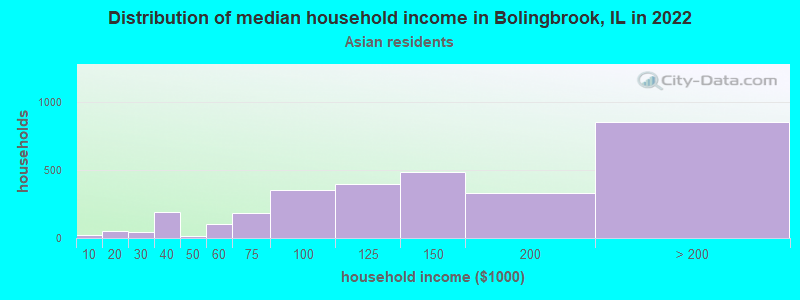
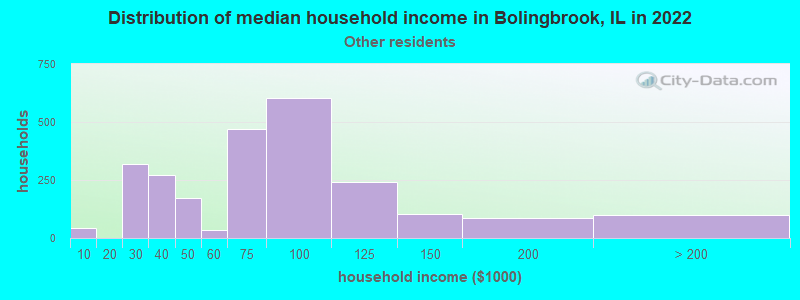
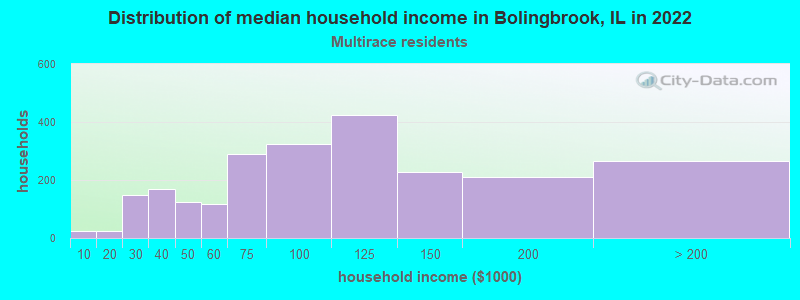
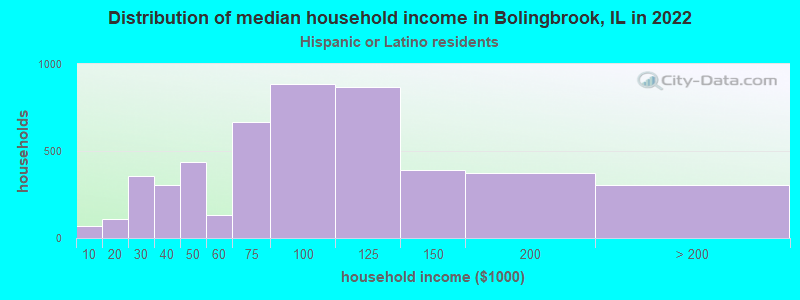
Income and house value in Bolingbrook Median household income in 2022 $97,716 White non-Hispanic householders$86,726 Black householders$133,725 Asian householders$67,483 Some other race householders$90,762 Two or more races householders$83,915 Hispanic or Latino race householdersMedian 2022 house value $294,444 White Non-Hispanic householders$295,480 Black or African American householders$196,365 American Indian or Alaska Native householders $347,734 Asian householders$267,280 Some other race householders$261,267 Two or more races householders$273,708 Hispanic or Latino householders
Median age by race in Bolingbrook
47.5 Median age for White residents44.4 50.2 41.3 Median age for Black or African American residents37.7 41.6 38.2 Median age for American Indian / Alaska Native residents37.0 38.2 39.9 Median age for Asian residents38.2 40.8 -666,666,666.0 Median age for Native Hawaiian / Pacific Islander residents-666,666,666.0 -666,666,666.0 41.4 Median age for Other race residents41.9 41.1 26.1 Median age for Two or more races residents27.7 22.5 50.2 Median age for White alone residents47.3 52.0 33.4 Median age for Hispanic or Latino residents35.2 31.1
Owner/renter occupied households by race in Bolingbrook
House owners and renters - White residents 10,385 82.2% Owner occupied2,254 17.8% Renter occupiedHouse owners and renters - Black or African American residents 3,866 80.8% Owner occupied919 19.2% Renter occupiedHouse owners and renters - American Indian / Alaska Native residents 199 90.6% Owner occupied21 9.4% Renter occupiedHouse owners and renters - Asian residents 3,343 90.6% Owner occupied346 9.4% Renter occupiedHouse owners and renters - Native Hawaiian / Pacific Islander residents 4 100.0% Renter occupiedHouse owners and renters - Other race residents 1,241 49.8% Owner occupied1,249 50.2% Renter occupiedHouse owners and renters - Two or more races residents 1,990 72.5% Owner occupied754 27.5% Renter occupiedHouse owners and renters - White alone residents 9,637 82.0% Owner occupied2,121 18.0% Renter occupiedHouse owners and renters - Hispanic or Latino residents 3,626 65.8% Owner occupied1,885 34.2% Renter occupied
Language usage in Bolingbrook
English speakers - Total 63.0% of residents of Bolingbrook speak English at home.
21.8% of residents speak Spanish at home 8,996 57.7% Speak English very well6,596 42.3% Speak English less than very well15.3% of residents speak other language at home 7,381 67.4% Speak English very well3,567 32.6% Speak English less than very well
English speakers - Born in the United States 80.4% of residents of Bolingbrook speak English at home.
18.1% of residents speak Spanish at home 1,518 86.3% Speak English very well240 13.7% Speak English less than very well1.5% of residents speak other language at home 102 71.3% Speak English very well41 28.7% Speak English less than very well
English speakers - Native, born elsewhere 65.7% of residents of Bolingbrook speak English at home.
20.0% of residents speak Spanish at home 56 49.1% Speak English very well58 50.9% Speak English less than very well14.2% of residents speak other language at home 81 100.0% Speak English very well
English speakers - Foreign-born 14.9% of residents of Bolingbrook speak English at home.
39.7% of residents speak Spanish at home 2,349 30.7% Speak English very well5,312 69.3% Speak English less than very well45.4% of residents speak other language at home 5,378 61.4% Speak English very well3,384 38.6% Speak English less than very well
White (Caucasian) - Speak only English Native:
90.9% (24,641)Foreign-born:
19.5% (529)
White (Caucasian) - Speak another language Native:
9.1% (2,470)Foreign-born:
80.5% (2,188)
Black or African American - Speak only English Native:
98.8% (11,117)Foreign-born:
55.4% (779)
Black or African American - Speak another language Native:
1.2% (136)Foreign-born:
44.6% (627)
American Indian / Alaska Native - Speak another language Native:
83.4% (219)Foreign-born:
100.0% (256)
Asian - Speak only English Native:
58.2% (1,976)Foreign-born:
9.7% (751)
Asian - Speak another language Native:
41.8% (1,418)Foreign-born:
90.3% (6,973)
Other race - Speak only English Native:
26.8% (1,244)Foreign-born:
16.8% (617)
Other race - Speak another language Native:
73.2% (3,406)Foreign-born:
83.2% (3,056)
Two or more races - Speak only English Native:
56.9% (3,186)Foreign-born:
6.1% (192)
Two or more races - Speak another language Native:
43.1% (2,416)Foreign-born:
93.9% (2,953)
White alone - Speak only English Native:
95.6% (23,769)Foreign-born:
27.8% (529)
White alone - Speak another language Native:
4.4% (1,085)Foreign-born:
72.2% (1,376)
Hispanic or Latino - Speak only English Native:
34.8% (3,955)Foreign-born:
8.4% (681)
Hispanic or Latino - Speak another language Native:
65.2% (7,415)Foreign-born:
91.6% (7,447)
Foreign-born residents in Bolingbrook 15,796 residents are foreign born (10.1% Latin America , 8.1% Asia ).
This city:
21.4%Illinois:
14.1%
Marital status for residents in Bolingbrook Marital status - White (Caucasian) population 15 years and over
Males 36.4% Never married48.8% Now married0.0% Separated4.1% Widowed10.8% DivorcedFemales 25.4% Never married58.0% Now married0.6% Separated8.6% Widowed7.5% DivorcedWomen who gave birth in the past 12 months Now married:
79.5% (236)Unmarried:
20.5% (61)
Women who did not give birth in the past 12 months Now married:
52.5% (2,998)Unmarried:
47.5% (2,712)
Marital status - Black or African American population 15 years and over
Males 27.7% Never married50.8% Now married8.2% Separated4.2% Widowed9.1% DivorcedFemales 36.8% Never married35.9% Now married5.9% Separated7.6% Widowed13.9% DivorcedWomen who gave birth in the past 12 months Now married:
73.6% (54)Unmarried:
26.4% (19)
Women who did not give birth in the past 12 months Now married:
27.3% (915)Unmarried:
72.7% (2,437)
Marital status - American Indian / Alaska Native population 15 years and over
Males 28.4% Never married53.3% Now married0.0% Separated0.0% Widowed18.3% DivorcedFemales 17.2% Never married68.9% Now married0.0% Separated13.9% Widowed0.0% DivorcedWomen who did not give birth in the past 12 months Now married:
78.5% (188)Unmarried:
21.5% (52)
Marital status - Asian population 15 years and over
Males 27.4% Never married68.3% Now married2.2% Separated0.7% Widowed1.4% DivorcedFemales 17.5% Never married72.0% Now married0.8% Separated4.4% Widowed5.2% DivorcedWomen who gave birth in the past 12 months Now married:
100.0% (160)Unmarried:
0.0% (0)
Women who did not give birth in the past 12 months Now married:
66.8% (1,596)Unmarried:
33.2% (794)
Marital status - Native Hawaiian / Pacific Islander population 15 years and over
Males 0.0% Never married100.0% Now married0.0% Separated0.0% Widowed0.0% DivorcedFemales 100.0% Never married0.0% Now married0.0% Separated0.0% Widowed0.0% DivorcedWomen who did not give birth in the past 12 months Now married:
0.0% (0)Unmarried:
100.0% (9)
Marital status - Other race population 15 years and over
Males 48.8% Never married48.1% Now married0.0% Separated0.0% Widowed3.1% DivorcedFemales 43.3% Never married43.4% Now married8.6% Separated0.0% Widowed4.7% DivorcedWomen who gave birth in the past 12 months Now married:
95.1% (172)Unmarried:
4.9% (9)
Women who did not give birth in the past 12 months Now married:
34.7% (889)Unmarried:
65.3% (1,675)
Marital status - Two or more races population 15 years and over
Males 49.0% Never married44.9% Now married1.2% Separated1.2% Widowed3.7% DivorcedFemales 46.7% Never married46.4% Now married0.7% Separated2.2% Widowed4.0% DivorcedWomen who gave birth in the past 12 months Now married:
85.8% (169)Unmarried:
14.2% (28)
Women who did not give birth in the past 12 months Now married:
44.2% (979)Unmarried:
55.8% (1,238)
Marital status - White alone, not Hispanic / Latino population 15 years and over
Males 35.0% Never married49.0% Now married0.0% Separated4.4% Widowed11.6% DivorcedFemales 21.5% Never married60.6% Now married0.6% Separated9.7% Widowed7.6% DivorcedWomen who gave birth in the past 12 months Now married:
100.0% (236)Unmarried:
0.0% (0)
Women who did not give birth in the past 12 months Now married:
58.1% (2,794)Unmarried:
41.9% (2,014)
Marital status - Hispanic or Latino population 15 years and over
Males 44.0% Never married53.0% Now married0.0% Separated0.0% Widowed3.0% DivorcedFemales 42.3% Never married47.2% Now married3.8% Separated1.5% Widowed5.2% DivorcedWomen who gave birth in the past 12 months Now married:
85.0% (347)Unmarried:
15.0% (61)
Women who did not give birth in the past 12 months Now married:
42.3% (2,004)Unmarried:
57.7% (2,738)
Ancestries in Bolingbrook
2,171 5.3% German1,899 4.7% Polish1,317 3.2% African1,054 2.6% Irish975 2.4% Italian860 2.1% American667 1.6% English546 1.3% European519 1.3% Romanian325 0.8% Afghan252 0.6% Lithuanian230 0.6% Nigerian171 0.4% Norwegian167 0.4% Ghanaian163 0.4% Czech133 0.3% Greek132 0.3% Haitian124 0.3% Scandinavian112 0.3% Jamaican94 0.2% Dutch88 0.2% Swedish85 0.2% Yugoslavian77 0.2% Serbian71 0.2% French62 0.2% Arab61 0.2% Belizean61 0.2% Eastern European57 0.1% Ukrainian53 0.1% Lebanese50 0.1% Kenyan48 0.1% Northern European48 0.1% Austrian46 0.1% French Canadian41 0.1% Macedonian40 0.10% Russian40 0.10% Bulgarian39 0.10% Albanian37 0.09% Assyrian36 0.09% Portuguese35 0.09% Scottish34 0.08% Slovak34 0.08% British23 0.06% Czechoslovakian22 0.05% Canadian20 0.05% Croatian15 0.04% Jordanian15 0.04% Slovene14 0.03% West Indian13 0.03% Scotch-Irish13 0.03% British West Indian11 0.03% Pennsylvania German10 0.02% Armenian8 0.02% Egyptian8 0.02% Hungarian7 0.02% Finnish7 0.02% Welsh6 0.01% Ethiopian3 0.01% Israeli
Geographical mobility in Bolingbrook Same house 1 year ago 28,038 90.8% White (Caucasian)11,928 88.6% Black or African American648 85.6% American Indian / Alaska Native10,612 99.3% Asian10 100.0% Native Hawaiian / Pacific Islander8,772 92.5% Other race9,786 90.5% Two or more races25,549 92.5% White alone, not Hispanic / Latino17,896 88.4% Hispanic or LatinoMoved within same county 1,606 5.2% White / Caucasian742 5.5% Black or African American133 1.2% Asian297 3.1% Other race410 3.8% Two or more races896 3.2% White alone, not Hispanic / Latino1,281 6.3% Hispanic or LatinoMoved within same state 829 2.7% White / Caucasian629 4.7% Black or African American113 14.9% American Indian / Alaska Native129 1.2% Asian342 3.6% Other race508 4.7% Two or more races781 2.8% White alone, not Hispanic / Latino1,001 4.9% Hispanic or LatinoMoved from different state 345 1.1% White / Caucasian103 0.8% Black or African American5 0.6% American Indian / Alaska Native7 0.1% Other race37 0.3% Two or more races345 1.2% White alone, not Hispanic / Latino58 0.3% Hispanic or LatinoMoved from abroad 56 0.2% White46 0.4% Asian16 0.2% Other race56 0.2% White alone, not Hispanic / Latino
Children Nativity (place of birth) in Bolingbrook
Children under 6 years - Living with two parents Both parents native 1,110 100.0% NativeBoth parents foreign-born 1,100 100.0% NativeOne native, one foreign-born parent 955 100.0% NativeChildren under 6 years - Living with one parent Native parent 712 100.0% NativeForeign-born parent 282 100.0% NativeChildren 6 to 17 years - Living with two parents Both parents native 3,288 100.0% NativeBoth parents foreign-born 4,024 85.2% Native697 14.8% Foreign-bornOne native, one foreign-born parent 1,392 100.0% NativeChildren 6 to 17 years - Living with one parent Native parent 1,281 100.0% NativeForeign-born parent 1,198 51.2% Native1,140 48.8% Foreign-born
Place of birth for residents in Bolingbrook 7,582 Americas7,505 Latin America6,810 Central America6,018 Asia3,316 South Central Asia1,638 South Eastern Asia1,555 Europe1,173 Eastern Europe922 Eastern Asia639 Africa552 China410 Caribbean364 Western Africa284 South America189 Eastern Africa139 Western Asia100 Western Europe98 Northern Europe77 Northern America32 Southern Europe29 Middle Africa10 Northern Africa6,620 Mexico2,333 India1,504 Philippines590 Pakistan414 China303 Poland213 Romania211 Moldova174 Korea172 Dominican Republic167 Nigeria157 Japan147 Afghanistan138 Taiwan132 Kazakhstan132 Ghana128 Jamaica115 Guatemala114 Bosnia and Herzegovina101 Kenya90 Uzbekistan87 Tanzania77 Canada76 Bolivia71 Haiti71 Lithuania68 Colombia64 Senegal62 Russia58 Ukraine58 Vietnam56 England55 France50 Laos49 Venezuela49 Ecuador46 Jordan45 Germany45 Serbia34 Saudi Arabia33 Honduras30 Lebanon29 Democratic Republic of Congo (Zaire)28 Scotland28 Peru23 Trinidad and Tobago22 Sri Lanka21 Panama19 Greece18 Turkey15 Bulgaria15 St. Lucia15 Cambodia14 Argentina13 Italy13 Belarus11 Czechoslovakia11 Thailand10 Egypt10 Belize8 North Macedonia (Macedonia)8 United Kingdom7 Israel7 Nicaragua6 Ireland4 Yemen3 El Salvador1 Ethiopia
Grandparents responsible for own grandchildren in Bolingbrook
Grandparents (30 to 59 years) White / Caucasian 254 71.1% Responsible for grandchildren103 28.9% Not responsible for grandchildrenBlack or African American 121 72.6% Responsible for grandchildren46 27.4% Not responsible for grandchildrenAmerican Indian / Alaska Native 11 100.0% Not responsible for grandchildrenAsian 74 100.0% Not responsible for grandchildrenOther race 18 9.8% Responsible for grandchildren168 90.2% Not responsible for grandchildrenTwo or more races 69 100.0% Not responsible for grandchildrenWhite alone, not Hispanic / Latino 40 40.8% Responsible for grandchildren58 59.2% Not responsible for grandchildrenHispanic or Latino 92 29.9% Responsible for grandchildren215 70.1% Not responsible for grandchildrenGrandparents (60 years and over) White / Caucasian 104 18.9% Responsible for grandchildren445 81.1% Not responsible for grandchildrenBlack or African American 100 61.9% Responsible for grandchildren61 38.1% Not responsible for grandchildrenAmerican Indian / Alaska Native 25 100.0% Not responsible for grandchildrenAsian 44 6.8% Responsible for grandchildren596 93.2% Not responsible for grandchildrenOther race 94 100.0% Not responsible for grandchildrenTwo or more races 5 6.4% Responsible for grandchildren72 93.6% Not responsible for grandchildrenWhite alone, not Hispanic / Latino 93 20.2% Responsible for grandchildren366 79.8% Not responsible for grandchildrenHispanic or Latino 24 9.9% Responsible for grandchildren223 90.1% Not responsible for grandchildren