Bethesda, MD (Maryland) Houses and Residents
| Bethesda: | $1,102,100 |
| Maryland: | $398,100 |
Total population: 60,858 (Urban population: 55,300, Rural population: 0)
Houses: 30,969 (28,526 occupied: 17,759 owner occupied, 10,767 renter occupied)
| % of renters here: | 38% |
| State: | 32% |
Housing density: 2,356 houses/condos per square mile
Median price asked for vacant for-sale houses and condos in 2022: $1,571,593.
Median contract rent in 2022: over $2,000 (lower quartile is $1,651, upper quartile is over $2,000)
Median rent asked for vacant for-rent units in 2022: $4,714
Median gross rent in Bethesda, MD in 2022: over $2,000
Housing units in Bethesda with a mortgage: 11,263 (1,184 second mortgage, 0 home equity loan, 990 both second mortgage and home equity loan)
Houses without a mortgage: 454
Median household income for houses/condos with a mortgage: $241,163
Median household income for apartments without a mortgage: $206,773
Median monthly housing costs: $2,453
Compare current foreclosures near Bethesda, MD:
| Photo | Address | Area | Beds / Baths | Price | Details |
|---|---|---|---|---|---|

|
#1
Pooks Hill Rd Apt 1612s
Bethesda, MD 20814
|
1,250 sq. feet
|
1 baths 2 beds |
$289,000
|
show details |

|
#2
Contention Ct
Bethesda, MD 20817
|
2,321 sq. feet
|
2 baths - beds |
show details | |

|
#3
Honeybee Ln
Bethesda, MD 20817
|
3,382 sq. feet
|
4 baths - beds |
show details | |

|
#4
Loch Lomond Dr
Bethesda, MD 20817
|
3,517 sq. feet
|
3 baths - beds |
show details | |

|
#5
Seven Locks Ct
Bethesda, MD 20817
|
3,330 sq. feet
|
3 baths - beds |
show details | |

|
#6
Bradley Blvd
Bethesda, MD 20814
|
5,082 sq. feet
|
4 baths - beds |
show details | |

|
#7
Folkstone Rd
Bethesda, MD 20817
|
1,884 sq. feet
|
2 baths - beds |
show details | |

|
#8
Saint Albans Dr
Bethesda, MD 20814
|
1,860 sq. feet
|
2 baths - beds |
show details | |

|
#9
Battery Ln Apt 217
Bethesda, MD 20814
|
- sq. feet
|
- baths - beds |
show details | |

|
#10
Overlea Rd
Bethesda, MD 20816
|
- sq. feet
|
- baths - beds |
show details |
| Photo | Address | Area | Beds / Baths | Price | Details |
|---|---|---|---|---|---|

|
#11
Montgomery Ln # 314
Bethesda, MD 20814
|
- sq. feet
|
- baths - beds |
show details | |

|
#12
Weymouth St Apt 203
Bethesda, MD 20814
|
- sq. feet
|
- baths - beds |
show details | |

|
#13
Lone Oak Dr
Bethesda, MD 20817
|
- sq. feet
|
- baths - beds |
show details | |

|
#14
Lone Oak Dr
Bethesda, MD 20817
|
- sq. feet
|
- baths - beds |
show details | |

|
#15
Old Georgetown Rd
Bethesda, MD 20814
|
- sq. feet
|
- baths - beds |
show details | |

|
#16
Bristol Square Ln Apt 301
Bethesda, MD 20814
|
- sq. feet
|
- baths - beds |
show details | |

|
#17
Cordell Ave Apt 415
Bethesda, MD 20814
|
- sq. feet
|
- baths - beds |
show details | |

|
#18
Battery Ln Apt 904
Bethesda, MD 20814
|
- sq. feet
|
- baths - beds |
show details | |

|
#19
Arlington Rd # 304
Bethesda, MD 20814
|
- sq. feet
|
- baths - beds |
show details | |

|
#20
Arizona Cir # 64
Bethesda, MD 20817
|
700 sq. feet
|
- baths - beds |
show details |
| Photo | Address | Area | Beds / Baths | Price | Details |
|---|---|---|---|---|---|

|
#21
Westlake Ter
Bethesda, MD 20817
|
- sq. feet
|
- baths - beds |
show details | |

|
#22
Westbard Ave Apt 505
Bethesda, MD 20816
|
- sq. feet
|
- baths - beds |
show details | |

|
#23
Rock Spring Dr Ste 110
Bethesda, MD 20817
|
- sq. feet
|
- baths - beds |
show details | |

|
#24
Edgemoor Ln # 310
Bethesda, MD 20814
|
- sq. feet
|
- baths - beds |
show details | |

|
#25
Wisconsin Ave Ste 1800
Bethesda, MD 20814
|
- sq. feet
|
- baths - beds |
show details | |

|
#26
Auburn Ave Apt 708
Bethesda, MD 20814
|
- sq. feet
|
- baths - beds |
show details | |

|
#27
Applegarth Pl
Capitol Heights, MD 20743
|
1,200 sq. feet
|
1 baths 3 beds |
$314,900
|
show details |

|
#28
Henson Ln
Temple Hills, MD 20748
|
1,566 sq. feet
|
2 baths 3 beds |
$300,000
|
show details |

|
#29
Cathedral Ave NW Apt 108
Washington, DC 20016
|
765 sq. feet
|
1 baths 1 beds |
$269,900
|
show details |

|
#30
Mandan Rd Apt 103 Unit 621
Greenbelt, MD 20770
|
1,420 sq. feet
|
2 baths 3 beds |
$179,900
|
show details |
| Photo | Address | Area | Beds / Baths | Price | Details |
|---|---|---|---|---|---|

|
#31
Hammersmith Cir
Silver Spring, MD 20906
|
1,152 sq. feet
|
1 baths 3 beds |
$353,600
|
show details |

|
#32
Interlachen Dr Apt 111
Silver Spring, MD 20906
|
965 sq. feet
|
1 baths 2 beds |
$148,000
|
show details |

|
#33
9th St NW
Washington, DC 20011
|
1,604 sq. feet
|
2 baths 3 beds |
$598,000
|
show details |

|
#34
Wilson Ln Apt 204
Mc Lean, VA 22102
|
925 sq. feet
|
1 baths 2 beds |
$359,900
|
show details |

|
#35
Pickett Dr
Suitland, MD 20746
|
1,296 sq. feet
|
1 baths 2 beds |
$335,000
|
show details |

|
#36
Brooke Knolls Rd
Gaithersburg, MD 20882
|
1,704 sq. feet
|
3 baths 4 beds |
$681,500
|
show details |

|
#37
Monroe St NW
Washington, DC 20010
|
- sq. feet
|
2 baths 2 beds |
$665,000
|
show details |

|
#38
Addison Rd
Capitol Heights, MD 20743
|
1,400 sq. feet
|
1 baths 3 beds |
$260,000
|
show details |

|
#39
Eastern Ave NE
Washington, DC 20011
|
1,024 sq. feet
|
1 baths 3 beds |
$395,000
|
show details |

|
#40
17th St NW Apt 504
Washington, DC 20009
|
800 sq. feet
|
1 baths 1 beds |
$405,000
|
show details |
| Photo | Address | Area | Beds / Baths | Price | Details |
|---|---|---|---|---|---|

|
#41
Fitzgibbon Ct
Bowie, MD 20721
|
1,300 sq. feet
|
2 baths 3 beds |
$369,200
|
show details |

|
#42
19th St NW
Washington, DC 20036
|
2,515 sq. feet
|
6 baths 8 beds |
$1,684,800
|
show details |

|
#43
Jarvis Ln
Bethesda, MD 20814
|
- sq. feet
|
- baths - beds |
show details | |

|
#44
Delaware Ave SW Apt N720
Washington, DC 20024
|
- sq. feet
|
1 baths 1 beds |
$149,900
|
show details |

|
#45
Wilson Bridge Dr Unit #6770 A-2
Oxon Hill, MD 20745
|
- sq. feet
|
1 baths 1 beds |
$99,750
|
show details |

|
#46
T St SE Apt 3
Washington, DC 20020
|
- sq. feet
|
2 baths 4 beds |
$307,500
|
show details |

|
#47
Oakwood St SE Apt B5
Washington, DC 20032
|
628 sq. feet
|
1 baths 1 beds |
show details | |

|
#48
Holbrook Ter NE
Washington, DC 20002
|
3,164 sq. feet
|
4 baths 8 beds |
show details | |

|
#49
Caledonia Ct Apt K
Germantown, MD 20874
|
1,087 sq. feet
|
2 baths 2 beds |
show details | |

|
Check over 1 million property listings on Foreclosure.com!
|
browse all offers | |||

Latest news about housing in Bethesda, MD collected exclusively by city-data.com from local newspapers, TV, and radio stations


Median year apartment built: 1977
Household type by relationship:
Households: 68,522- Male householders: 13,667 (4,063 living alone), Female householders: 14,859 (6,019 living alone)
14,688 spouses (14,518 opposite-sex spouses), 1,402 unmarried partners, (1,352 opposite-sex unmarried partners), 20,323 children (19,918 natural, 245 adopted, 160 stepchildren), 0 grandchildren, 354 brothers or sisters, 1,037 parents, 0 foster children, 125 other relatives, 1,226 non-relatives
- In group quarters: 841
Size of family households: 6,242 2-persons, 4,776 3-persons, 4,356 4-persons, 1,020 5-persons, 311 6-persons.
Size of nonfamily households: 10,082 1-person, 1,560 2-persons, 131 3-persons, 48 4-persons.
12,502 married couples with children.
2,074 single-parent households (825 men, 1,249 women).
69.5% of residents of Bethesda speak English at home.
7.0% of residents speak Spanish at home (80% speak English very well, 14% speak English well, 4% speak English not well, 2% don't speak English at all).
12.9% of residents speak other Indo-European language at home (85% speak English very well, 9% speak English well, 4% speak English not well, 2% don't speak English at all).
6.7% of residents speak Asian or Pacific Island language at home (71% speak English very well, 19% speak English well, 9% speak English not well, 2% don't speak English at all).
3.2% of residents speak other language at home (74% speak English very well, 14% speak English well, 11% speak English not well, 1% don't speak English at all).
Foreign born population: 18,825 (27.5%)
(44.6% of them are naturalized citizens)
| Here: | 10.0 |
| State: | 7.3 |
| Here: | 3.4 |
| State: | 4.2 |

- Bedrooms in owner-occupied houses and condos in Bethesda, Maryland
- 130no bedroom
- 8481 bedroom
- 2,8082 bedrooms
- 3,4943 bedrooms
- 5,5704 bedrooms
- 4,9095+ bedrooms

- Bedrooms in renter-occupied apartments in Bethesda, Maryland
- 1,290no bedroom
- 5,0451 bedroom
- 2,5742 bedrooms
- 8793 bedrooms
- 8504 bedrooms
- 1295+ bedrooms

- Cars and other vehicles available in Bethesda in owner-occupied houses/condos
- 906no vehicle
- 5,4931 vehicle
- 8,6102 vehicles
- 2,3013 vehicles
- 3194 vehicles
- 1305+ vehicles

- Cars and other vehicles available in Bethesda in renter-occupied apartments
- 2,593no vehicle
- 6,5141 vehicle
- 1,3332 vehicles
- 3273 vehicles
- 04 vehicles
- 05+ vehicles

- Rooms in owner-occupied houses in Bethesda, Maryland
- 1301 room
- 1012 rooms
- 9173 rooms
- 1,0774 rooms
- 1,0085 rooms
- 1,6206 rooms
- 1,6277 rooms
- 2,3688 rooms
- 8,9119+ rooms

- Rooms in renter-occupied apartments in Bethesda, Maryland
- 1,1951 room
- 1,3482 rooms
- 3,0673 rooms
- 2,2984 rooms
- 1,1205 rooms
- 2906 rooms
- 3937 rooms
- 4348 rooms
- 6229+ rooms


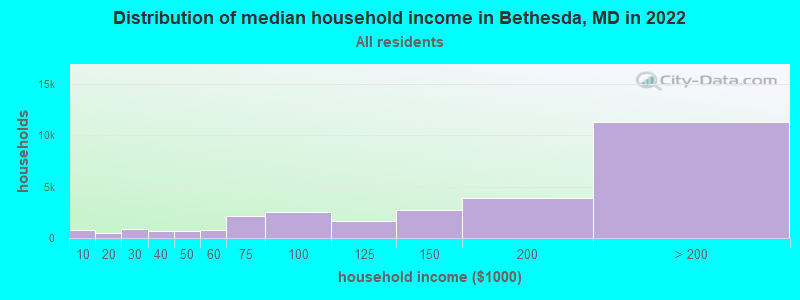
Bethesda, MD household income distribution

- 815Less than $10,000
- 511$10,000 to $19,999
- 831$20,000 to $29,999
- 649$30,000 to $39,999
- 718$40,000 to $49,999
- 777$50,000 to $59,999
- 2,145$60,000 to $74,999
- 2,533$75,000 to $99,999
- 1,609$100,000 to $124,999
- 2,752$125,000 to $149,999
- 3,891$150,000 to $199,999
- 11,295$200,000 or more
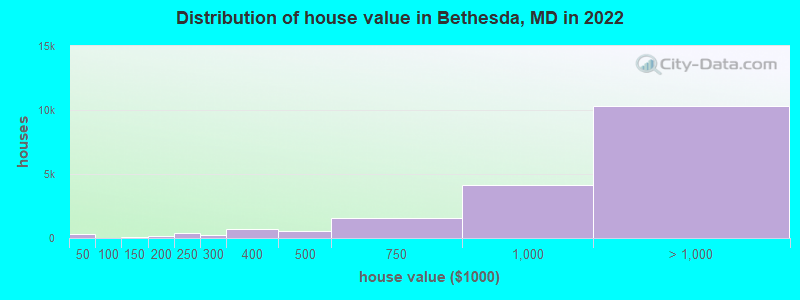
Home value of owner - occupied houses in 2022 in Bethesda, MD
-
- 242Less than $10,000
- 7$10,000 to $14,999
- 2$15,000 to $19,999
- 22$20,000 to $24,999
- 19$25,000 to $29,999
- 3$50,000 to $59,999
- 17$90,000 to $99,999
- 40$100,000 to $124,999
- 29$125,000 to $149,999
- 54$150,000 to $174,999
- 137$175,000 to $199,999
- 353$200,000 to $249,999
- 220$250,000 to $299,999
- 721$300,000 to $399,999
- 527$400,000 to $499,999
- 1,577$500,000 to $749,999
- 4,170$750,000 to $999,999
- 5,296$1,000,000 to $1,499,999
- 2,960$1,500,000 to $1,999,999
- 2,089$2,000,000 or more
Rent paid by renters in 2022 in Bethesda, MD
-
- 10Less than $100
- 15$150 to $199
- 75$200 to $249
- 27$250 to $299
- 12$400 to $449
- 11$500 to $549
- 14$550 to $599
- 53$600 to $649
- 24$700 to $749
- 5$750 to $799
- 39$800 to $899
- 74$900 to $999
- 347$1,000 to $1,249
- 596$1,250 to $1,499
- 2,416$1,500 to $1,999
- 1,719$2,000 to $2,499
- 929$2,500 to $2,999
- 678$3,000 to $3,499
- 1,333$3,500 or more
- 401No cash rent


Percentage of workers working in this county: 71.5%
Number of people working at home: 13,829 (40.2% of all workers)
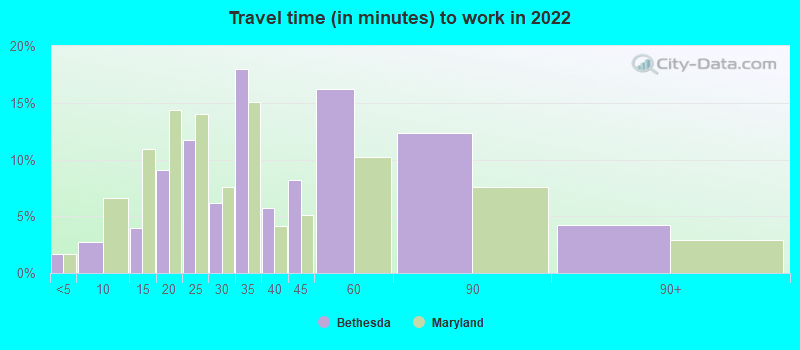
Travel time to work (commute)
- Less than 5 minutes: 267
- 5 to 9 minutes: 917
- 10 to 14 minutes: 1,841
- 15 to 19 minutes: 3,168
- 20 to 24 minutes: 3,550
- 25 to 29 minutes: 1,592
- 30 to 34 minutes: 2,935
- 35 to 39 minutes: 1,027
- 40 to 44 minutes: 2,718
- 45 to 59 minutes: 1,763
- 60 to 89 minutes: 1,690
- 90 or more minutes: 242
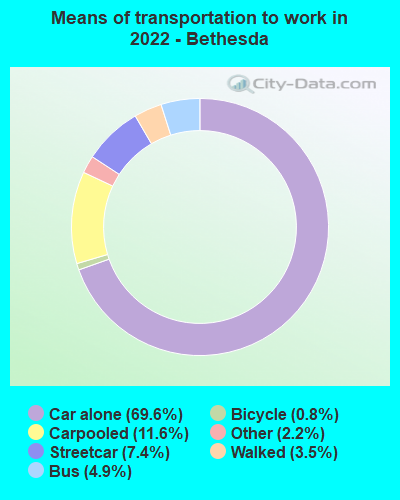
Means of transportation to work:
- Drove a car alone: 44,431 (57.1%)
- Carpooled: 7,437 (9.6%)
- Bus: 3,110 (4.0%)
- Subway or elevated rail: 4,706 (6.0%)
- Long-distance train or commuter rail: 29 (0.0%)
- Taxi: 1,433 (1.8%)
- Bicycle: 482 (0.6%)
- Walked: 2,216 (2.8%)
- Worked at home: 14,026 (18.0%)

- Unemployment by race in 2022
- Unemployment rate for White non-Hispanic residents
- 0.8%Males
- 2.8%Females
- Unemployment rate for Black residents
- 8.4%Males
- 3.2%Females
- Unemployment rate for Asian residents
- 2.3%Males
- 4.0%Females
- Unemployment rate for other race residents
- 20.1%Females
- Unemployment rate for two or more race residents
- 0.7%Males
- 3.1%Females
- Unemployment rate for Hispanic or Latino residents
- 1.4%Males
- 7.6%Females

- Year of entry for the foreign-born population in Bethesda, Maryland
- 8,2422010 or later
- 2,7162000 to 2009
- 2,1001990 to 1999
- 2,0751980 to 1989
- 1,9011970 to 1979
- 2,545Before 1970

First ancestries reported:
- Irish: 2,202 (6.2%)
- English: 2,049 (5.8%)
- German: 1,938 (5.5%)
- Eastern European: 1,921 (5.4%)
- European: 1,568 (4.4%)
- American: 1,478 (4.2%)
- Russian: 1,456 (4.1%)
- Iranian: 1,411 (4.0%)
- Italian: 1,069 (3.0%)
- French: 687 (1.9%)
- Polish: 582 (1.6%)
- Ethiopian: 507 (1.4%)
- Turkish: 441 (1.2%)
- Scottish: 438 (1.2%)
- Ukrainian: 424 (1.2%)
- Lebanese: 394 (1.1%)
- Afghan: 382 (1.1%)
- Sudanese: 341 (1.0%)
- Greek: 297 (0.8%)
- Brazilian: 254 (0.7%)
- British: 232 (0.7%)
- Northern European: 232 (0.7%)
- Portuguese: 227 (0.6%)
- Romanian: 225 (0.6%)
- Albanian: 213 (0.6%)
- Armenian: 207 (0.6%)
- Danish: 170 (0.5%)
- Macedonian: 151 (0.4%)
- Swedish: 151 (0.4%)
- Egyptian: 149 (0.4%)
- Austrian: 149 (0.4%)
- African: 145 (0.4%)
- Nigerian: 145 (0.4%)
- Dutch: 144 (0.4%)
- South African: 142 (0.4%)
- Australian: 133 (0.4%)
- Hungarian: 128 (0.4%)
- Slovak: 120 (0.3%)
- Belgian: 110 (0.3%)
- Scotch-Irish: 99 (0.3%)
- Swiss: 94 (0.3%)
- Bulgarian: 89 (0.3%)
- Lithuanian: 74 (0.2%)
- Jamaican: 62 (0.2%)
- French Canadian: 61 (0.2%)
- Norwegian: 48 (0.1%)
- Estonian: 46 (0.1%)
- Czech: 37 (0.1%)
- Maltese: 37 (0.1%)
- Scandinavian: 37 (0.1%)
- Finnish: 35 (0.10%)
- Slovene: 32 (0.09%)
- Syrian: 31 (0.09%)
- Senegalese: 30 (0.08%)
- Serbian: 29 (0.08%)
- Welsh: 27 (0.08%)
- Basque: 26 (0.07%)
- Croatian: 26 (0.07%)
- Icelander: 22 (0.06%)
- Ghanaian: 20 (0.06%)
- Haitian: 20 (0.06%)
- Arab: 19 (0.05%)
- Slavic: 18 (0.05%)
- Canadian: 16 (0.05%)
- Yugoslavian: 15 (0.04%)
- Latvian: 14 (0.04%)
- Ugandan: 9 (0.03%)
- Belizean: 8 (0.02%)
- Israeli: 2 (0.01%)
Most common places of birth for foreign-born residents (%):
| Bethesda: | 7.1% (1,183) |
| Maryland: | 4.6% (44,742) |
| Bethesda: | 6.8% (1,144) |
| Maryland: | 1.3% (12,074) |
| Bethesda: | 6.7% (1,127) |
| Maryland: | 6.4% (61,725) |
| Bethesda: | 4.1% (684) |
| Maryland: | 0.4% (4,217) |
| Bethesda: | 3.9% (647) |
| Maryland: | 0.5% (4,995) |
| Bethesda: | 3.2% (539) |
| Maryland: | 1.0% (9,481) |
| Bethesda: | 2.9% (487) |
| Maryland: | 3.2% (30,870) |
| Bethesda: | 2.9% (485) |
| Maryland: | 1.2% (11,980) |
| Bethesda: | 2.8% (471) |
| Maryland: | 3.4% (32,635) |
| Bethesda: | 2.8% (468) |
| Maryland: | 0.2% (1,454) |
| Bethesda: | 2.4% (409) |
| Maryland: | 0.4% (3,850) |
| Bethesda: | 2.3% (385) |
| Maryland: | 0.3% (3,203) |
| Bethesda: | 2.3% (384) |
| Maryland: | 1.2% (11,265) |
| Bethesda: | 2.3% (383) |
| Maryland: | 3.5% (34,065) |
| Bethesda: | 2.3% (380) |
| Maryland: | 0.4% (4,282) |
| Bethesda: | 2.3% (380) |
| Maryland: | 0.2% (1,757) |
| Bethesda: | 1.8% (302) |
| Maryland: | 0.7% (6,724) |
| Bethesda: | 1.8% (300) |
| Maryland: | 3.8% (36,698) |
| Bethesda: | 1.8% (299) |
| Maryland: | 0.9% (8,603) |
| Bethesda: | 1.8% (293) |
| Maryland: | 1.3% (12,898) |
| Bethesda: | 1.7% (280) |
| Maryland: | 1.8% (17,161) |
| Bethesda: | 1.6% (269) |
| Maryland: | 0.5% (4,901) |
| Bethesda: | 1.6% (264) |
| Maryland: | 0.5% (4,596) |
| Bethesda: | 1.5% (255) |
| Maryland: | 0.0% (442) |
Place of birth for U.S.-born residents:
- This state: 9,108
- Other state: 37,303
- Northeast: 12,544
- Midwest: 5,485
- South: 15,875
- West: 3,399
85.2% of Bethesda residents lived in the same house 1 years ago.
Out of people who lived in different houses, 30.1% lived in this county.
Out of people who lived in different counties, 10.6% lived in Maryland.
| Bethesda: | 85.2% |
| State average: | 88.5% |
Education attainment for males 25 years and older:
- No schooling: 133
- Nursery to 4th grade: 48
- 5th and 6th grade: 66
- 7th and 8th grade: 58
- 9th grade: 9
- 10th grade: 4
- 11th grade: 26
- 12th grade, no diploma: 91
- High school graduate (or equivalency): 630
- Less than 1 year of college: 199
- Some college more than 1 year, no degree: 601
- Associate degree: 374
- Bachelor's degree: 5,924
- Master's degree: 6,072
- Professional school degree: 4,186
- Doctorate degree: 3,809

Education attainment for females 25 years and older:
- No schooling: 124
- Nursery to 4th grade: 37
- 5th and 6th grade: 138
- 7th and 8th grade: 27
- 9th grade: 12
- 10th grade: 41
- 11th grade: 37
- 12th grade, no diploma: 139
- High school graduate (or equivalency): 1,026
- Less than 1 year of college: 201
- Some college more than 1 year, no degree: 1,081
- Associate degree: 462
- Bachelor's degree: 7,882
- Master's degree: 7,856
- Professional school degree: 3,353
- Doctorate degree: 2,362


Housing units in structures:
- One, detached: 15,720
- One, attached: 1,130
- Two: 235
- 3 or 4: 176
- 5 to 9: 1,218
- 10 to 19: 225
- 20 to 49: 1,081
- 50 or more: 11,058
- Mobile homes: 126
Housing units lacking complete kitchen facilities in 2022: 0.8%
House/condo owner moved in on average 13 years ago
Renter moved in on average 1 years ago

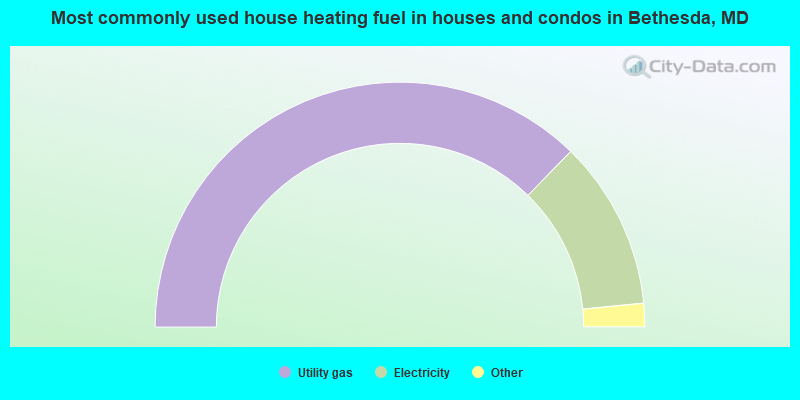
- 74.5%Utility gas
- 22.3%Electricity
- 1.1%Bottled, tank, or LP gas
- 0.9%Fuel oil, kerosene, etc.
- 0.5%No fuel used
- 0.4%Other fuel
- 0.2%Solar energy
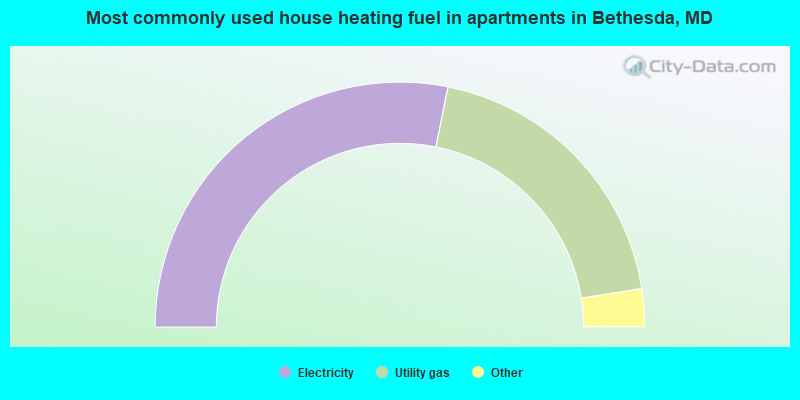
- 56.3%Electricity
- 38.7%Utility gas
- 1.8%No fuel used
- 1.6%Bottled, tank, or LP gas
- 1.3%Fuel oil, kerosene, etc.
- 0.2%Other fuel
Private vs. public school enrollment:
| Here: | 17.7% |
| Maryland: | 15.2% |
| Here: | 26.6% |
| Maryland: | 14.4% |
| Here: | 61.9% |
| Maryland: | 20.2% |


