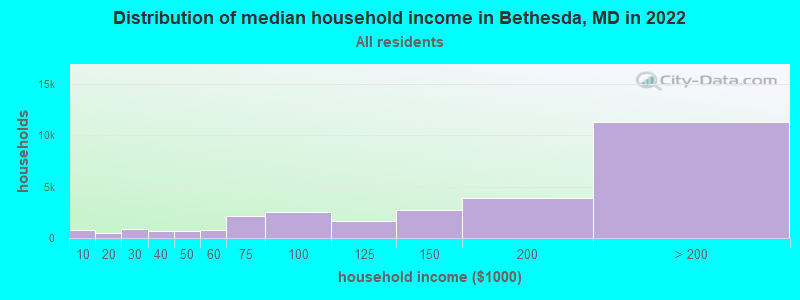
The median household income in Bethesda, MD in 2022 was $158,720, which was 40.2% greater than the median annual income of $94,991 across the entire state of Maryland. Compared to the median income of $99,102 in 2000 this represents an increase of 37.6%. The per capita income in 2022 was $105,420, which means an increase of 44.5% compared to 2000 when it was $58,479.
Whole page based on the data from 2000 / 2022 when the population of Bethesda, Maryland was 55,277 / 68,522
Income statistics for all residents
Median household income in Bethesda, MD in 2022:
Bethesda:
$158,720
State:
$94,991
Change in median household income between 2000 and 2022:
Bethesda, Maryland:
+60.2%
Maryland:
+79.7%
Number of households with income < $10k:
Bethesda:
2.9% (815)
Maryland:
4.8% (114,450)
Number of households with income $10k - 20k:
Bethesda:
1.8% (511)
Maryland:
5.0% (117,883)
Number of households with income $20k - 30k:
Bethesda:
2.9% (831)
Maryland:
5.2% (123,350)
Number of households with income $30k - 40k:
Bethesda:
2.3% (649)
Maryland:
5.6% (134,104)
Number of households with income $40k - 50k:
Bethesda:
2.5% (718)
State:
5.6% (132,932)
Number of households with income $50k - 60k:
Bethesda:
2.7% (777)
State:
5.6% (132,707)
Number of households with income $60k - 75k:
Bethesda:
7.5% (2,145)
Maryland:
7.9% (188,335)
Number of households with income $75k - 100k:
Bethesda:
8.9% (2,533)
State:
12.5% (297,873)
Number of households with income $100k - 125k:
Bethesda:
5.6% (1,609)
State:
10.5% (250,497)
Number of households with income $125k - 150k:
Bethesda:
9.6% (2,752)
Maryland:
8.1% (193,208)
Number of households with income $150k - 200k:
Bethesda:
13.6% (3,891)
State:
11.6% (274,905)
Number of households with income > $200k:
Bethesda:
39.6% (11,295)
Maryland:
17.5% (415,740)
Aggregate household income in Bethesda in 2022: $7,153,552,000
Median family income in Bethesda in 2022:
Bethesda:
$238,958
State:
$117,294
Number of families with income < $10k:
Bethesda:
1.6% (273)
State:
2.7% (41,433)
Number of families with income $10k - 20k:
Bethesda:
1.0% (171)
State:
2.6% (40,126)
Number of families with income $20k - 30k:
Bethesda:
2.0% (335)
State:
3.4% (52,891)
Number of families with income $30k - 40k:
Bethesda:
0.6% (104)
State:
4.5% (70,252)
Number of families with income $40k - 50k:
Bethesda:
1.5% (248)
Maryland:
4.8% (74,112)
Number of families with income $50k - 60k:
Bethesda:
2.4% (404)
State:
5.0% (77,590)
Number of families with income $60k - 75k:
Bethesda:
2.1% (360)
State:
7.1% (109,924)
Number of families with income $75k - 100k:
Bethesda:
3.5% (591)
Maryland:
12.0% (185,255)
Number of families with income $100k - 125k:
Bethesda:
4.8% (813)
Maryland:
11.2% (173,203)
Number of families with income $125k - 150k:
Bethesda:
4.8% (813)
State:
9.3% (143,453)
Number of families with income $150k - 200k:
Bethesda:
12.9% (2,167)
State:
14.2% (218,861)
Number of families with income > $200k:
Bethesda:
62.7% (10,573)
State:
23.2% (359,182)
Median non-family income in Bethesda in 2022:
Bethesda:
$81,565
Maryland:
$57,179
Change in median non-family income between 2000 and 2022:
Bethesda, Maryland:
+37.5%
State:
+75.1%
Median per capita income in Bethesda in 2022:
Bethesda:
$105,420
State:
$49,236
Change in median per capita income between 2000 and 2022:
Bethesda, Maryland:
+80.3%
Maryland:
+92.2%
Income statistics for White residents
Median household income in Bethesda, MD in 2022:
Bethesda:
$174,167
State:
$107,160
Change in median household income between 2000 and 2022:
Bethesda, Maryland:
+69.9%
State:
+85.3%
Number of households with income < $10k:
Bethesda:
3.3% (721)
State:
3.7% (47,387)
Number of households with income $10k - 20k:
Bethesda:
1.5% (319)
Maryland:
4.1% (52,102)
Number of households with income $20k - 30k:
Bethesda:
2.3% (504)
State:
4.6% (58,758)
Number of households with income $30k - 40k:
Bethesda:
2.1% (447)
Maryland:
4.7% (59,745)
Number of households with income $40k - 50k:
Bethesda:
2.8% (614)
Maryland:
5.0% (62,576)
Number of households with income $50k - 60k:
Bethesda:
2.3% (505)
State:
5.1% (64,484)
Number of households with income $60k - 75k:
Bethesda:
7.2% (1,556)
Maryland:
7.7% (97,019)
Number of households with income $75k - 100k:
Bethesda:
6.8% (1,470)
State:
11.8% (149,205)
Number of households with income $100k - 125k:
Bethesda:
5.7% (1,240)
State:
10.6% (134,231)
Number of households with income $125k - 150k:
Bethesda:
9.4% (2,028)
State:
8.8% (111,081)
Number of households with income $150k - 200k:
Bethesda:
13.5% (2,918)
Maryland:
12.9% (162,966)
Number of households with income > $200k:
Bethesda:
42.9% (9,272)
Maryland:
20.9% (264,377)
Aggregate household income in Bethesda in 2022: $5,871,575,300
Median family income in Bethesda in 2022:
Bethesda:
$250,001
Maryland:
$134,708
Number of families with income < $10k:
Bethesda:
1.4% (161)
Maryland:
1.6% (13,064)
Number of families with income $10k - 20k:
Bethesda:
0.3% (36)
State:
2.0% (16,048)
Number of families with income $20k - 30k:
Bethesda:
0.8% (92)
State:
2.2% (18,018)
Number of families with income $30k - 40k:
Bethesda:
0.3% (30)
State:
3.3% (26,886)
Number of families with income $40k - 50k:
Bethesda:
0.8% (89)
State:
3.6% (29,194)
Number of families with income $50k - 60k:
Bethesda:
1.8% (209)
State:
4.1% (33,120)
Number of families with income $60k - 75k:
Bethesda:
1.6% (196)
State:
6.6% (53,501)
Number of families with income $75k - 100k:
Bethesda:
3.4% (405)
State:
11.3% (91,779)
Number of families with income $100k - 125k:
Bethesda:
4.1% (481)
Maryland:
11.3% (91,483)
Number of families with income $125k - 150k:
Bethesda:
5.2% (622)
Maryland:
9.9% (80,832)
Number of families with income $150k - 200k:
Bethesda:
11.9% (1,415)
State:
16.0% (130,295)
Number of families with income > $200k:
Bethesda:
68.5% (8,126)
State:
28.1% (228,324)
Median non-family income in Bethesda in 2022:
Bethesda:
$81,983
State:
$61,991
Change in median non-family income between 2000 and 2022:
Bethesda, Maryland:
+35.6%
State:
+76.8%
Median per capita income in Bethesda in 2022:
Bethesda:
$122,829
State:
$59,750
Change in median per capita income between 2000 and 2022:
Bethesda, Maryland:
+96.0%
State:
+104.5%
Income statistics for Black or African American residents
Median household income in Bethesda, MD in 2022:
Bethesda:
$65,858
State:
$77,368
Change in median household income between 2000 and 2022:
Bethesda, Maryland:
+4.1%
State:
+85.7%
Number of households with income < $10k:
Bethesda:
0.0% (0)
Maryland:
7.0% (50,093)
Number of households with income $10k - 20k:
Bethesda:
13.3% (192)
State:
7.2% (51,849)
Number of households with income $20k - 30k:
Bethesda:
10.4% (150)
State:
5.8% (41,510)
Number of households with income $30k - 40k:
Bethesda:
4.8% (70)
Maryland:
6.9% (49,466)
Number of households with income $40k - 50k:
Bethesda:
4.6% (67)
State:
6.6% (47,557)
Number of households with income $50k - 60k:
Bethesda:
7.7% (111)
Maryland:
6.2% (44,818)
Number of households with income $60k - 75k:
Bethesda:
10.0% (144)
State:
8.6% (61,728)
Number of households with income $75k - 100k:
Bethesda:
5.1% (73)
Maryland:
13.2% (95,107)
Number of households with income $100k - 125k:
Bethesda:
10.0% (144)
Maryland:
10.2% (73,579)
Number of households with income $125k - 150k:
Bethesda:
5.6% (81)
State:
7.2% (51,970)
Number of households with income $150k - 200k:
Bethesda:
5.1% (73)
State:
9.4% (67,623)
Number of households with income > $200k:
Bethesda:
23.5% (340)
State:
11.7% (83,862)
Aggregate household income in Bethesda in 2022: $198,060,700
Median non-family income in Bethesda in 2022:
Bethesda:
$66,344
State:
$49,944
Change in median non-family income between 2000 and 2022:
Bethesda, Maryland:
+37.3%
State:
+71.8%
Median per capita income in Bethesda in 2022:
Bethesda:
$47,868
State:
$40,756
Change in median per capita income between 2000 and 2022:
Bethesda, Maryland:
+66.3%
Maryland:
+113.5%
Income statistics for Asian residents
Median household income in Bethesda, MD in 2022:
Bethesda:
$139,180
Maryland:
$117,771
Change in median household income between 2000 and 2022:
Bethesda, Maryland:
+89.8%
Maryland:
+97.6%
Number of households with income < $10k:
Bethesda:
2.8% (83)
State:
4.6% (6,395)
Number of households with income $10k - 20k:
Bethesda:
1.9% (55)
Maryland:
3.6% (4,994)
Number of households with income $20k - 30k:
Bethesda:
3.9% (116)
State:
4.6% (6,399)
Number of households with income $30k - 40k:
Bethesda:
1.1% (31)
Maryland:
3.4% (4,682)
Number of households with income $40k - 50k:
Bethesda:
5.1% (151)
State:
4.6% (6,382)
Number of households with income $50k - 60k:
Bethesda:
3.8% (112)
State:
4.6% (6,402)
Number of households with income $60k - 75k:
Bethesda:
4.8% (141)
State:
5.4% (7,426)
Number of households with income $75k - 100k:
Bethesda:
7.4% (217)
Maryland:
11.1% (15,313)
Number of households with income $100k - 125k:
Bethesda:
9.1% (267)
State:
10.6% (14,640)
Number of households with income $125k - 150k:
Bethesda:
4.7% (139)
State:
8.3% (11,465)
Number of households with income $150k - 200k:
Bethesda:
14.5% (425)
State:
13.4% (18,490)
Number of households with income > $200k:
Bethesda:
40.9% (1,203)
State:
25.6% (35,377)
Aggregate household income in Bethesda in 2022: $638,548,100
Median family income in Bethesda in 2022:
Bethesda:
$177,780
State:
$137,857
Number of families with income < $10k:
Bethesda:
2.7% (58)
State:
2.7% (2,888)
Number of families with income $10k - 20k:
Bethesda:
0.6% (14)
Maryland:
2.4% (2,535)
Number of families with income $20k - 30k:
Bethesda:
4.6% (98)
State:
3.3% (3,499)
Number of families with income $30k - 40k:
Bethesda:
0.7% (14)
State:
2.4% (2,563)
Number of families with income $40k - 50k:
Bethesda:
3.3% (70)
Maryland:
4.1% (4,351)
Number of families with income $50k - 60k:
Bethesda:
3.6% (77)
Maryland:
4.4% (4,709)
Number of families with income $60k - 75k:
Bethesda:
1.2% (27)
Maryland:
4.5% (4,749)
Number of families with income $75k - 100k:
Bethesda:
6.7% (143)
Maryland:
10.9% (11,658)
Number of families with income $100k - 125k:
Bethesda:
6.3% (134)
State:
10.6% (11,243)
Number of families with income $125k - 150k:
Bethesda:
4.6% (98)
State:
9.2% (9,834)
Number of families with income $150k - 200k:
Bethesda:
13.7% (293)
State:
15.2% (16,182)
Number of families with income > $200k:
Bethesda:
52.1% (1,117)
State:
30.3% (32,297)
Median non-family income in Bethesda in 2022:
Bethesda:
$70,776
State:
$62,510
Change in median non-family income between 2000 and 2022:
Bethesda, Maryland:
+90.0%
State:
+83.8%
Median per capita income in Bethesda in 2022:
Bethesda:
$67,261
State:
$53,546
Change in median per capita income between 2000 and 2022:
Bethesda, Maryland:
+93.3%
Maryland:
+122.9%
Income statistics for Hispanic or Latino residents
Median household income in Bethesda, MD in 2022:
Bethesda:
$165,360
Maryland:
$82,138
Change in median household income between 2000 and 2022:
Bethesda, Maryland:
+122.6%
State:
+70.2%
Number of households with income < $10k:
Bethesda:
5.8% (125)
State:
3.7% (6,871)
Number of households with income $10k - 20k:
Bethesda:
2.3% (50)
State:
2.9% (5,465)
Number of households with income $20k - 30k:
Bethesda:
1.5% (33)
Maryland:
5.9% (11,012)
Number of households with income $30k - 40k:
Bethesda:
0.7% (15)
State:
7.9% (14,668)
Number of households with income $40k - 50k:
Bethesda:
2.6% (56)
State:
7.6% (14,074)
Number of households with income $50k - 60k:
Bethesda:
3.1% (66)
State:
7.6% (14,166)
Number of households with income $60k - 75k:
Bethesda:
8.3% (178)
Maryland:
9.9% (18,486)
Number of households with income $75k - 100k:
Bethesda:
14.0% (300)
State:
16.1% (30,032)
Number of households with income $100k - 125k:
Bethesda:
7.5% (160)
Maryland:
9.4% (17,432)
Number of households with income $125k - 150k:
Bethesda:
5.8% (123)
State:
7.5% (13,963)
Number of households with income $150k - 200k:
Bethesda:
13.0% (278)
State:
10.1% (18,750)
Number of households with income > $200k:
Bethesda:
35.3% (754)
State:
11.4% (21,133)
Aggregate household income in Bethesda in 2022: $406,313,700
Median family income in Bethesda in 2022:
Bethesda:
$200,524
State:
$80,127
Number of families with income < $10k:
Bethesda:
1.5% (21)
State:
3.1% (4,499)
Number of families with income $20k - 30k:
Bethesda:
1.1% (14)
State:
6.8% (10,000)
Number of families with income $30k - 40k:
Bethesda:
1.1% (15)
State:
7.6% (11,123)
Number of families with income $40k - 50k:
Bethesda:
1.9% (26)
Maryland:
8.1% (11,900)
Number of families with income $50k - 60k:
Bethesda:
3.5% (47)
State:
8.5% (12,561)
Number of families with income $60k - 75k:
Bethesda:
10.1% (138)
Maryland:
10.2% (15,051)
Number of families with income $75k - 100k:
Bethesda:
4.6% (63)
State:
14.6% (21,440)
Number of families with income $100k - 125k:
Bethesda:
7.7% (106)
Maryland:
9.6% (14,146)
Number of families with income $125k - 150k:
Bethesda:
4.3% (59)
State:
6.9% (10,202)
Number of families with income $150k - 200k:
Bethesda:
21.2% (289)
State:
10.7% (15,752)
Number of families with income > $200k:
Bethesda:
43.1% (589)
State:
11.6% (17,028)
Median non-family income in Bethesda in 2022:
Bethesda:
$110,750
State:
$55,347
Change in median non-family income between 2000 and 2022:
Bethesda, Maryland:
+112.6%
State:
+61.9%
Median per capita income in Bethesda in 2022:
Bethesda:
$75,262
State:
$29,024
Income statistics for American Indian and Alaska Native residents
Median household income in Bethesda, MD in 2022:
Bethesda:
$250,001
Maryland:
$71,440
Change in median household income between 2000 and 2022:
Bethesda, Maryland:
+103.7%
State:
+36.4%
Number of households with income < $10k:
Bethesda:
0.0% (0)
State:
4.6% (360)
Number of households with income $10k - 20k:
Bethesda:
0.0% (0)
State:
8.1% (632)
Number of households with income $20k - 30k:
Bethesda:
0.0% (0)
Maryland:
5.8% (454)
Number of households with income $30k - 40k:
Bethesda:
0.0% (0)
State:
6.7% (522)
Number of households with income $40k - 50k:
Bethesda:
0.0% (0)
State:
12.9% (1,010)
Number of households with income $50k - 60k:
Bethesda:
0.0% (0)
State:
7.0% (546)
Number of households with income $60k - 75k:
Bethesda:
0.0% (0)
State:
8.1% (635)
Number of households with income $75k - 100k:
Bethesda:
0.0% (0)
State:
7.0% (551)
Number of households with income $100k - 125k:
Bethesda:
0.0% (0)
State:
9.0% (702)
Number of households with income $125k - 150k:
Bethesda:
0.0% (0)
Maryland:
6.9% (541)
Number of households with income $150k - 200k:
Bethesda:
0.0% (0)
Maryland:
12.4% (972)
Number of households with income > $200k:
Bethesda:
100.0% (47)
State:
11.7% (916)
Aggregate household income in Bethesda in 2022: $24,203,490
Median per capita income in Bethesda in 2022:
Bethesda:
$104,993
State:
$35,089
Income statistics for Multirace residents
Median household income in Bethesda, MD in 2022:
Bethesda:
$150,611
State:
$99,027
Change in median household income between 2000 and 2022:
Bethesda, Maryland:
+78.3%
State:
+111.4%
Number of households with income < $10k:
Bethesda:
1.3% (24)
State:
4.8% (6,469)
Number of households with income $10k - 20k:
Bethesda:
3.0% (56)
State:
3.3% (4,464)
Number of households with income $20k - 30k:
Bethesda:
1.2% (22)
State:
5.8% (7,826)
Number of households with income $30k - 40k:
Bethesda:
2.5% (47)
Maryland:
8.1% (11,077)
Number of households with income $40k - 50k:
Bethesda:
2.8% (53)
State:
4.3% (5,895)
Number of households with income $50k - 60k:
Bethesda:
2.4% (46)
Maryland:
3.9% (5,346)
Number of households with income $60k - 75k:
Bethesda:
6.7% (127)
State:
6.7% (9,159)
Number of households with income $75k - 100k:
Bethesda:
13.0% (244)
State:
13.6% (18,420)
Number of households with income $100k - 125k:
Bethesda:
5.0% (94)
State:
12.9% (17,488)
Number of households with income $125k - 150k:
Bethesda:
6.3% (118)
State:
8.1% (11,039)
Number of households with income $150k - 200k:
Bethesda:
14.3% (269)
Maryland:
11.5% (15,675)
Number of households with income > $200k:
Bethesda:
41.6% (784)
State:
17.0% (23,059)
Aggregate household income in Bethesda in 2022: $362,736,200
Median family income in Bethesda in 2022:
Bethesda:
$187,423
State:
$110,784
Number of families with income < $10k:
Bethesda:
0.8% (12)
Maryland:
3.1% (2,937)
Number of families with income $30k - 40k:
Bethesda:
2.1% (30)
State:
7.8% (7,382)
Number of families with income $40k - 50k:
Bethesda:
3.5% (50)
State:
3.6% (3,426)
Number of families with income $50k - 60k:
Bethesda:
4.4% (63)
State:
4.2% (3,995)
Number of families with income $60k - 75k:
Bethesda:
8.9% (127)
Maryland:
6.5% (6,128)
Number of families with income $75k - 100k:
Bethesda:
1.0% (14)
State:
11.7% (11,110)
Number of families with income $100k - 125k:
Bethesda:
3.7% (53)
State:
13.2% (12,548)
Number of families with income $125k - 150k:
Bethesda:
3.5% (50)
State:
9.0% (8,509)
Number of families with income $150k - 200k:
Bethesda:
19.6% (280)
Maryland:
13.6% (12,921)
Number of families with income > $200k:
Bethesda:
52.5% (750)
State:
20.9% (19,875)
Median non-family income in Bethesda in 2022:
Bethesda:
$104,277
State:
$60,702
Change in median non-family income between 2000 and 2022:
Bethesda, Maryland:
+55.6%
State:
+98.2%
Median per capita income in Bethesda in 2022:
Bethesda:
$68,673
State:
$35,630
Change in median per capita income between 2000 and 2022:
Bethesda, Maryland:
+121.7%
State:
+125.1%
Income statistics for other residents
Median household income in Bethesda, MD in 2022:
Bethesda:
$242,723
Maryland:
$72,980
Number of households with income < $10k:
Bethesda:
8.9% (34)
Maryland:
3.4% (3,746)
Number of households with income $10k - 20k:
Bethesda:
2.1% (8)
Maryland:
3.5% (3,842)
Number of households with income $20k - 30k:
Bethesda:
7.9% (30)
State:
7.6% (8,343)
Number of households with income $30k - 40k:
Bethesda:
1.6% (6)
Maryland:
7.5% (8,251)
Number of households with income $40k - 50k:
Bethesda:
0.0% (0)
State:
8.6% (9,414)
Number of households with income $50k - 60k:
Bethesda:
0.0% (0)
State:
10.0% (11,048)
Number of households with income $60k - 75k:
Bethesda:
0.0% (0)
Maryland:
11.2% (12,339)
Number of households with income $75k - 100k:
Bethesda:
2.6% (10)
State:
17.5% (19,277)
Number of households with income $100k - 125k:
Bethesda:
0.0% (0)
Maryland:
8.9% (9,813)
Number of households with income $125k - 150k:
Bethesda:
7.1% (27)
State:
6.3% (6,907)
Number of households with income $150k - 200k:
Bethesda:
11.0% (42)
State:
8.2% (9,023)
Number of households with income > $200k:
Bethesda:
58.9% (225)
State:
7.3% (8,036)
Aggregate household income in Bethesda in 2022: $94,250,793
Median per capita income in Bethesda in 2022:
Bethesda:
$72,856
State:
$24,415
Change in median per capita income between 2000 and 2022:
Bethesda, Maryland:
+123.3%
State:
+73.6%
Discuss Bethesda, Maryland (MD) on our hugely popular Maryland forum.