Bellwood, IL (Illinois) Houses and Residents
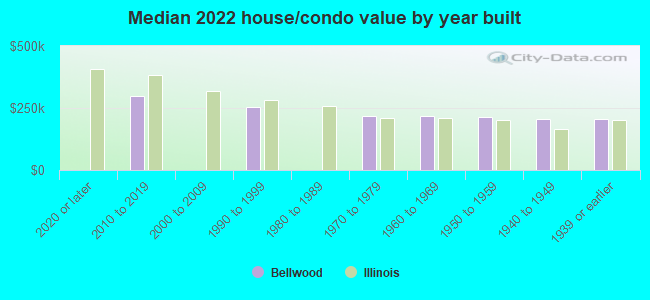
Estimated median house or condo value in 2022: $212,530 (it was $116,600 in 2000 )
Bellwood:
$212,530Illinois:
$251,600
Lower value quartile - upper value quartile: $173,530 - $249,498Mean price in 2022: Detached houses: $214,090 Here:
$214,090State:
$310,164
Townhouses or other attached units: $152,365 Here:
$152,365State:
$286,230
In 2-unit structures: $249,739 Here:
$249,739State:
$299,638
In 3-to-4-unit structures: $279,173 Here:
$279,173State:
$330,907
In 5-or-more-unit structures: $118,522 Here:
$118,522State:
$318,887
Mobile homes: $95,322 Here:
$95,322State:
$78,855
Total population: 19,152 (All urban)
Houses: 6,498 (6,137 occupied: 4,809 owner occupied, 1,432 renter occupied )
% of renters here:
23%State:
33%
Housing density: 2,724 houses/condos per square mile
Median price asked for vacant for-sale houses and condos in 2022: $121,209.
Median contract rent in 2022: $983 (lower quartile is $879, upper quartile is $1,162)
Median rent asked for vacant for-rent units in 2022: $5,028
Median gross rent in Bellwood, IL in 2022: $1,134
Housing units in Bellwood with a mortgage: 3,355 (114 second mortgage, 0 home equity loan, 52 both second mortgage and home equity loan )Houses without a mortgage: 14
Median household income for houses/condos with a mortgage: $88,893
Median household income for apartments without a mortgage: $64,894
Median monthly housing costs: $1,346
Data:
Median house or condo value ($)
Median house or condo value ($ change since 2000)
Median house or condo value ($) - White
Median house or condo value ($) - Black or African American
Median house or condo value ($) - Asian
Median house or condo value ($) - Hispanic or Latino
Median house or condo value ($) - American Indian and Alaska Native
Median house or condo value ($) - Multirace
Median house or condo value ($) - Other Race
Median price asked for mobile homes ($)
Household density (households per square mile)
Mean house or condo value by units in structure - 1, detached ($)
Mean house or condo value by units in structure - 1, attached ($)
Mean house or condo value by units in structure - 2 ($)
Mean house or condo value by units in structure by units in structure - 3 or 4 ($)
Mean house or condo value by units in structure - 5 or more ($)
Mean house or condo value by units in structure - Boat, RV, van, etc. ($)
Mean house or condo value by units in structure - Mobile home ($)
Median contract rent ($)
Median contract rent - Lower quartile ($)
Median contract rent - Upper quartile ($)
Median gross rent ($)
Urban houses (%)
Rural houses (%)
Houses occupied (%)
Houses occupied (% change since 2000)
Houses owner occupied (%)
Houses owner occupied (% change since 2000)
Houses renter occupied (%)
Houses renter occupied (% change since 2000)
Vacant housing units - For rent (%)
Vacant housing units - For rent (% change since 2000)
Vacant housing units - For sale only (%)
Vacant housing units - For sale only (% change since 2000)
Vacant housing units - Rented or sold, not occupied (%)
Vacant housing units - Rented or sold, not occupied (% change since 2000)
Vacant housing units - For seasonal, recreational, or occasional use (%)
Vacant housing units - For seasonal, recreational, or occasional use (% change since 2000)
Vacant housing units - For migrant workers (%)
Vacant housing units - For migrant workers (% change since 2000)
Vacant housing units - Other vacant (%)
Vacant housing units - Other vacant (% change since 2000)
Median monthly housing costs ($)
Median household income for houses/condos with a mortgage ($)
Median household income for houses/condos without a mortgage ($)
Median household income ($)
Median household income ($) - White
Median household income ($) - Black or African American
Median household income ($) - Asian
Median household income ($) - Hispanic or Latino
Median household income ($) - American Indian and Alaska Native
Median household income ($) - Multirace
Median household income ($) - Other Race
Mortgage status - with mortgage (%)
Mortgage status - with second mortgage (%)
Mortgage status - with home equity loan (%)
Mortgage status - with both second mortgage and home equity loan (%)
Mortgage status - without a mortgage (%)
Median year house/condo built
Median year apartment built
Household type by relationship - Male householder living alone (%)
Household type by relationship - Male householder not living alone (%)
Household type by relationship - Female householder living alone (%)
Household type by relationship - Female householder not living alone (%)
Household type by relationship - Opposite-Sex spouse (%)
Household type by relationship - Same-Sex spouse (%)
Household type by relationship - Opposite-Sex unmarried partner (%)
Household type by relationship - Same-Sex unmarried partner (%)
Household type by relationship - In group quarters (%)
Size of family households - 2-person household (%)
Size of family households - 3-person household (%)
Size of family households - 4-person household (%)
Size of family households - 5-person household (%)
Size of family households - 6-person household (%)
Size of family households - 7-or-more-person household (%)
Size of nonfamily households - 1-person household (%)
Size of nonfamily households - 2-person household (%)
Size of nonfamily households - 3-person household (%)
Size of nonfamily households - 4-person household (%)
Size of nonfamily households - 5-person household (%)
Size of nonfamily households - 6-person household (%)
Size of nonfamily households - 7-or-moreperson household (%)
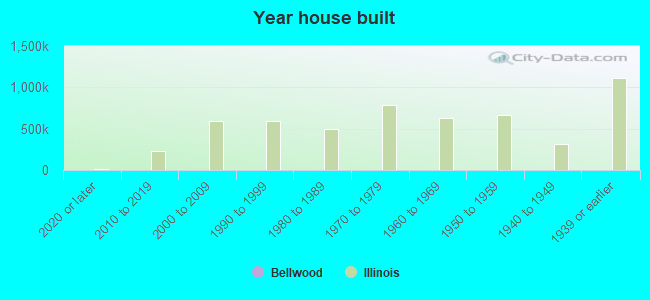
Year house built - Built 2010 or later (%)
Year house built - Built 2000 to 2009 (%)
Year house built - Built 1990 to 1999 (%)
Year house built - Built 1980 to 1989 (%)
Year house built - Built 1970 to 1979 (%)
Year house built - Built 1960 to 1969 (%)
Year house built - Built 1950 to 1959 (%)
Year house built - Built 1940 to 1949 (%)
Year house built - Built 1939 or earlier (%)
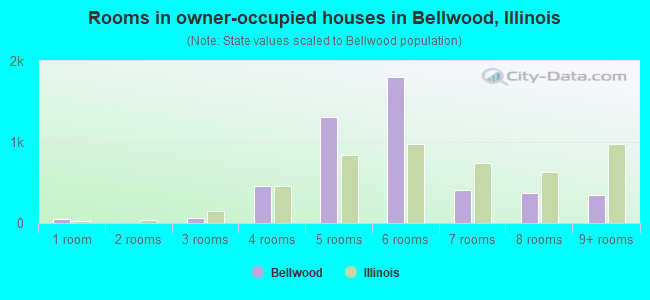
Median number of rooms in houses and condos
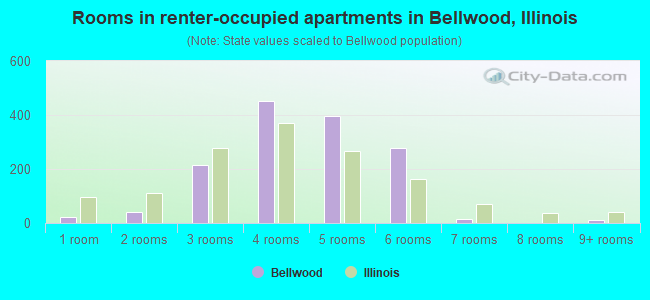
Median number of rooms in apartments
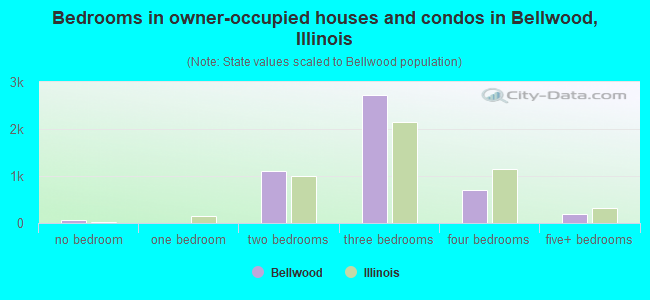
Median number of bedrooms in owner occupied houses
Mean number of bedrooms in owner occupied houses
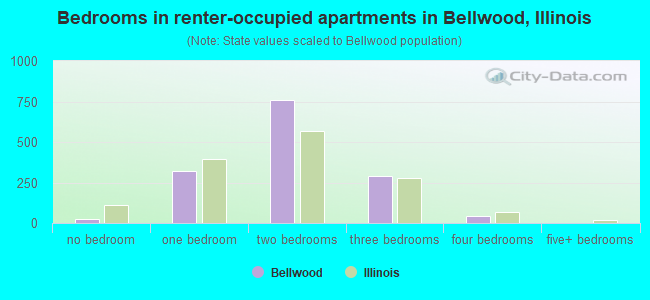
Median number of bedrooms in renter occupied houses
Mean number of bedrooms in renter occupied houses
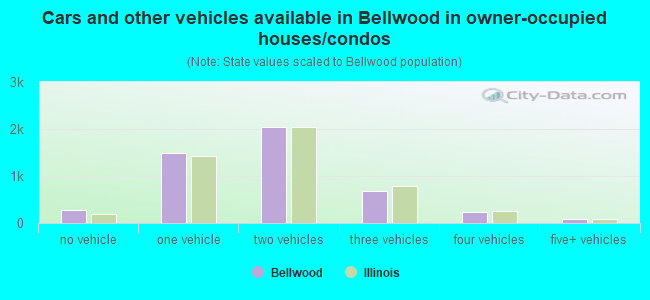
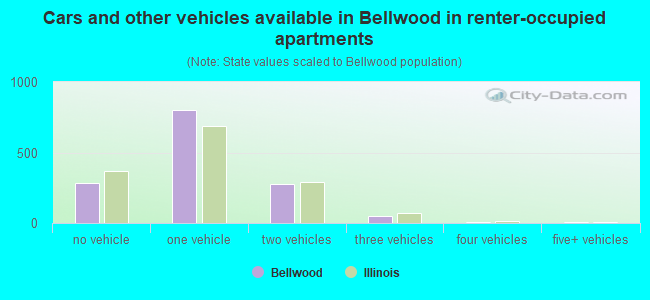
Median number of vehichles in owner occupied houses
Mean number of vehichles in owner occupied houses
Median number of vehichles in renter occupied houses
Mean number of vehichles in renter occupied houses
Rooms in owner-occupied houses - 1 room (%)
Rooms in owner-occupied houses - 2 rooms (%)
Rooms in owner-occupied houses - 3 rooms (%)
Rooms in owner-occupied houses - 4 rooms (%)
Rooms in owner-occupied houses - 5 rooms (%)
Rooms in owner-occupied houses - 6 rooms (%)
Rooms in owner-occupied houses - 7 rooms (%)
Rooms in owner-occupied houses - 8 rooms (%)
Rooms in owner-occupied houses - 9+ rooms (%)
Rooms in renter-occupied houses - 1 room (%)
Rooms in renter-occupied houses - 2 rooms (%)
Rooms in renter-occupied houses - 3 rooms (%)
Rooms in renter-occupied houses - 4 rooms (%)
Rooms in renter-occupied houses - 5 rooms (%)
Rooms in renter-occupied houses - 6 rooms (%)
Rooms in renter-occupied houses - 7 rooms (%)
Rooms in renter-occupied houses - 8 rooms (%)
Rooms in renter-occupied houses - 9+ rooms (%)
Bedrooms in owner-occupied houses - no bedrooms (%)
Bedrooms in owner-occupied houses - 1 bedroom (%)
Bedrooms in owner-occupied houses - 2 bedrooms (%)
Bedrooms in owner-occupied houses - 3 bedrooms (%)
Bedrooms in owner-occupied houses - 4 bedrooms (%)
Bedrooms in owner-occupied houses - 5+ bedrooms (%)
Bedrooms in renter-occupied houses - no bedrooms (%)
Bedrooms in renter-occupied houses - 1 bedroom (%)
Bedrooms in renter-occupied houses - 2 bedrooms (%)
Bedrooms in renter-occupied houses - 3 bedrooms (%)
Bedrooms in renter-occupied houses - 4 bedrooms (%)
Bedrooms in renter-occupied houses - 5+ bedrooms (%)
Vehicles available in owner-occupied houses - no vehicle available (%)
Vehicles available in owner-occupied houses - 1 vehicle available(%)
Vehicles available in owner-occupied houses - 2 Vehicles available (%)
Vehicles available in owner-occupied houses - 3 Vehicles available (%)
Vehicles available in owner-occupied houses - 4 Vehicles available (%)
Vehicles available in owner-occupied houses - 5+ Vehicles available (%)
Vehicles available in renter-occupied houses - no vehicle available (%)
Vehicles available in renter-occupied houses - 1 vehicle available (%)
Vehicles available in renter-occupied houses - 2 Vehicles available (%)
Vehicles available in renter-occupied houses - 3 Vehicles available (%)
Vehicles available in renter-occupied houses - 4 Vehicles available (%)
Vehicles available in renter-occupied houses - 5+ Vehicles available (%)
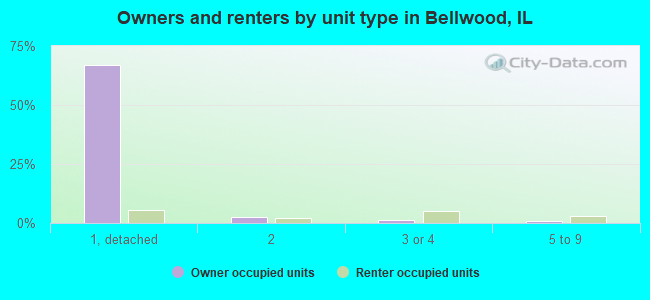
Housing units in structures - 1, detached (%)
Housing units in structures - 1, attached (%)
Housing units in structures - 2 (%)
Housing units in structures - 3 or 4 (%)
Housing units in structures - 5 to 9 (%)
Housing units in structures - 10 to 19 (%)
Housing units in structures - 20 to 49 (%)
Housing units in structures - 50 or more (%)
Housing units in structures - Mobile home (%)
Housing units in structures - Boat, RV, van, etc. (%)
Housing units in structures - Owners - 1, detached (%)
Housing units in structures - Owners - 1, attached (%)
Housing units in structures - Owners - 2 (%)
Housing units in structures - Owners - 3 or 4 (%)
Housing units in structures - Owners - 5 to 9 (%)
Housing units in structures - Owners - 10 to 19 (%)
Housing units in structures - Owners - 20 to 49 (%)
Housing units in structures - Owners - 50 or more (%)
Housing units in structures - Owners - Mobile home (%)
Housing units in structures - Owners - Boat, RV, van, etc. (%)
Housing units in structures - Renters - 1, detached (%)
Housing units in structures - Renters - 1, attached (%)
Housing units in structures - Renters - 2 (%)
Housing units in structures - Renters - 3 or 4 (%)
Housing units in structures - Renters - 5 to 9 (%)
Housing units in structures - Renters - 10 to 19 (%)
Housing units in structures - Renters - 20 to 49 (%)
Housing units in structures - Renters - 50 or more (%)
Housing units in structures - Renters - Mobile home (%)
Housing units in structures - Renters - Boat, RV, van, etc. (%)
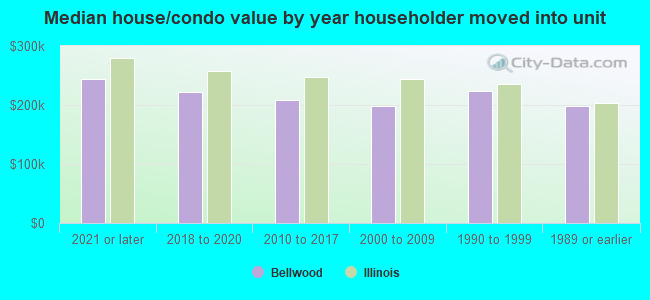
House/condo owner moved in on average (years ago)
Renter moved in on average (years ago)
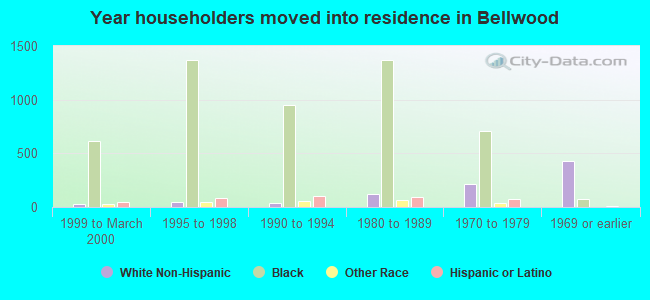
Year householder moved into unit - Moved in 1999 to March 2000 (%)
Year householder moved into unit - Moved in 1999 to March 2000 (%) - White
Year householder moved into unit - Moved in 1999 to March 2000 (%) - Black or African American
Year householder moved into unit - Moved in 1999 to March 2000 (%) - Asian
Year householder moved into unit - Moved in 1999 to March 2000 (%) - Hispanic or Latino
Year householder moved into unit - Moved in 1999 to March 2000 (%) - American Indian and Alaska Native
Year householder moved into unit - Moved in 1999 to March 2000 (%) - Multirace
Year householder moved into unit - Moved in 1999 to March 2000 (%) - Other Race
Year householder moved into unit - Moved in 1995 to 1998 (%)
Year householder moved into unit - Moved in 1995 to 1998 (%) - White
Year householder moved into unit - Moved in 1995 to 1998 (%) - Black or African American
Year householder moved into unit - Moved in 1995 to 1998 (%) - Asian
Year householder moved into unit - Moved in 1995 to 1998 (%) - Hispanic or Latino
Year householder moved into unit - Moved in 1995 to 1998 (%) - American Indian and Alaska Native
Year householder moved into unit - Moved in 1995 to 1998 (%) - Multirace
Year householder moved into unit - Moved in 1995 to 1998 (%) - Other Race
Year householder moved into unit - Moved in 1990 to 1994 (%)
Year householder moved into unit - Moved in 1990 to 1994 (%) - White
Year householder moved into unit - Moved in 1990 to 1994 (%) - Black or African American
Year householder moved into unit - Moved in 1990 to 1994 (%) - Asian
Year householder moved into unit - Moved in 1990 to 1994 (%) - Hispanic or Latino
Year householder moved into unit - Moved in 1990 to 1994 (%) - American Indian and Alaska Native
Year householder moved into unit - Moved in 1990 to 1994 (%) - Multirace
Year householder moved into unit - Moved in 1990 to 1994 (%) - Other Race
Year householder moved into unit - Moved in 1980 to 1989 (%)
Year householder moved into unit - Moved in 1980 to 1989 (%) - White
Year householder moved into unit - Moved in 1980 to 1989 (%) - Black or African American
Year householder moved into unit - Moved in 1980 to 1989 (%) - Asian
Year householder moved into unit - Moved in 1980 to 1989 (%) - Hispanic or Latino
Year householder moved into unit - Moved in 1980 to 1989 (%) - American Indian and Alaska Native
Year householder moved into unit - Moved in 1980 to 1989 (%) - Multirace
Year householder moved into unit - Moved in 1980 to 1989 (%) - Other Race
Year householder moved into unit - Moved in 1970 to 1979 (%)
Year householder moved into unit - Moved in 1970 to 1979 (%) - White
Year householder moved into unit - Moved in 1970 to 1979 (%) - Black or African American
Year householder moved into unit - Moved in 1970 to 1979 (%) - Asian
Year householder moved into unit - Moved in 1970 to 1979 (%) - Hispanic or Latino
Year householder moved into unit - Moved in 1970 to 1979 (%) - American Indian and Alaska Native
Year householder moved into unit - Moved in 1970 to 1979 (%) - Multirace
Year householder moved into unit - Moved in 1970 to 1979 (%) - Other Race
Year householder moved into unit - Moved in 1969 or earlier (%)
Year householder moved into unit - Moved in 1969 or earlier (%) - White
Year householder moved into unit - Moved in 1969 or earlier (%) - Black or African American
Year householder moved into unit - Moved in 1969 or earlier (%) - Asian
Year householder moved into unit - Moved in 1969 or earlier (%) - Hispanic or Latino
Year householder moved into unit - Moved in 1969 or earlier (%) - American Indian and Alaska Native
Year householder moved into unit - Moved in 1969 or earlier (%) - Multirace
Year householder moved into unit - Moved in 1969 or earlier (%) - Other Race
Housing units lacking complete plumbing facilities (%)
Housing units lacking complete kitchen facilities (%)
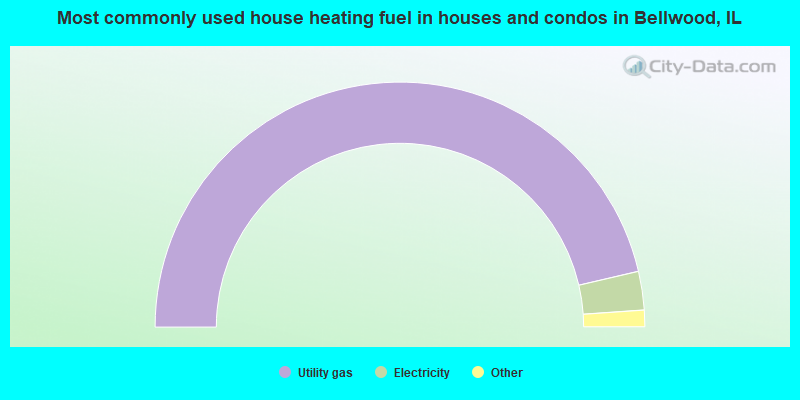
House heating fuel used in houses and condos - Utility gas (%)
House heating fuel used in houses and condos - Bottled, tank, or LP gas (%)
House heating fuel used in houses and condos - Electricity (%)
House heating fuel used in houses and condos - Fuel oil, kerosene, etc. (%)
House heating fuel used in houses and condos - Coal or coke (%)
House heating fuel used in houses and condos - Wood (%)
House heating fuel used in houses and condos - Solar energy (%)
House heating fuel used in houses and condos - Other fuel (%)
House heating fuel used in houses and condos - No fuel used (%)
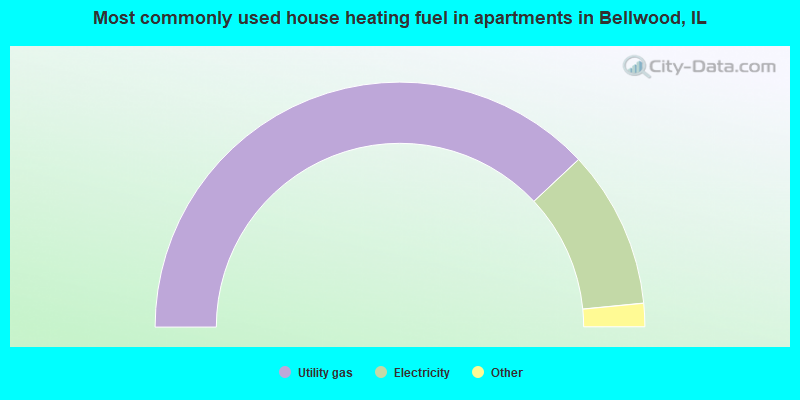
House heating fuel used in apartments - Utility gas (%)
House heating fuel used in apartments - Bottled, tank, or LP gas (%)
House heating fuel used in apartments - Electricity (%)
House heating fuel used in apartments - Fuel oil, kerosene, etc. (%)
House heating fuel used in apartments - Coal or coke (%)
House heating fuel used in apartments - Wood (%)
House heating fuel used in apartments - Solar energy (%)
House heating fuel used in apartments - Other fuel (%)
House heating fuel used in apartments - No fuel used (%)
Latest news about housing in Bellwood, IL collected exclusively by city-data.com from local newspapers, TV, and radio stations
Median year house/condo built: 1955Median year apartment built: 1955Household type by relationship:
Households: 18,197
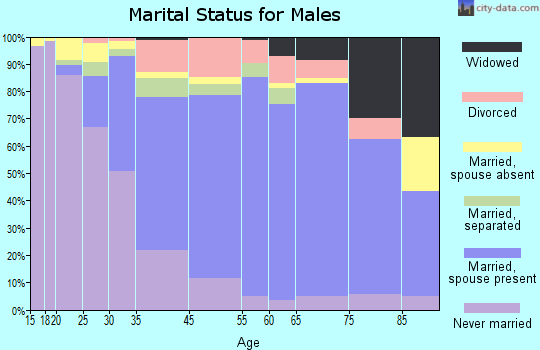
Male householders: 2,196 (622 living alone ), Female householders: 3,779 (922 living alone )2,314 spouses (2,270 opposite-sex spouses ), 240 unmarried partners , (240 opposite-sex unmarried partners ), 6,330 children (5,673 natural , 176 adopted , 481 stepchildren ), 1,237 grandchildren , 592 brothers or sisters , 339 parents , 49 foster children , 838 other relatives , 176 non-relatives In group quarters: 102
Size of family households: 1,654 2-persons , 1,001 3-persons , 766 4-persons , 522 5-persons , 269 6-persons , 151 7-or-more-persons .
Size of nonfamily households: 1,659 1-person , 145 2-persons .
1,530 married couples with children. single-parent households (130 men , 1,100 women ).
78.8% of residents of Bellwood speak English at home. of residents speak Spanish at home (61% speak English very well , 19% speak English well , 14% speak English not well , 6% don't speak English at all ).of residents speak other Indo-European language at home (65% speak English very well , 22% speak English well , 12% speak English not well ).of residents speak Asian or Pacific Island language at home (82% speak English very well , 18% speak English well ).of residents speak other language at home (100% speak English very well ).
Foreign born population: 1,750 (9.6%)of them are naturalized citizens )
Median number of rooms in houses and condos:
Median number of rooms in apartments
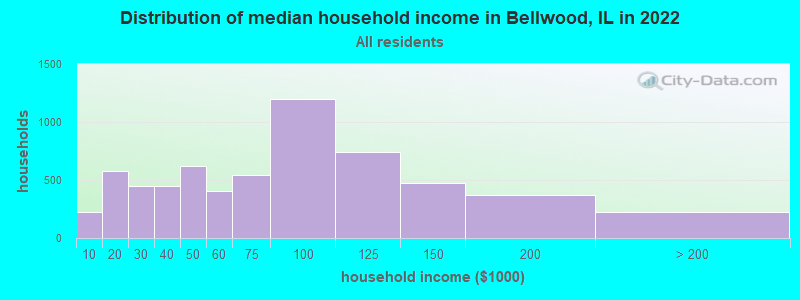
Bellwood, IL household income distribution 223 Less than $10,000577 $10,000 to $19,999450 $20,000 to $29,999444 $30,000 to $39,999620 $40,000 to $49,999405 $50,000 to $59,999547 $60,000 to $74,9991,194 $75,000 to $99,999740 $100,000 to $124,999477 $125,000 to $149,999372 $150,000 to $199,999222 $200,000 or more
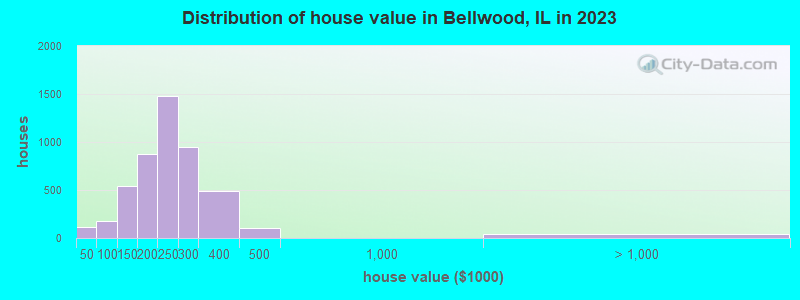
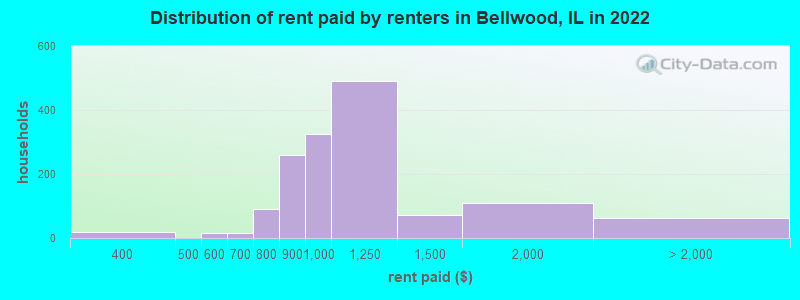
Home value of owner - occupied houses in 2022 in Bellwood, IL 60 Less than $10,00014 $10,000 to $14,9997 $15,000 to $19,99937 $20,000 to $24,99917 $25,000 to $29,99916 $40,000 to $49,99914 $50,000 to $59,99957 $60,000 to $69,99918 $80,000 to $89,99963 $90,000 to $99,999157 $100,000 to $124,999297 $125,000 to $149,999519 $150,000 to $174,999719 $175,000 to $199,9991,319 $200,000 to $249,999636 $250,000 to $299,999562 $300,000 to $399,99925 $400,000 to $499,99940 $1,000,000 to $1,499,999Rent paid by renters in 2022 in Bellwood, IL 17 $300 to $34915 $550 to $59914 $600 to $64936 $700 to $74955 $750 to $799259 $800 to $899324 $900 to $999491 $1,000 to $1,24972 $1,250 to $1,499107 $1,500 to $1,99963 No cash rent
Percentage of workers working in this county: 77.2%Number of people working at home: 875 (10.3% of all workers )
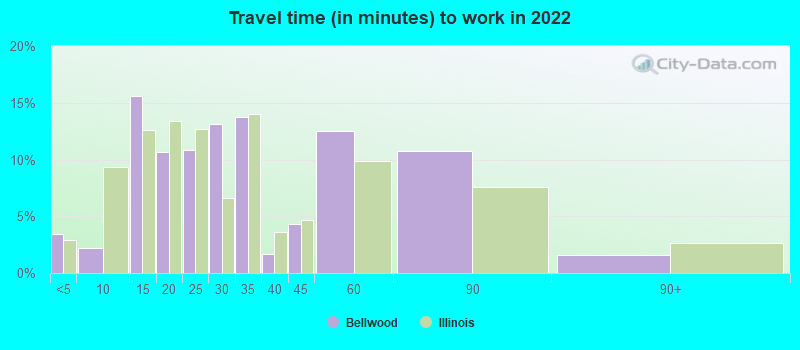
Travel time to work (commute)
Less than 5 minutes: 855 to 9 minutes: 40510 to 14 minutes: 88715 to 19 minutes: 1,04220 to 24 minutes: 1,14025 to 29 minutes: 33630 to 34 minutes: 1,69435 to 39 minutes: 10640 to 44 minutes: 39945 to 59 minutes: 50060 to 89 minutes: 73390 or more minutes: 79
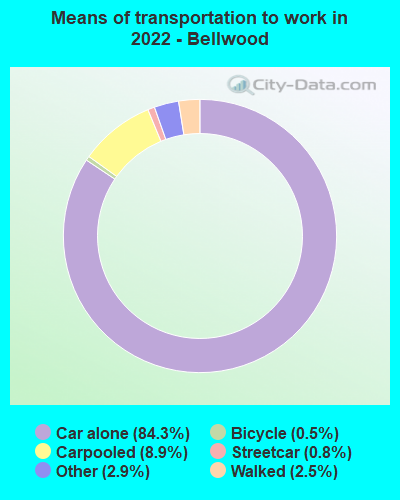
Means of transportation to work:
Drove a car alone: 3,442 (70.8%)Carpooled: 391 (8.0%)Bus : 1 (0.0%)Subway or elevated rail : 26 (0.5%)Taxi: 118 (2.4%)Bicycle: 23 (0.5%)Walked: 104 (2.1%)Worked at home: 875 (18.0%)
Unemployment by race in 2022
Unemployment rate for White non-Hispanic residents 12.1% Males7.0% FemalesUnemployment rate for Black residents 4.9% Males8.8% FemalesUnemployment rate for Asian residents 21.2% Males30.5% FemalesUnemployment rate for other race residents 1.8% Males4.5% FemalesUnemployment rate for two or more race residents 4.4% Males9.9% FemalesUnemployment rate for Hispanic or Latino residents 3.8% Males3.3% Females
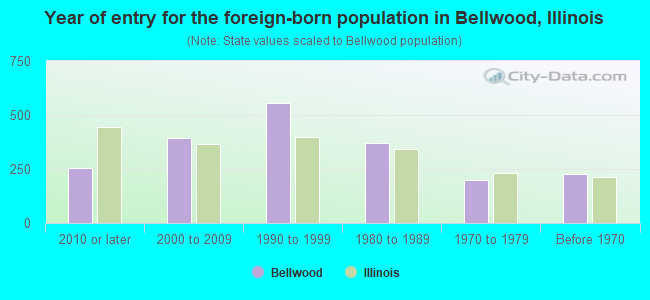
Year of entry for the foreign-born population in Bellwood, Illinois
254 2010 or later 392 2000 to 2009 556 1990 to 1999 372 1980 to 1989 197 1970 to 1979 226 Before 1970
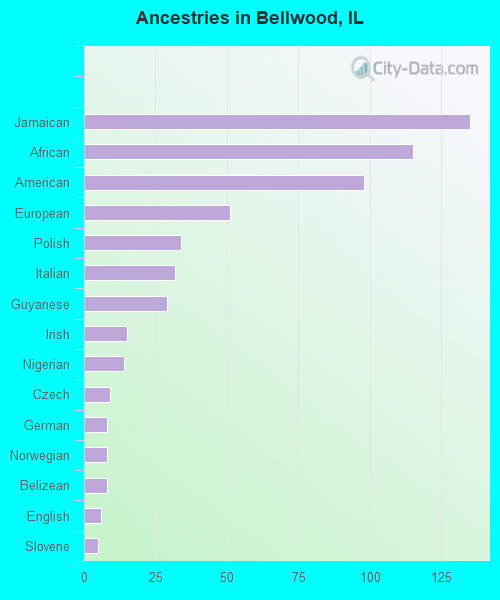
First ancestries reported:
Jamaican: 135 (1.1%)
African: 115 (0.9%)
American: 98 (0.8%)
European: 51 (0.4%)
Polish: 34 (0.3%)
Italian: 32 (0.3%)
Guyanese: 29 (0.2%)
Irish: 15 (0.1%)
Nigerian: 14 (0.1%)
Czech: 9 (0.07%)
German: 8 (0.07%)
Norwegian: 8 (0.07%)
Belizean: 8 (0.07%)
English: 6 (0.05%)
Slovene: 5 (0.04%)
Haitian: 1 (0.01%) Most common places of birth for foreign-born residents (%): Mexico Bellwood:
75.9% (1,328)Illinois:
34.7% (626,958)
India Bellwood:
4.1% (71)Illinois:
9.2% (166,409)
Senegal Bellwood:
4.1% (71)Illinois:
0.0% (893)
Bahamas Bellwood:
2.1% (36)Illinois:
0.0% (334)
Guatemala Bellwood:
1.9% (34)Illinois:
1.3% (22,793)
West Indies Bellwood:
1.7% (29)Illinois:
0.0% (114)
Place of birth for U.S.-born residents:
This state: 13,345Other state: 2,627Northeast: 46Midwest: 468South: 1,921West: 113 90.8% of Bellwood residents lived in the same house 1 years ago.
Out of people who lived in different houses, 48.0% lived in this county.
Out of people who lived in different counties, 87.7% lived in Illinois.
Bellwood:
90.8%State average:
88.3%
Education attainment for males 25 years and older:
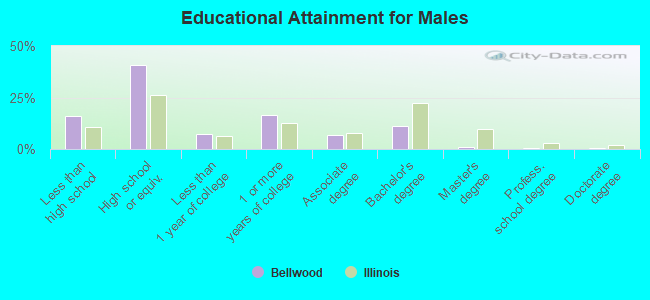
No schooling: 263Nursery to 4th grade: 155th and 6th grade: 747th and 8th grade: 99th grade: 5510th grade: 13911th grade: 5712th grade, no diploma: 287High school graduate (or equivalency): 2,266Less than 1 year of college: 399Some college more than 1 year, no degree: 927Associate degree: 374Bachelor's degree: 616Master's degree: 54Professional school degree: 26Doctorate degree: 15
Education attainment for females 25 years and older:
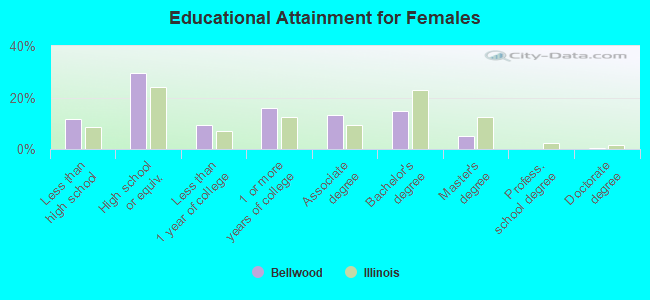
No schooling: 263Nursery to 4th grade: 65th and 6th grade: 1117th and 8th grade: 699th grade: 1810th grade: 6711th grade: 7212th grade, no diploma: 215High school graduate (or equivalency): 2,061Less than 1 year of college: 657Some college more than 1 year, no degree: 1,123Associate degree: 929Bachelor's degree: 1,022Master's degree: 346Professional school degree: 6Doctorate degree: 17
Housing units in structures:
One, detached: 4,839One, attached: 242Two: 3413 or 4: 4595 to 9: 24310 to 19: 17320 to 49: 8150 or more: 48Mobile homes: 69Housing units lacking complete plumbing facilities in 2022: 1.7%Housing units lacking complete kitchen facilities in 2022: 3.1%House/condo owner moved in on average 16 years ago
Renter moved in on average 6 years ago
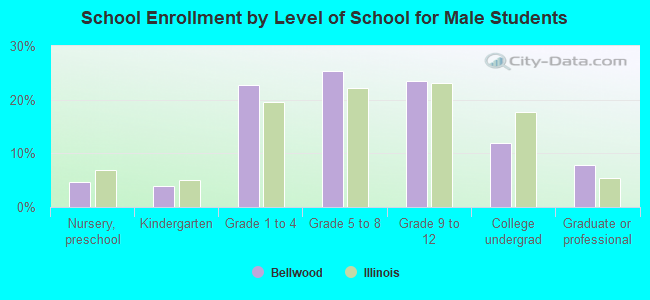
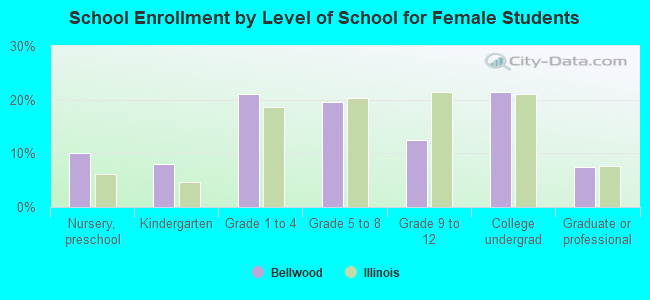
Private vs. public school enrollment:
Students in private schools in grades 1 to 8 (elementary and middle school): 202 Students in private schools in grades 9 to 12 (high school): 93 Students in private undergraduate colleges: 325