Races in Bellwood, Illinois (IL) Detailed Stats
Data:
Races - White alone (%)
Races - White alone (% change since 2000)
Races - Black alone (%)
Races - Black alone (% change since 2000)
Races - American Indian alone (%)
Races - American Indian alone (% change since 2000)
Races - Asian alone (%)
Races - Asian alone (% change since 2000)
Races - Hispanic (%)
Races - Hispanic (% change since 2000)
Races - Native Hawaiian and Other Pacific Islander alone (%)
Races - Native Hawaiian and Other Pacific Islander alone (% change since 2000)
Races - Two or more races(%)
Races - Two or more races(% change since 2000)
Races - Other race alone (%)
Races - Other race alone (% change since 2000)
Racial diversity
Place of birth - Born in state of residence (%)
Place of birth - Born in state of residence (%) - White
Place of birth - Born in state of residence (%) - Black or African American
Place of birth - Born in state of residence (%) - Asian
Place of birth - Born in state of residence (%) - Hispanic or Latino
Place of birth - Born in state of residence (%) - American Indian and Alaska Native
Place of birth - Born in state of residence (%) - Multirace
Place of birth - Born in state of residence (%) - Other Race
Place of birth - Born in other state (%)
Place of birth - Born in other state (%) - White
Place of birth - Born in other state (%) - Black or African American
Place of birth - Born in other state (%) - Asian
Place of birth - Born in other state (%) - Hispanic or Latino
Place of birth - Born in other state (%) - American Indian and Alaska Native
Place of birth - Born in other state (%) - Multirace
Place of birth - Born in other state (%) - Other Race
Place of birth - Native, outside of US (%)
Place of birth - Native, outside of US (%) - White
Place of birth - Native, outside of US (%) - Black or African American
Place of birth - Native, outside of US (%) - Asian
Place of birth - Native, outside of US (%) - Hispanic or Latino
Place of birth - Native, outside of US (%) - American Indian and Alaska Native
Place of birth - Native, outside of US (%) - Multirace
Place of birth - Native, outside of US (%) - Other Race
Place of birth - Foreign born (%)
Place of birth - Foreign born (%) - White
Place of birth - Foreign born (%) - Black or African American
Place of birth - Foreign born (%) - Asian
Place of birth - Foreign born (%) - Hispanic or Latino
Place of birth - Foreign born (%) - American Indian and Alaska Native
Place of birth - Foreign born (%) - Multirace
Place of birth - Foreign born (%) - Other Race
Residents speaking English at home (%)
Residents speaking English at home - Born in the United States (%)
Residents speaking English at home - Native, born elsewhere (%)
Residents speaking English at home - Foreign born (%)
Residents speaking Spanish at home (%)
Residents speaking Spanish at home - Born in the United States (%)
Residents speaking Spanish at home - Native, born elsewhere (%)
Residents speaking Spanish at home - Foreign born (%)
Residents speaking other language at home (%)
Residents speaking other language at home - Born in the United States (%)
Residents speaking other language at home - Native, born elsewhere (%)
Residents speaking other language at home - Foreign born (%)
Marital status - Never married (%)
Marital status - Now married (%)
Marital status - Separated (%)
Marital status - Widowed (%)
Marital status - Divorced (%)
Ancestries Reported - Arab (%)
Ancestries Reported - Czech (%)
Ancestries Reported - Danish (%)
Ancestries Reported - Dutch (%)
Ancestries Reported - English (%)
Ancestries Reported - French (%)
Ancestries Reported - French Canadian (%)
Ancestries Reported - German (%)
Ancestries Reported - Greek (%)
Ancestries Reported - Hungarian (%)
Ancestries Reported - Irish (%)
Ancestries Reported - Italian (%)
Ancestries Reported - Lithuanian (%)
Ancestries Reported - Norwegian (%)
Ancestries Reported - Polish (%)
Ancestries Reported - Portuguese (%)
Ancestries Reported - Russian (%)
Ancestries Reported - Scotch-Irish (%)
Ancestries Reported - Scottish (%)
Ancestries Reported - Slovak (%)
Ancestries Reported - Subsaharan African (%)
Ancestries Reported - Swedish (%)
Ancestries Reported - Swiss (%)
Ancestries Reported - Ukrainian (%)
Ancestries Reported - United States (%)
Ancestries Reported - Welsh (%)
Ancestries Reported - West Indian (%)
Ancestries Reported - Other (%)
Geographical mobility - Same house 1 year ago (%)
Geographical mobility - Same house 1 year ago (%) - White
Geographical mobility - Same house 1 year ago (%) - Black or African American
Geographical mobility - Same house 1 year ago (%) - Asian
Geographical mobility - Same house 1 year ago (%) - Hispanic or Latino
Geographical mobility - Same house 1 year ago (%) - American Indian and Alaska Native
Geographical mobility - Same house 1 year ago (%) - Multirace
Geographical mobility - Same house 1 year ago (%) - Other Race
Geographical mobility - Moved within same county (%)
Geographical mobility - Moved within same county (%) - White
Geographical mobility - Moved within same county (%) - Black or African American
Geographical mobility - Moved within same county (%) - Asian
Geographical mobility - Moved within same county (%) - Hispanic or Latino
Geographical mobility - Moved within same county (%) - American Indian and Alaska Native
Geographical mobility - Moved within same county (%) - Multirace
Geographical mobility - Moved within same county (%) - Other Race
Geographical mobility - Moved from different county within same state (%)
Geographical mobility - Moved from different county within same state (%) - White
Geographical mobility - Moved from different county within same state (%) - Black or African American
Geographical mobility - Moved from different county within same state (%) - Asian
Geographical mobility - Moved from different county within same state (%) - Hispanic or Latino
Geographical mobility - Moved from different county within same state (%) - American Indian and Alaska Native
Geographical mobility - Moved from different county within same state (%) - Multirace
Geographical mobility - Moved from different county within same state (%) - Other Race
Geographical mobility - Moved from different state (%)
Geographical mobility - Moved from different state (%) - White
Geographical mobility - Moved from different state (%) - Black or African American
Geographical mobility - Moved from different state (%) - Asian
Geographical mobility - Moved from different state (%) - Hispanic or Latino
Geographical mobility - Moved from different state (%) - American Indian and Alaska Native
Geographical mobility - Moved from different state (%) - Multirace
Geographical mobility - Moved from different state (%) - Other Race
Geographical mobility - Moved from abroad (%)
Geographical mobility - Moved from abroad (%) - White
Geographical mobility - Moved from abroad (%) - Black or African American
Geographical mobility - Moved from abroad (%) - Asian
Geographical mobility - Moved from abroad (%) - Hispanic or Latino
Geographical mobility - Moved from abroad (%) - American Indian and Alaska Native
Geographical mobility - Moved from abroad (%) - Multirace
Geographical mobility - Moved from abroad (%) - Other Race
Place of birth for the foreign-born population - Ireland (%)
Place of birth for the foreign-born population - Denmark (%)
Place of birth for the foreign-born population - Norway (%)
Place of birth for the foreign-born population - Sweden (%)
Place of birth for the foreign-born population - United Kingdom (%)
Place of birth for the foreign-born population - England (%)
Place of birth for the foreign-born population - Scotland (%)
Place of birth for the foreign-born population - Other Northern Europe (%)
Place of birth for the foreign-born population - Austria (%)
Place of birth for the foreign-born population - Belgium (%)
Place of birth for the foreign-born population - France (%)
Place of birth for the foreign-born population - Germany (%)
Place of birth for the foreign-born population - Netherlands (%)
Place of birth for the foreign-born population - Switzerland (%)
Place of birth for the foreign-born population - Other Western Europe (%)
Place of birth for the foreign-born population - Greece (%)
Place of birth for the foreign-born population - Italy (%)
Place of birth for the foreign-born population - Portugal (%)
Place of birth for the foreign-born population - Spain (%)
Place of birth for the foreign-born population - Other Southern Europe (%)
Place of birth for the foreign-born population - Albania (%)
Place of birth for the foreign-born population - Belarus (%)
Place of birth for the foreign-born population - Bosnia and Herzegovina (%)
Place of birth for the foreign-born population - Bulgaria (%)
Place of birth for the foreign-born population - Croatia (%)
Place of birth for the foreign-born population - Czechoslovakia (%)
Place of birth for the foreign-born population - Hungary (%)
Place of birth for the foreign-born population - Latvia (%)
Place of birth for the foreign-born population - Lithuania (%)
Place of birth for the foreign-born population - North Macedonia (Macedonia) (%)
Place of birth for the foreign-born population - Moldova (%)
Place of birth for the foreign-born population - Poland (%)
Place of birth for the foreign-born population - Romania (%)
Place of birth for the foreign-born population - Russia (%)
Place of birth for the foreign-born population - Serbia (%)
Place of birth for the foreign-born population - Ukraine (%)
Place of birth for the foreign-born population - Other Eastern Europe (%)
Place of birth for the foreign-born population - China (%)
Place of birth for the foreign-born population - Hong Kong (%)
Place of birth for the foreign-born population - Taiwan (%)
Place of birth for the foreign-born population - Japan (%)
Place of birth for the foreign-born population - Korea (%)
Place of birth for the foreign-born population - Other Eastern Asia (%)
Place of birth for the foreign-born population - Afghanistan (%)
Place of birth for the foreign-born population - Bangladesh (%)
Place of birth for the foreign-born population - India (%)
Place of birth for the foreign-born population - Iran (%)
Place of birth for the foreign-born population - Kazakhstan (%)
Place of birth for the foreign-born population - Nepal (%)
Place of birth for the foreign-born population - Pakistan (%)
Place of birth for the foreign-born population - Sri Lanka (%)
Place of birth for the foreign-born population - Uzbekistan (%)
Place of birth for the foreign-born population - Other South Central Asia (%)
Place of birth for the foreign-born population - Burma (%)
Place of birth for the foreign-born population - Cambodia (%)
Place of birth for the foreign-born population - Indonesia (%)
Place of birth for the foreign-born population - Laos (%)
Place of birth for the foreign-born population - Malaysia (%)
Place of birth for the foreign-born population - Philippines (%)
Place of birth for the foreign-born population - Singapore (%)
Place of birth for the foreign-born population - Thailand (%)
Place of birth for the foreign-born population - Vietnam (%)
Place of birth for the foreign-born population - Other South Eastern Asia (%)
Place of birth for the foreign-born population - Armenia (%)
Place of birth for the foreign-born population - Iraq (%)
Place of birth for the foreign-born population - Israel (%)
Place of birth for the foreign-born population - Jordan (%)
Place of birth for the foreign-born population - Kuwait (%)
Place of birth for the foreign-born population - Lebanon (%)
Place of birth for the foreign-born population - Saudi Arabia (%)
Place of birth for the foreign-born population - Syria (%)
Place of birth for the foreign-born population - Turkey (%)
Place of birth for the foreign-born population - Yemen (%)
Place of birth for the foreign-born population - Other Western Asia (%)
Place of birth for the foreign-born population - Eritrea (%)
Place of birth for the foreign-born population - Ethiopia (%)
Place of birth for the foreign-born population - Kenya (%)
Place of birth for the foreign-born population - Somalia (%)
Place of birth for the foreign-born population - Uganda (%)
Place of birth for the foreign-born population - Zimbabwe (%)
Place of birth for the foreign-born population - Other Eastern Africa (%)
Place of birth for the foreign-born population - Cameroon (%)
Place of birth for the foreign-born population - Congo (%)
Place of birth for the foreign-born population - Democratic Republic of Congo (Zaire) (%)
Place of birth for the foreign-born population - Other Middle Africa (%)
Place of birth for the foreign-born population - Egypt (%)
Place of birth for the foreign-born population - Morocco (%)
Place of birth for the foreign-born population - Sudan (%)
Place of birth for the foreign-born population - Other Northern Africa (%)
Place of birth for the foreign-born population - South Africa (%)
Place of birth for the foreign-born population - Other Southern Africa (%)
Place of birth for the foreign-born population - Cabo Verde (%)
Place of birth for the foreign-born population - Ghana (%)
Place of birth for the foreign-born population - Liberia (%)
Place of birth for the foreign-born population - Nigeria (%)
Place of birth for the foreign-born population - Senegal (%)
Place of birth for the foreign-born population - Sierra Leone (%)
Place of birth for the foreign-born population - Other Western Africa (%)
Place of birth for the foreign-born population - Australia (%)
Place of birth for the foreign-born population - New Zealand (%)
Place of birth for the foreign-born population - Fiji (%)
Place of birth for the foreign-born population - Micronesia (%)
Place of birth for the foreign-born population - Bahamas (%)
Place of birth for the foreign-born population - Barbados (%)
Place of birth for the foreign-born population - Cuba (%)
Place of birth for the foreign-born population - Dominica (%)
Place of birth for the foreign-born population - Dominican Republic (%)
Place of birth for the foreign-born population - Grenada (%)
Place of birth for the foreign-born population - Haiti (%)
Place of birth for the foreign-born population - Jamaica (%)
Place of birth for the foreign-born population - St. Vincent and the Grenadines (%)
Place of birth for the foreign-born population - Trinidad and Tobago (%)
Place of birth for the foreign-born population - West Indies (%)
Place of birth for the foreign-born population - Other Caribbean (%)
Place of birth for the foreign-born population - Belize (%)
Place of birth for the foreign-born population - Costa Rica (%)
Place of birth for the foreign-born population - El Salvador (%)
Place of birth for the foreign-born population - Guatemala (%)
Place of birth for the foreign-born population - Honduras (%)
Place of birth for the foreign-born population - Mexico (%)
Place of birth for the foreign-born population - Nicaragua (%)
Place of birth for the foreign-born population - Panama (%)
Place of birth for the foreign-born population - Other Central America (%)
Place of birth for the foreign-born population - Argentina (%)
Place of birth for the foreign-born population - Bolivia (%)
Place of birth for the foreign-born population - Brazil (%)
Place of birth for the foreign-born population - Chile (%)
Place of birth for the foreign-born population - Colombia (%)
Place of birth for the foreign-born population - Ecuador (%)
Place of birth for the foreign-born population - Guyana (%)
Place of birth for the foreign-born population - Peru (%)
Place of birth for the foreign-born population - Uruguay (%)
Place of birth for the foreign-born population - Venezuela (%)
Place of birth for the foreign-born population - Other South America (%)
Place of birth for the foreign-born population - Canada (%)
Place of birth for the foreign-born population - Other Northern America (%)
Place of birth for the foreign-born population - Other (%)
Latest news about races in Bellwood, IL collected exclusively by city-data.com from local newspapers, TV, and radio stations
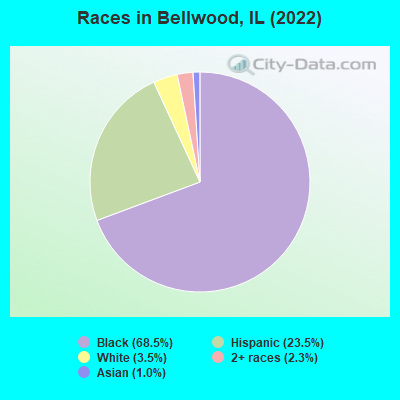
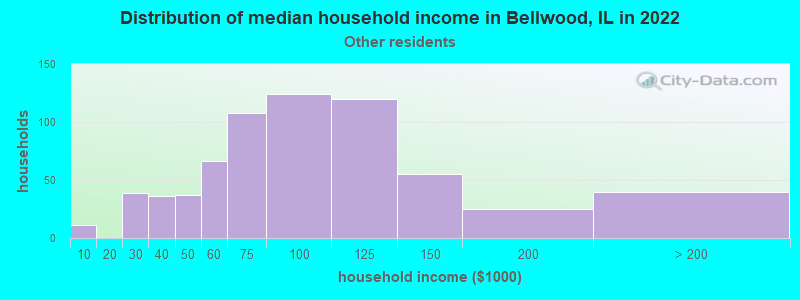
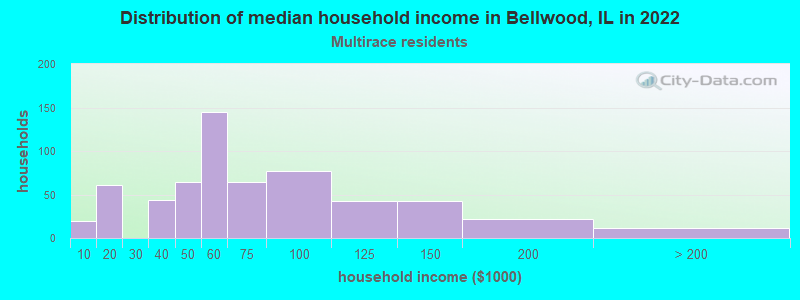
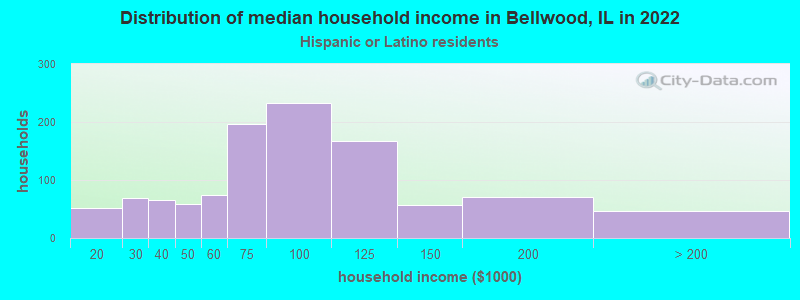
According to 2022 data, the most numerous races in Bellwood, IL are White alone (644 residents), Hispanic (4,276 residents), and Black alone (12,470 residents). 78.7% of Bellwood residents speak English at home. 9.6% of Bellwood, IL residents are foreign-born (8.1% born in Latin America), which is 45.6% less than the foreign-born rate of 14.0% across the entire state of Illinois.
Race distribution in Bellwood
2000 2022
8,424,140 67.8% White alone 1,856,152 14.9% Black alone 1,530,262 12.3% Hispanic 419,916 3.4% Asian alone 153,996 1.2% Two or more races 13,479 0.1% Other race alone 18,232 0.1% American Indian alone 3,116 0.03% Native Hawaiian and Other
7,356,301 58.5% White alone 2,299,726 18.3% Hispanic 1,660,423 13.2% Black alone 747,296 5.9% Asian alone 458,599 3.6% Two or more races 45,386 0.4% Other race alone 10,405 0.08% American Indian alone 3,896 0.03% Native Hawaiian and Other
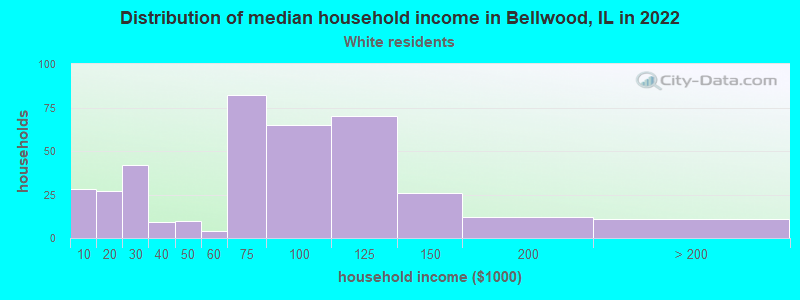
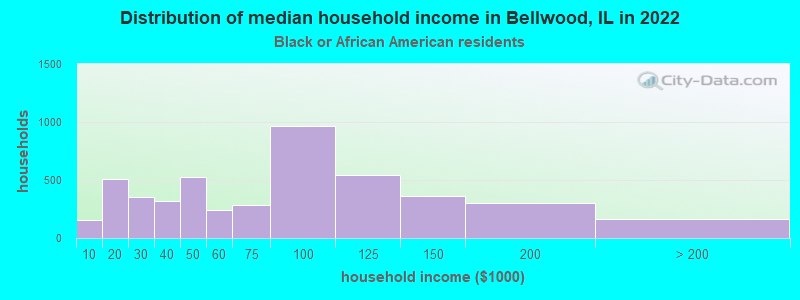
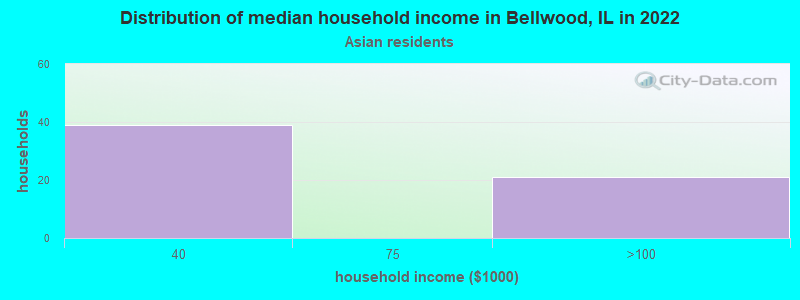
Income and house value in Bellwood Median household income in 2022 $64,199 White non-Hispanic householders$71,485 Black householders$90,595 Some other race householders$52,426 Two or more races householders$82,458 Hispanic or Latino race householdersMedian 2022 house value $193,937 White Non-Hispanic householders$217,633 Black or African American householders$205,056 American Indian or Alaska Native householders $205,056 Asian householders$212,165 Some other race householders$186,464 Two or more races householders$197,036 Hispanic or Latino householders
Median age by race in Bellwood
33.6 Median age for White residents34.6 32.3 39.9 Median age for Black or African American residents35.0 42.6 -680,473,372.1 Median age for American Indian / Alaska Native residents-736,736,736.0 -641,399,416.3 52.0 Median age for Asian residents48.4 52.0 -687,999,999.3 Median age for Native Hawaiian / Pacific Islander residents-918,721,460.3 -610,229,276.3 32.1 Median age for Other race residents36.0 29.4 29.8 Median age for Two or more races residents20.6 32.5 55.6 Median age for White alone residents51.9 58.6 28.3 Median age for Hispanic or Latino residents31.0 27.4
Owner/renter occupied households by race in Bellwood
House owners and renters - White residents 355 92.9% Owner occupied27 7.1% Renter occupiedHouse owners and renters - Black or African American residents 3,552 74.9% Owner occupied1,188 25.1% Renter occupiedHouse owners and renters - American Indian / Alaska Native residents 28 100.0% Owner occupiedHouse owners and renters - Asian residents 49 85.0% Owner occupied9 15.0% Renter occupiedHouse owners and renters - Other race residents 613 89.9% Owner occupied69 10.1% Renter occupiedHouse owners and renters - Two or more races residents 394 66.9% Owner occupied195 33.1% Renter occupiedHouse owners and renters - White alone residents 238 96.3% Owner occupied9 3.7% Renter occupiedHouse owners and renters - Hispanic or Latino residents 956 87.0% Owner occupied143 13.0% Renter occupied
Language usage in Bellwood
English speakers - Total 78.7% of residents of Bellwood speak English at home.
19.6% of residents speak Spanish at home 2,036 61.4% Speak English very well1,281 38.6% Speak English less than very well1.1% of residents speak other language at home 140 74.9% Speak English very well47 25.1% Speak English less than very well
English speakers - Born in the United States 97.0% of residents of Bellwood speak English at home.
2.8% of residents speak Spanish at home 12 16.4% Speak English very well61 83.6% Speak English less than very well
English speakers - Native, born elsewhere 35.4% of residents of Bellwood speak English at home.
62.8% of residents speak Spanish at home 101 40.1% Speak English very well151 59.9% Speak English less than very well
English speakers - Foreign-born 15.5% of residents of Bellwood speak English at home.
76.6% of residents speak Spanish at home 576 43.2% Speak English very well758 56.8% Speak English less than very well7.8% of residents speak other language at home 88 65.2% Speak English very well47 34.8% Speak English less than very well
White (Caucasian) - Speak only English Native:
64.1% (626)Foreign-born:
5.5% (8)
White (Caucasian) - Speak another language Native:
28.7% (281)Foreign-born:
93.9% (138)
Black or African American - Speak only English Native:
98.4% (11,621)Foreign-born:
100.0% (197)
Black or African American - Speak another language Native:
1.6% (190)Foreign-born:
6.4% (13)
Asian - Speak only English Native:
31.0% (18)Foreign-born:
5.0% (6)
Asian - Speak another language Native:
68.8% (40)Foreign-born:
95.9% (121)
Other race - Speak only English Native:
17.5% (231)Foreign-born:
4.7% (50)
Other race - Speak another language Native:
81.9% (1,079)Foreign-born:
95.3% (1,023)
Two or more races - Speak only English Native:
45.0% (530)Foreign-born:
9.3% (40)
Two or more races - Speak another language Native:
55.8% (657)Foreign-born:
90.7% (394)
Hispanic or Latino - Speak only English Native:
23.9% (575)Foreign-born:
4.6% (64)
Hispanic or Latino - Speak another language Native:
75.6% (1,820)Foreign-born:
95.4% (1,337)
Foreign-born residents in Bellwood 1,750 residents are foreign born (8.1% Latin America ).
This city:
9.6%Illinois:
14.1%
Marital status for residents in Bellwood Marital status - White (Caucasian) population 15 years and over
Males 32.4% Never married54.8% Now married0.2% Separated5.6% Widowed7.0% DivorcedFemales 39.1% Never married42.5% Now married0.0% Separated4.8% Widowed13.6% DivorcedWomen who gave birth in the past 12 months Now married:
64.0% (14)Unmarried:
36.0% (8)
Women who did not give birth in the past 12 months Now married:
59.3% (132)Unmarried:
40.7% (91)
Marital status - Black or African American population 15 years and over
Males 47.0% Never married38.6% Now married2.5% Separated2.5% Widowed9.4% DivorcedFemales 40.7% Never married30.1% Now married1.8% Separated11.8% Widowed15.6% DivorcedWomen who gave birth in the past 12 months Now married:
51.1% (113)Unmarried:
48.9% (109)
Women who did not give birth in the past 12 months Now married:
23.2% (618)Unmarried:
76.8% (2,039)
Marital status - Asian population 15 years and over
Males 39.1% Never married48.9% Now married0.0% Separated0.0% Widowed12.0% DivorcedFemales 25.6% Never married74.4% Now married0.0% Separated0.0% Widowed0.0% DivorcedWomen who did not give birth in the past 12 months Now married:
63.0% (29)Unmarried:
37.0% (17)
Marital status - Other race population 15 years and over
Males 34.1% Never married57.0% Now married0.0% Separated0.0% Widowed8.9% DivorcedFemales 32.4% Never married51.5% Now married2.6% Separated4.3% Widowed9.2% DivorcedWomen who gave birth in the past 12 months Now married:
100.0% (25)Unmarried:
0.0% (0)
Women who did not give birth in the past 12 months Now married:
51.7% (369)Unmarried:
48.3% (344)
Marital status - Two or more races population 15 years and over
Males 41.2% Never married43.6% Now married0.0% Separated2.9% Widowed12.4% DivorcedFemales 51.7% Never married36.9% Now married0.0% Separated2.0% Widowed9.4% DivorcedWomen who gave birth in the past 12 months Now married:
78.2% (60)Unmarried:
21.8% (17)
Women who did not give birth in the past 12 months Now married:
28.7% (136)Unmarried:
71.3% (337)
Marital status - White alone, not Hispanic / Latino population 15 years and over
Males 28.1% Never married51.0% Now married0.3% Separated10.1% Widowed10.4% DivorcedFemales 43.2% Never married36.6% Now married0.0% Separated8.5% Widowed11.7% DivorcedWomen who did not give birth in the past 12 months Now married:
61.1% (55)Unmarried:
38.9% (35)
Marital status - Hispanic or Latino population 15 years and over
Males 33.3% Never married55.9% Now married0.0% Separated0.0% Widowed10.8% DivorcedFemales 33.7% Never married52.8% Now married1.6% Separated2.7% Widowed9.2% DivorcedWomen who gave birth in the past 12 months Now married:
79.4% (81)Unmarried:
20.6% (21)
Women who did not give birth in the past 12 months Now married:
52.8% (529)Unmarried:
47.2% (472)
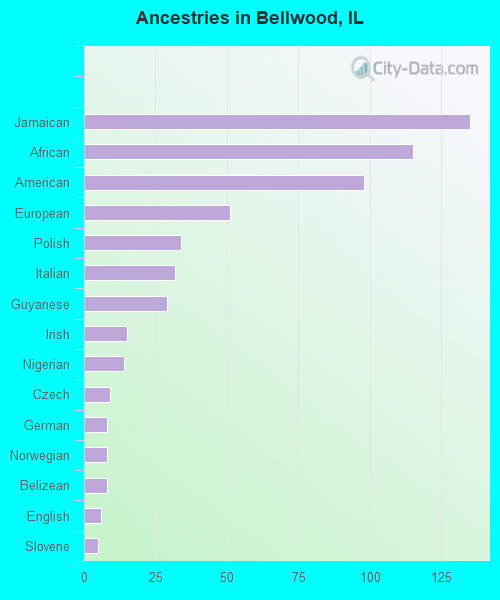
Ancestries in Bellwood
135 1.1% Jamaican115 0.9% African98 0.8% American51 0.4% European34 0.3% Polish32 0.3% Italian29 0.2% Guyanese15 0.1% Irish14 0.1% Nigerian9 0.07% Czech8 0.07% German8 0.07% Norwegian8 0.07% Belizean6 0.05% English5 0.04% Slovene1 0.01% Haitian
Children Nativity (place of birth) in Bellwood
Children under 6 years - Living with two parents Both parents native 328 100.0% NativeBoth parents foreign-born 83 100.0% NativeOne native, one foreign-born parent 263 100.0% NativeChildren under 6 years - Living with one parent Native parent 724 100.0% NativeForeign-born parent 17 100.0% Foreign-bornChildren 6 to 17 years - Living with two parents Both parents native 627 100.0% NativeBoth parents foreign-born 309 92.9% Native24 7.1% Foreign-bornOne native, one foreign-born parent 210 100.0% NativeChildren 6 to 17 years - Living with one parent Native parent 1,223 100.0% NativeForeign-born parent 81 54.6% Native67 45.4% Foreign-born
Grandparents responsible for own grandchildren in Bellwood
Grandparents (30 to 59 years) White / Caucasian 11 33.2% Responsible for grandchildren21 66.8% Not responsible for grandchildrenBlack or African American 63 18.1% Responsible for grandchildren284 81.9% Not responsible for grandchildrenOther race 8 6.6% Responsible for grandchildren111 93.4% Not responsible for grandchildrenWhite alone, not Hispanic / Latino 10 100.0% Not responsible for grandchildrenHispanic or Latino 23 17.8% Responsible for grandchildren105 82.2% Not responsible for grandchildrenGrandparents (60 years and over) White / Caucasian 11 22.6% Responsible for grandchildren36 77.4% Not responsible for grandchildrenBlack or African American 36 14.7% Responsible for grandchildren206 85.3% Not responsible for grandchildrenOther race 3 100.0% Responsible for grandchildrenWhite alone, not Hispanic / Latino 13 43.7% Responsible for grandchildren17 56.3% Not responsible for grandchildrenHispanic or Latino 4 8.7% Responsible for grandchildren40 91.3% Not responsible for grandchildren