Altoona, PA (Pennsylvania) Houses and Residents
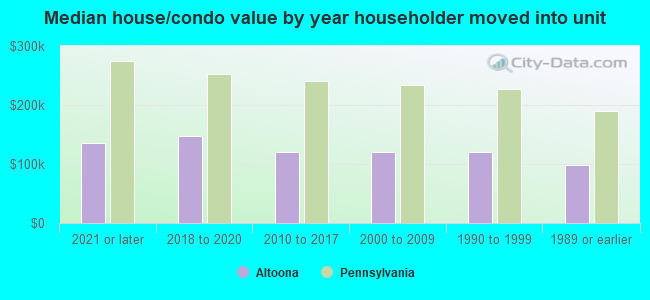
| Altoona: | $117,892 |
| Pennsylvania: | $245,500 |
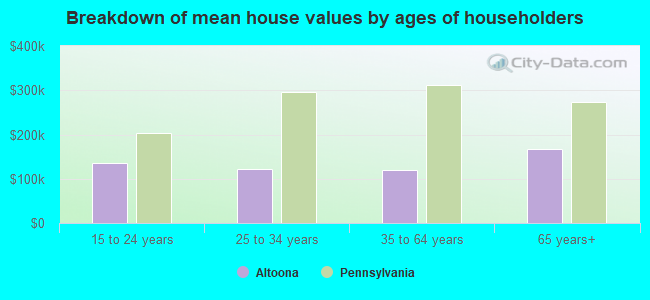
Mean price in 2022:
Detached houses: $158,490
Here: $158,490 State: $317,202 Townhouses or other attached units: $172,900
Here: $172,900 State: $254,369 In 2-unit structures: $72,403
Here: $72,403 State: $249,182 In 3-to-4-unit structures: $51,139
Here: $51,139 State: $297,446 In 5-or-more-unit structures: $296,588
Here: $296,588 State: $320,068 Mobile homes: $81,461
Here: $81,461 State: $92,414
Total population: 45,558 (All urban)
Houses: 20,871 (18,437 occupied: 12,455 owner occupied, 6,571 renter occupied)
| % of renters here: | 35% |
| State: | 31% |
Housing density: 2,137 houses/condos per square mile
Median price asked for vacant for-sale houses and condos in 2022: $142,069.
Median contract rent in 2022: $615 (lower quartile is $452, upper quartile is $725)
Median rent asked for vacant for-rent units in 2022: $577
Median gross rent in Altoona, PA in 2022: $755
Housing units in Altoona with a mortgage: 7,057 (739 second mortgage, 82 home equity loan, 641 both second mortgage and home equity loan)
Houses without a mortgage: 412
Median household income for houses/condos with a mortgage: $76,181
Median household income for apartments without a mortgage: $52,044
Median monthly housing costs: $729
Compare current foreclosures in Altoona, PA:
| Photo | Address | Area | Beds / Baths | Price | Details |
|---|---|---|---|---|---|

|
#1
Vicars Ln
Altoona, PA 16601
|
3,019 sq. feet
|
2 baths 4 beds |
$549,900
|
show details |

|
#2
Old Mill Run Rd
Altoona, PA 16601
|
1,408 sq. feet
|
1 baths 2 beds |
$151,900
|
show details |

|
#3
Avalon Rd
Altoona, PA 16601
|
1,962 sq. feet
|
2 baths 3 beds |
$42,500
|
show details |

|
#4
N 2nd St
Altoona, PA 16601
|
- sq. feet
|
2 baths 4 beds |
show details | |

|
#5
Bell Ave
Altoona, PA 16602
|
1,816 sq. feet
|
1 baths 3 beds |
show details | |

|
#6
11th St
Altoona, PA 16601
|
1,995 sq. feet
|
2 baths 3 beds |
show details | |

|
#7
11 16th Avenue
Altoona, PA 16601
|
- sq. feet
|
- baths - beds |
$39,900
|
show details |

|
#8
Baynton Ave
Altoona, PA 16602
|
- sq. feet
|
2 baths 3 beds |
show details | |

|
#9
3rd Ave
Altoona, PA 16602
|
- sq. feet
|
- baths - beds |
$14,900
|
show details |

|
#10
18th Ave
Altoona, PA 16601
|
- sq. feet
|
1 baths 3 beds |
show details |
| Photo | Address | Area | Beds / Baths | Price | Details |
|---|---|---|---|---|---|

|
#11
2nd Ave
Altoona, PA 16602
|
1,330 sq. feet
|
1 baths 4 beds |
show details | |

|
#12
Walnut Ave
Altoona, PA 16601
|
- sq. feet
|
1 baths 2 beds |
show details | |

|
#13
Broad Ave
Altoona, PA 16601
|
- sq. feet
|
2 baths 5 beds |
show details | |

|
#14
Walnut Ave
Altoona, PA 16601
|
- sq. feet
|
1 baths 3 beds |
show details | |

|
#15
11th Ave
Altoona, PA 16601
|
- sq. feet
|
1 baths 3 beds |
show details | |

|
#16
N 12th Ave
Altoona, PA 16601
|
- sq. feet
|
1 baths 4 beds |
show details | |

|
#17
N 6th Ave
Altoona, PA 16601
|
- sq. feet
|
1 baths 2 beds |
show details | |

|
#18
22nd Ave
Altoona, PA 16601
|
- sq. feet
|
2 baths 4 beds |
show details | |

|
#19
Woodland Ave
Altoona, PA 16601
|
- sq. feet
|
- baths - beds |
show details | |

|
#20
Stewart St
Altoona, PA 16602
|
- sq. feet
|
- baths - beds |
show details |
| Photo | Address | Area | Beds / Baths | Price | Details |
|---|---|---|---|---|---|

|
#21
Broadway
Altoona, PA 16601
|
- sq. feet
|
- baths - beds |
show details | |

|
#22
E Caroline Ave Apt 14
Altoona, PA 16602
|
- sq. feet
|
- baths - beds |
show details | |

|
#23
N 9th Ave
Altoona, PA 16601
|
- sq. feet
|
- baths - beds |
show details | |

|
#24
E Caroline Ave
Altoona, PA 16602
|
- sq. feet
|
- baths - beds |
show details | |

|
#25
Walton Ave
Altoona, PA 16602
|
- sq. feet
|
- baths - beds |
show details | |

|
#26
E Walton Ave Apt 304
Altoona, PA 16602
|
- sq. feet
|
- baths - beds |
show details | |

|
#27
Dysart Ave # 3
Altoona, PA 16602
|
- sq. feet
|
- baths - beds |
show details | |

|
#28
4th Ave
Altoona, PA 16602
|
1,013 sq. feet
|
- baths - beds |
show details | |

|
#29
4th Ave
Altoona, PA 16602
|
- sq. feet
|
- baths - beds |
show details | |

|
#30
3rd Ave
Altoona, PA 16602
|
- sq. feet
|
- baths - beds |
show details |
| Photo | Address | Area | Beds / Baths | Price | Details |
|---|---|---|---|---|---|

|
#31
6th Ave
Altoona, PA 16602
|
- sq. feet
|
- baths - beds |
show details | |

|
#32
Utah Rd
Altoona, PA 16602
|
- sq. feet
|
- baths - beds |
show details | |

|
#33
Crawford Ave
Altoona, PA 16602
|
- sq. feet
|
- baths - beds |
show details | |

|
#34
17th Ave
Altoona, PA 16601
|
- sq. feet
|
- baths - beds |
show details | |

|
#35
1st Ave
Altoona, PA 16602
|
- sq. feet
|
- baths - beds |
show details | |

|
#36
Rosewood Dr
Altoona, PA 16601
|
- sq. feet
|
- baths - beds |
show details | |

|
#37
N 5th Ave
Altoona, PA 16601
|
- sq. feet
|
- baths - beds |
show details | |

|
#38
Neal Ave
Altoona, PA 16602
|
- sq. feet
|
- baths - beds |
show details | |

|
#39
3rd Ave
Altoona, PA 16602
|
- sq. feet
|
- baths - beds |
show details | |

|
#40
57th St
Altoona, PA 16602
|
- sq. feet
|
- baths - beds |
show details |
| Photo | Address | Area | Beds / Baths | Price | Details |
|---|---|---|---|---|---|

|
#41
Swartz Rd
Altoona, PA 16601
|
- sq. feet
|
- baths - beds |
show details | |

|
#42
Broad Ave
Altoona, PA 16601
|
- sq. feet
|
- baths - beds |
show details | |

|
#43
5th Ave
Altoona, PA 16602
|
- sq. feet
|
- baths - beds |
show details | |

|
#44
6th Ave
Altoona, PA 16602
|
- sq. feet
|
- baths - beds |
show details | |

|
#45
3rd Ave
Altoona, PA 16602
|
- sq. feet
|
- baths - beds |
show details | |

|
#46
Bellmeade Dr
Altoona, PA 16602
|
- sq. feet
|
- baths - beds |
show details | |

|
#47
W Chestnut Ave # 2
Altoona, PA 16601
|
- sq. feet
|
- baths - beds |
show details | |

|
#48
18th Ave
Altoona, PA 16601
|
- sq. feet
|
- baths - beds |
show details | |

|
Check over 1 million property listings on Foreclosure.com!
|
browse all offers | |||

Latest news about housing in Altoona, PA collected exclusively by city-data.com from local newspapers, TV, and radio stations

 | House for 9k? Johnstown, ok what's the deal? (23 replies) |
| Which metro area to move to in PA? (51 replies) |
| Prediction: City of Pittsburgh to lose much more population in the next 5 years. (363 replies) |
| How is Altoona for retirement? (44 replies) |
| State College Economy/Housing (5 replies) |
| Is PA depressing? (665 replies) |

Median year apartment built: 1950
Household type by relationship:
Households: 43,246- Male householders: 8,722 (3,126 living alone), Female householders: 9,454 (3,017 living alone)
6,803 spouses (6,760 opposite-sex spouses), 1,800 unmarried partners, (1,714 opposite-sex unmarried partners), 12,228 children (11,359 natural, 182 adopted, 686 stepchildren), 1,009 grandchildren, 332 brothers or sisters, 404 parents, 80 foster children, 394 other relatives, 965 non-relatives
- In group quarters: 1,050
Size of family households: 4,874 2-persons, 3,179 3-persons, 1,808 4-persons, 950 5-persons, 147 6-persons, 187 7-or-more-persons.
Size of nonfamily households: 6,687 1-person, 1,260 2-persons, 86 3-persons, 40 4-persons.
3,970 married couples with children.
3,581 single-parent households (1,051 men, 2,530 women).
97.3% of residents of Altoona speak English at home.
0.8% of residents speak Spanish at home (66% speak English very well, 29% speak English well, 5% speak English not well).
1.0% of residents speak other Indo-European language at home (79% speak English very well, 16% speak English well, 4% speak English not well, 2% don't speak English at all).
0.2% of residents speak Asian or Pacific Island language at home (16% speak English very well, 73% speak English well, 12% speak English not well).
Foreign born population: 278 (0.6%)
(73.7% of them are naturalized citizens)
| Here: | 6.8 |
| State: | 6.8 |
| Here: | 4.9 |
| State: | 4.3 |
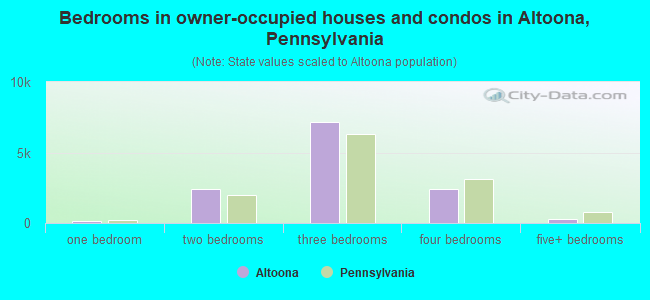
- Bedrooms in owner-occupied houses and condos in Altoona, Pennsylvania
- 20no bedroom
- 1711 bedroom
- 2,3802 bedrooms
- 7,1513 bedrooms
- 2,4454 bedrooms
- 2885+ bedrooms
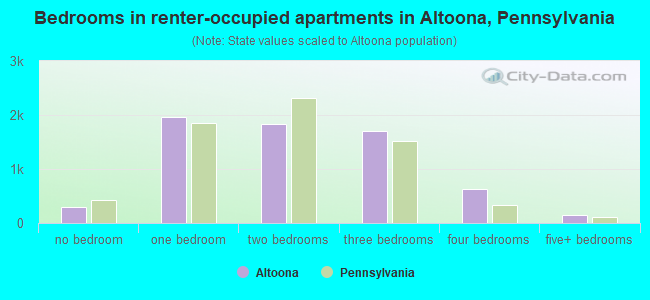
- Bedrooms in renter-occupied apartments in Altoona, Pennsylvania
- 293no bedroom
- 1,9641 bedroom
- 1,8342 bedrooms
- 1,7013 bedrooms
- 6294 bedrooms
- 1505+ bedrooms
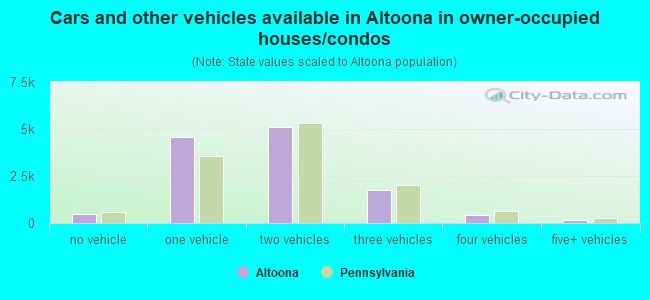
- Cars and other vehicles available in Altoona in owner-occupied houses/condos
- 455no vehicle
- 4,5661 vehicle
- 5,1042 vehicles
- 1,7293 vehicles
- 4334 vehicles
- 1685+ vehicles
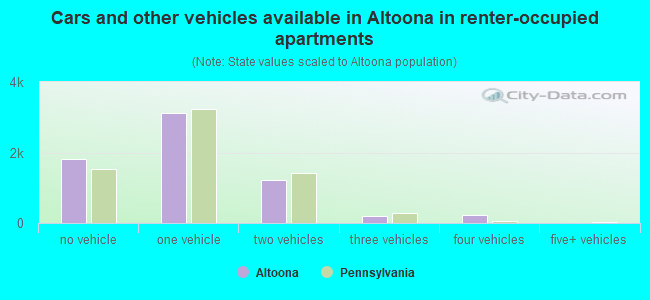
- Cars and other vehicles available in Altoona in renter-occupied apartments
- 1,802no vehicle
- 3,1321 vehicle
- 1,2242 vehicles
- 1983 vehicles
- 2154 vehicles
- 05+ vehicles
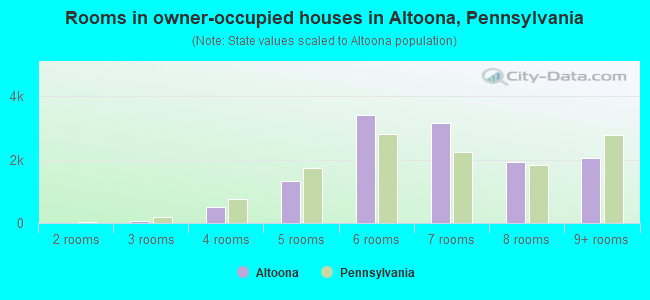
- Rooms in owner-occupied houses in Altoona, Pennsylvania
- 201 room
- 02 rooms
- 733 rooms
- 4904 rooms
- 1,3245 rooms
- 3,4136 rooms
- 3,1527 rooms
- 1,9368 rooms
- 2,0489+ rooms
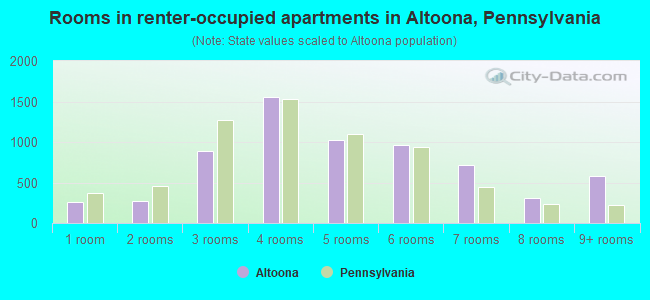
- Rooms in renter-occupied apartments in Altoona, Pennsylvania
- 2621 room
- 2682 rooms
- 8853 rooms
- 1,5584 rooms
- 1,0295 rooms
- 9646 rooms
- 7167 rooms
- 3068 rooms
- 5849+ rooms
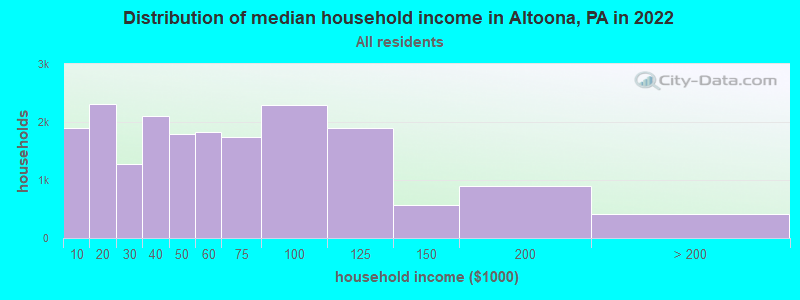
Altoona, PA household income distribution

- 1,893Less than $10,000
- 2,317$10,000 to $19,999
- 1,278$20,000 to $29,999
- 2,112$30,000 to $39,999
- 1,800$40,000 to $49,999
- 1,835$50,000 to $59,999
- 1,750$60,000 to $74,999
- 2,299$75,000 to $99,999
- 1,901$100,000 to $124,999
- 576$125,000 to $149,999
- 899$150,000 to $199,999
- 422$200,000 or more
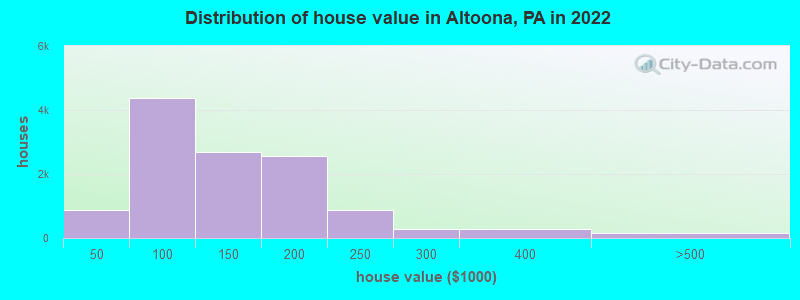
Home value of owner - occupied houses in 2022 in Altoona, PA
-
- 56Less than $10,000
- 132$10,000 to $14,999
- 67$15,000 to $19,999
- 43$20,000 to $24,999
- 139$25,000 to $29,999
- 99$30,000 to $34,999
- 106$35,000 to $39,999
- 231$40,000 to $49,999
- 501$50,000 to $59,999
- 798$60,000 to $69,999
- 1,072$70,000 to $79,999
- 943$80,000 to $89,999
- 813$90,000 to $99,999
- 1,812$100,000 to $124,999
- 883$125,000 to $149,999
- 1,887$150,000 to $174,999
- 676$175,000 to $199,999
- 859$200,000 to $249,999
- 272$250,000 to $299,999
- 275$300,000 to $399,999
- 126$400,000 to $499,999
- 10$500,000 to $749,999
- 15$750,000 to $999,999
- 7$2,000,000 or more
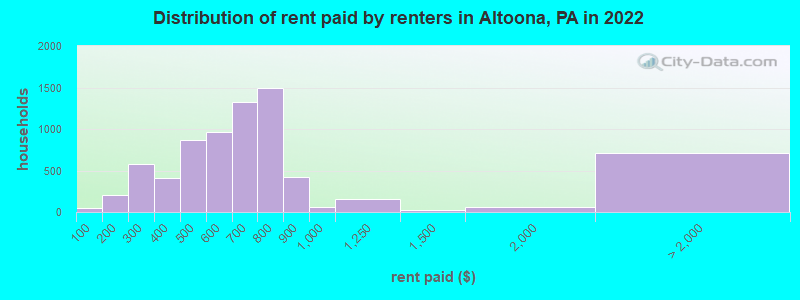
Rent paid by renters in 2022 in Altoona, PA
-
- 54Less than $100
- 132$100 to $149
- 77$150 to $199
- 166$200 to $249
- 407$250 to $299
- 258$300 to $349
- 155$350 to $399
- 204$400 to $449
- 662$450 to $499
- 315$500 to $549
- 648$550 to $599
- 526$600 to $649
- 795$650 to $699
- 641$700 to $749
- 849$750 to $799
- 425$800 to $899
- 66$900 to $999
- 162$1,000 to $1,249
- 24$1,250 to $1,499
- 59$1,500 to $1,999
- 57$2,000 to $2,499
- 18$2,500 to $2,999
- 637No cash rent
Percentage of workers working in this county: 90.3%
Number of people working at home: 1,447 (7.4% of all workers)
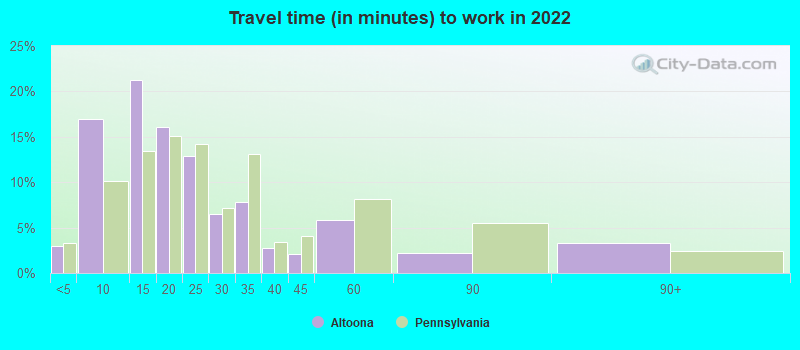
Travel time to work (commute)
- Less than 5 minutes: 614
- 5 to 9 minutes: 3,546
- 10 to 14 minutes: 4,642
- 15 to 19 minutes: 3,412
- 20 to 24 minutes: 2,307
- 25 to 29 minutes: 583
- 30 to 34 minutes: 777
- 35 to 39 minutes: 110
- 40 to 44 minutes: 368
- 45 to 59 minutes: 1,350
- 60 to 89 minutes: 271
- 90 or more minutes: 137
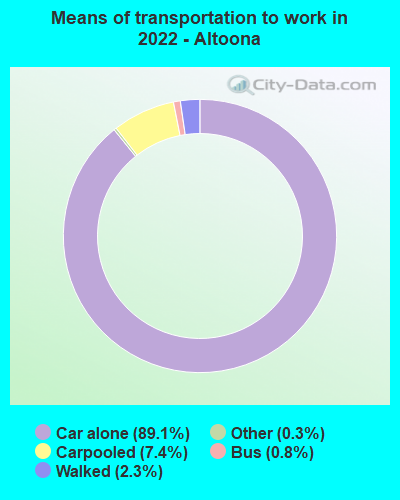
Means of transportation to work:
- Drove a car alone: 17,593 (81.7%)
- Carpooled: 1,465 (6.8%)
- Bus: 127 (0.6%)
- Taxi: 67 (0.3%)
- Bicycle: 11 (0.1%)
- Walked: 447 (2.1%)
- Worked at home: 1,447 (6.7%)
- Unemployment by race in 2022
- Unemployment rate for White non-Hispanic residents
- 4.1%Males
- 3.1%Females
- Unemployment rate for Black residents
- 12.2%Males
- 8.7%Females
- Unemployment rate for American Indian and Alaska Native residents
- 22.6%Males
- 100.0%Females
- Unemployment rate for Asian residents
- 17.4%Males
- Unemployment rate for other race residents
- 6.6%Males
- Unemployment rate for two or more race residents
- 2.0%Males
- 6.3%Females
- Unemployment rate for Hispanic or Latino residents
- 5.1%Males
- 5.7%Females
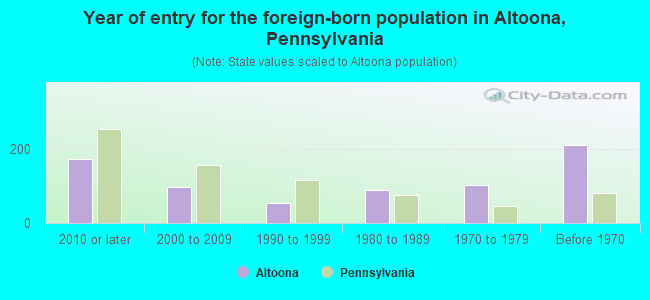
- Year of entry for the foreign-born population in Altoona, Pennsylvania
- 1722010 or later
- 962000 to 2009
- 551990 to 1999
- 891980 to 1989
- 1031970 to 1979
- 211Before 1970
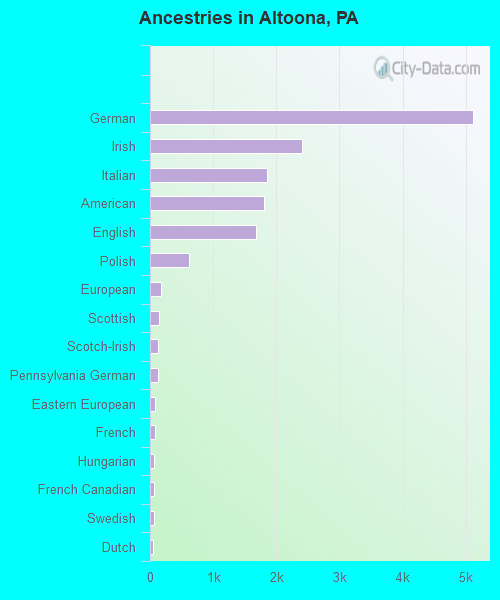
First ancestries reported:
- German: 5,113 (29.7%)
- Irish: 2,405 (14.0%)
- Italian: 1,854 (10.8%)
- American: 1,801 (10.5%)
- English: 1,684 (9.8%)
- Polish: 619 (3.6%)
- European: 173 (1.0%)
- Scottish: 148 (0.9%)
- Scotch-Irish: 127 (0.7%)
- Pennsylvania German: 122 (0.7%)
- Eastern European: 74 (0.4%)
- French: 74 (0.4%)
- Hungarian: 63 (0.4%)
- French Canadian: 62 (0.4%)
- Swedish: 62 (0.4%)
- Dutch: 55 (0.3%)
- Norwegian: 38 (0.2%)
- Ukrainian: 32 (0.2%)
- Ethiopian: 29 (0.2%)
- Slovak: 28 (0.2%)
- Welsh: 26 (0.2%)
- Greek: 19 (0.1%)
- Brazilian: 18 (0.1%)
- British: 16 (0.09%)
- Swiss: 16 (0.09%)
- Croatian: 15 (0.09%)
- Lithuanian: 15 (0.09%)
- Albanian: 14 (0.08%)
- Russian: 13 (0.08%)
- Portuguese: 12 (0.07%)
- Canadian: 9 (0.05%)
- African: 9 (0.05%)
- Czechoslovakian: 8 (0.05%)
- Czech: 8 (0.05%)
- Northern European: 5 (0.03%)
- Haitian: 4 (0.02%)
Most common places of birth for foreign-born residents (%):
| Altoona: | 17.2% (69) |
| Pennsylvania: | 9.2% (86,544) |
| Altoona: | 12.5% (50) |
| Pennsylvania: | 0.5% (4,593) |
| Altoona: | 11.2% (45) |
| Pennsylvania: | 2.2% (21,039) |
| Altoona: | 9.5% (38) |
| Pennsylvania: | 1.4% (13,077) |
| Altoona: | 6.7% (27) |
| Pennsylvania: | 0.1% (554) |
| Altoona: | 5.7% (23) |
| Pennsylvania: | 1.3% (12,172) |
| Altoona: | 5.7% (23) |
| Pennsylvania: | 1.8% (17,032) |
| Altoona: | 5.2% (21) |
| Pennsylvania: | 1.6% (15,272) |
| Altoona: | 4.2% (17) |
| Pennsylvania: | 7.2% (67,704) |
| Altoona: | 4.2% (17) |
| Pennsylvania: | 0.5% (4,519) |
| Altoona: | 3.2% (13) |
| Pennsylvania: | 0.5% (4,648) |
| Altoona: | 3.0% (12) |
| Pennsylvania: | 5.8% (54,190) |
| Altoona: | 2.5% (10) |
| Pennsylvania: | 0.7% (6,351) |
| Altoona: | 2.5% (10) |
| Pennsylvania: | 1.1% (10,035) |
| Altoona: | 1.7% (7) |
| Pennsylvania: | 0.6% (6,097) |
Place of birth for U.S.-born residents:
- This state: 38,439
- Other state: 4,426
- Northeast: 1,671
- Midwest: 584
- South: 1,823
- West: 361
88.8% of Altoona residents lived in the same house 1 years ago.
Out of people who lived in different houses, 38.2% lived in this county.
Out of people who lived in different counties, 62.5% lived in Pennsylvania.
| Altoona: | 88.8% |
| State average: | 89.3% |
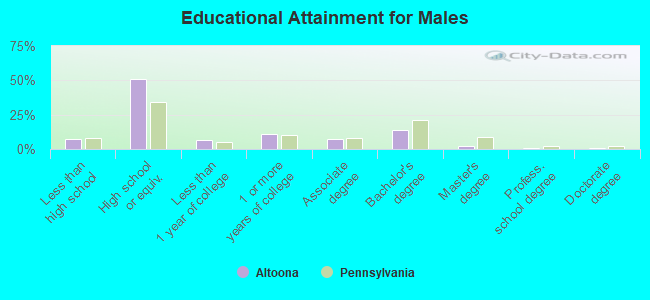
Education attainment for males 25 years and older:
- No schooling: 67
- Nursery to 4th grade: 23
- 5th and 6th grade: 10
- 7th and 8th grade: 44
- 9th grade: 206
- 10th grade: 157
- 11th grade: 194
- 12th grade, no diploma: 331
- High school graduate (or equivalency): 7,323
- Less than 1 year of college: 992
- Some college more than 1 year, no degree: 1,572
- Associate degree: 1,060
- Bachelor's degree: 2,038
- Master's degree: 290
- Professional school degree: 90
- Doctorate degree: 72
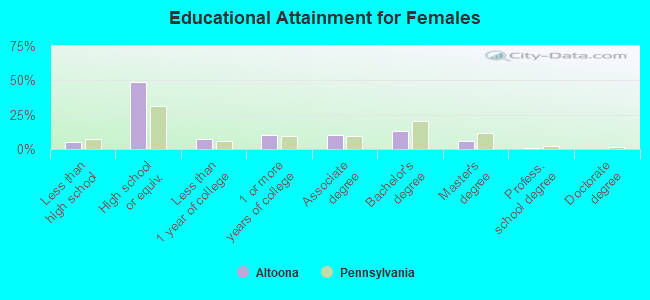
Education attainment for females 25 years and older:
- No schooling: 34
- Nursery to 4th grade: 0
- 5th and 6th grade: 21
- 7th and 8th grade: 98
- 9th grade: 68
- 10th grade: 118
- 11th grade: 286
- 12th grade, no diploma: 141
- High school graduate (or equivalency): 7,436
- Less than 1 year of college: 1,072
- Some college more than 1 year, no degree: 1,549
- Associate degree: 1,540
- Bachelor's degree: 1,973
- Master's degree: 850
- Professional school degree: 105
- Doctorate degree: 33


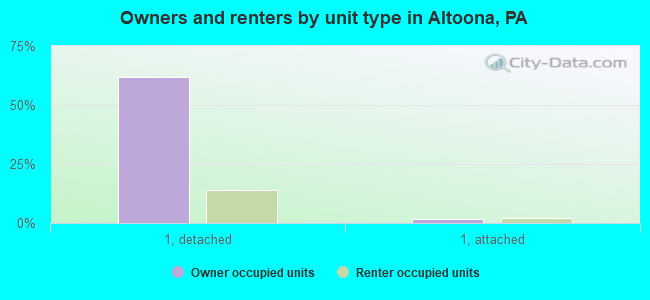
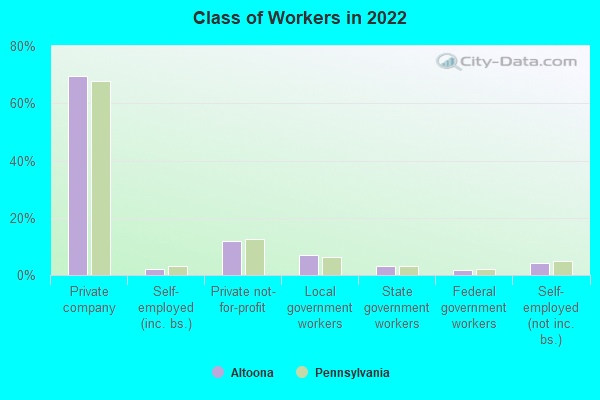
Housing units in structures:
- One, detached: 15,316
- One, attached: 860
- Two: 1,258
- 3 or 4: 1,085
- 5 to 9: 564
- 10 to 19: 378
- 20 to 49: 268
- 50 or more: 1,049
- Mobile homes: 90
Housing units lacking complete kitchen facilities in 2022: 4.8%
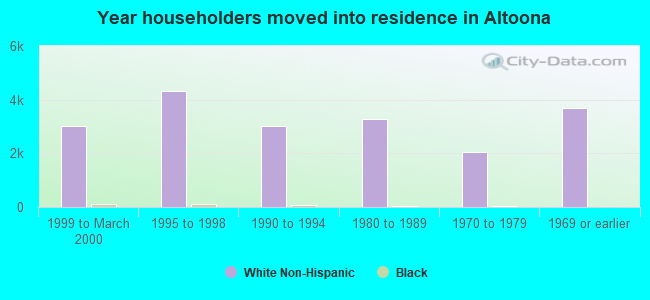
House/condo owner moved in on average 17 years ago
Renter moved in on average 3 years ago
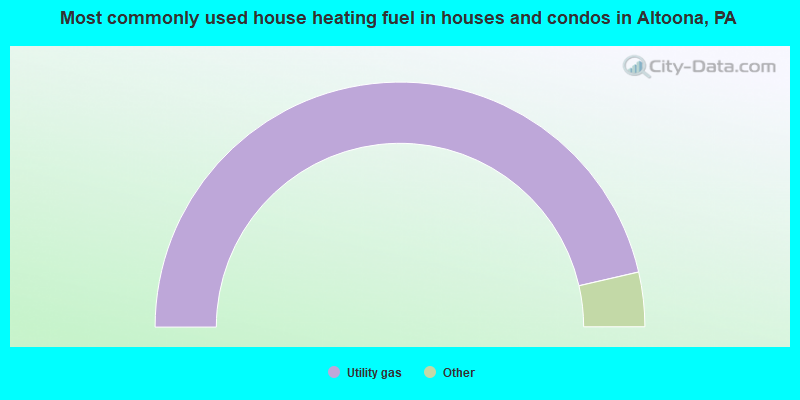
- 92.8%Utility gas
- 3.7%Electricity
- 1.7%Fuel oil, kerosene, etc.
- 1.1%Bottled, tank, or LP gas
- 0.4%Wood
- 0.3%Other fuel
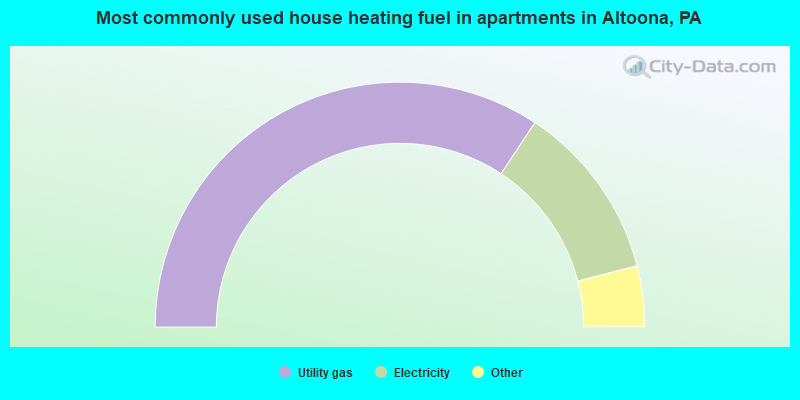
- 68.5%Utility gas
- 23.4%Electricity
- 3.3%Bottled, tank, or LP gas
- 2.5%No fuel used
- 1.8%Fuel oil, kerosene, etc.
- 0.4%Other fuel
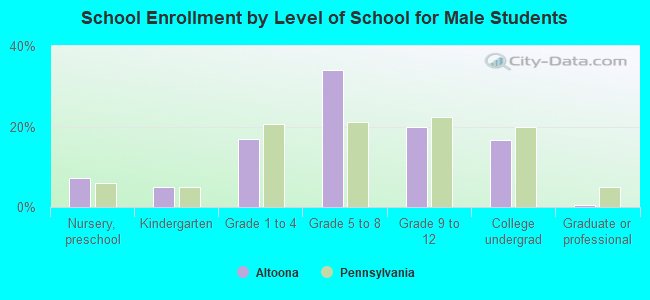
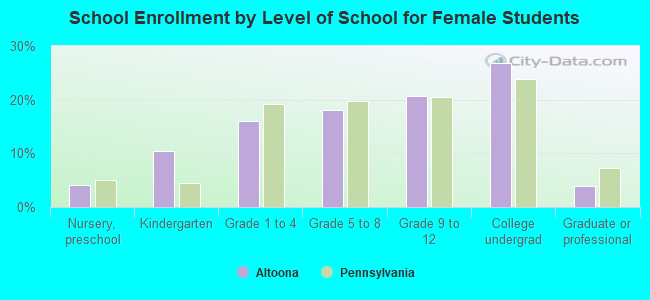
Private vs. public school enrollment:
| Here: | 8.4% |
| Pennsylvania: | 15.7% |
| Here: | 21.6% |
| Pennsylvania: | 13.4% |
| Here: | 16.6% |
| Pennsylvania: | 39.8% |