Races in Altoona, Pennsylvania (PA) Detailed Stats
Ancestries, Foreign-born residents, place of birth
Settings
X


Recent posts about races in Altoona, Pennsylvania on our local forum with over 2,400,000 registered users:
 | African American Dreads (1 reply) |
| Pittsburgh: Midwest vibe in a Mid-Atlantic state? (79 replies) |
| Prediction: City of Pittsburgh to lose much more population in the next 5 years. (363 replies) |
| What are the chances of Trump winning Pennsylvania again in 2020 Election? (267 replies) |
| How is Altoona for retirement? (44 replies) |
| One Pennsylvania (127 replies) |
Latest news about races in Altoona, PA collected exclusively by city-data.com from local newspapers, TV, and radio stations
According to 2022 data, the most numerous races in Altoona, PA are White alone (38,174 residents), Black alone (1,631 residents), and Hispanic (893 residents). 97.5% of Altoona residents speak English at home. 0.9% of Altoona, PA residents are foreign-born , which is 654.9% less than the foreign-born rate of 7.0% across the entire state of Pennsylvania.
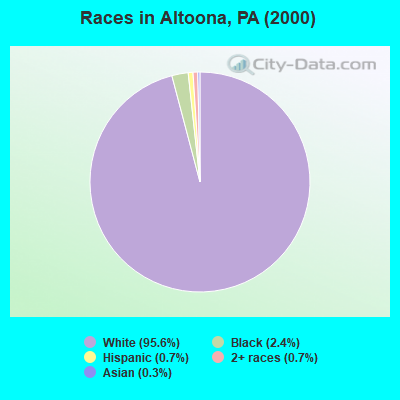
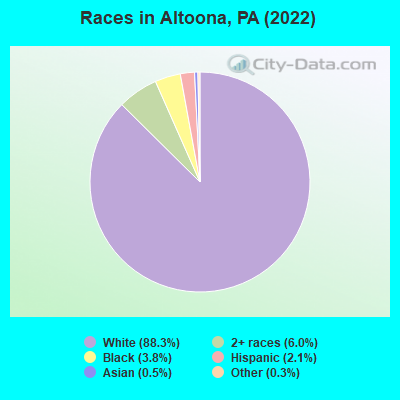
Race distribution in Altoona
2000
2022

- 47,34295.6%White alone
- 1,2022.4%Black alone
- 3670.7%Hispanic
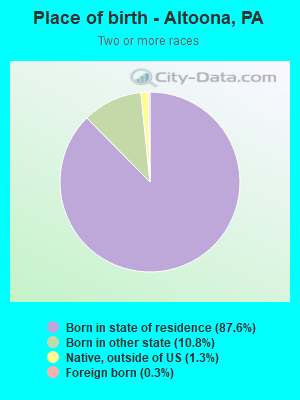
- 3650.7%Two or more races
- 1560.3%Asian alone
- 480.10%American Indian alone
- 390.08%Other race alone
- 40.01%Native Hawaiian and Other
Pacific Islander alone
-
- 38,17488.3%White alone
- 2,6066.0%Two or more races
- 1,6313.8%Black alone
- 8932.1%Hispanic
- 2010.5%Asian alone
- 1150.3%Other race alone
- 430.10%American Indian alone
- 210.05%Native Hawaiian and Other
Pacific Islander alone
2000
2022
-
- 10,322,45584.1%White alone
- 1,202,4379.8%Black alone
- 394,0883.2%Hispanic
- 218,2961.8%Asian alone
- 113,0970.9%Two or more races
- 13,0860.1%Other race alone
- 14,9040.1%American Indian alone
- 2,6910.02%Native Hawaiian and Other
Pacific Islander alone

-
- 9,487,22873.1%White alone
- 1,311,58110.1%Black alone
- 1,115,9978.6%Hispanic
- 493,9423.8%Two or more races
- 487,1243.8%Asian alone
- 63,5820.5%Other race alone
- 10,1300.08%American Indian alone
- 2,4240.02%Native Hawaiian and Other
Pacific Islander alone

Income and house value in Altoona
- Median household income in 2022
- $50,920White non-Hispanic householders
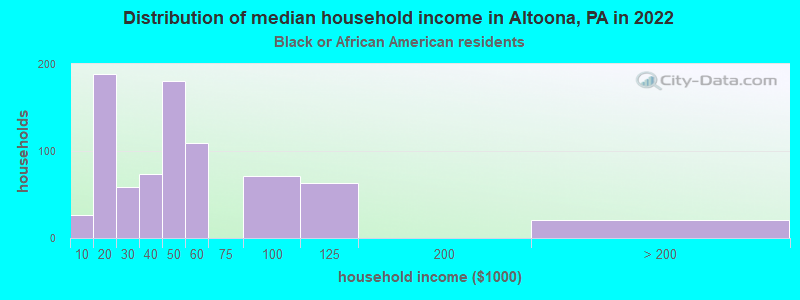
- $48,800Black householders
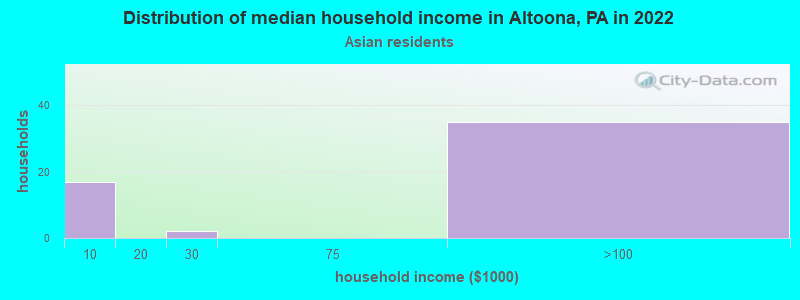
- $83,814Asian householders
- $40,476Two or more races householders
- $40,091Hispanic or Latino race householders
- Median 2022 house value
- $118,710White Non-Hispanic householders
- $95,787Black or African American householders
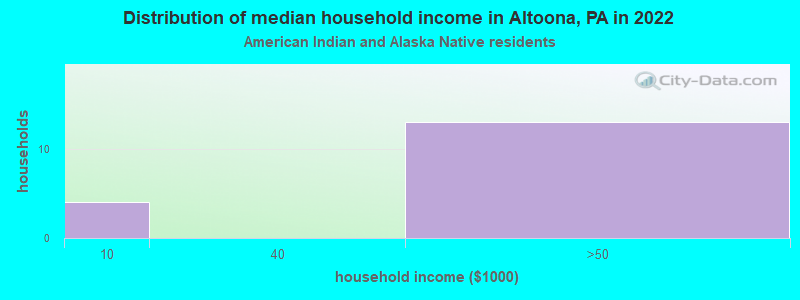
- $114,617American Indian or Alaska Native householders
- $184,206Asian householders
- $101,313Two or more races householders
- $134,675Hispanic or Latino householders
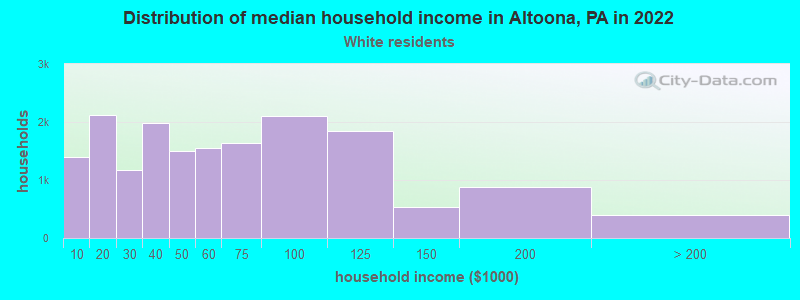
Household income for White non-Hispanic householders
Household income for Black householders
Household income for American Indian and Alaska Native householders
Household income for Asian householders
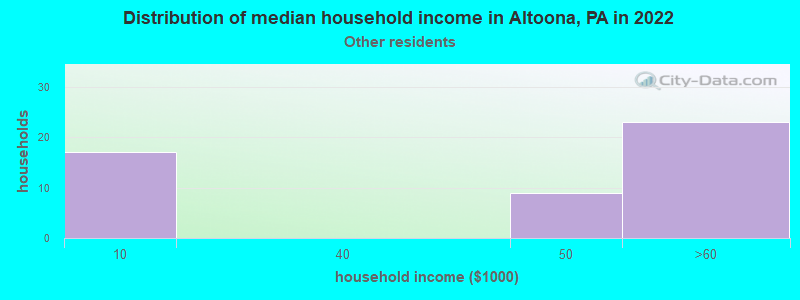
Household income for Some other race householders
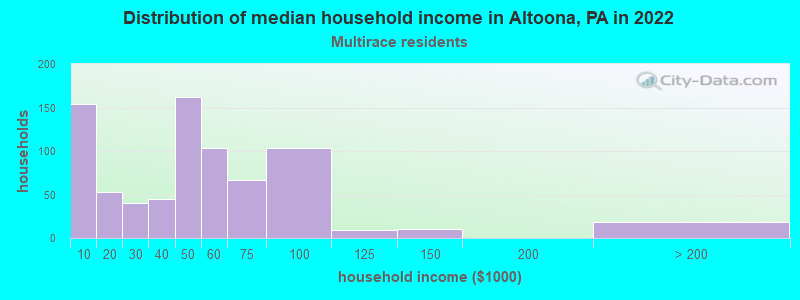
Household income for Two or more races householders
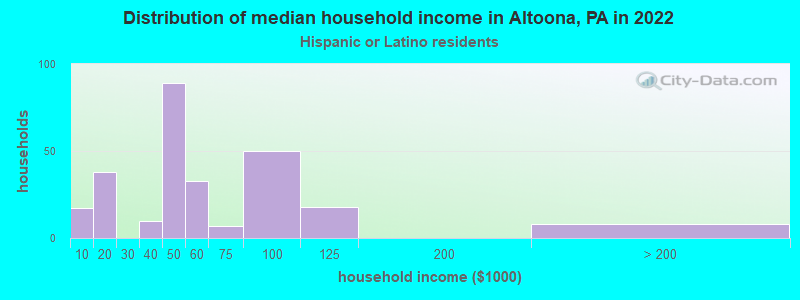
Household income for Hispanic or Latino race householders
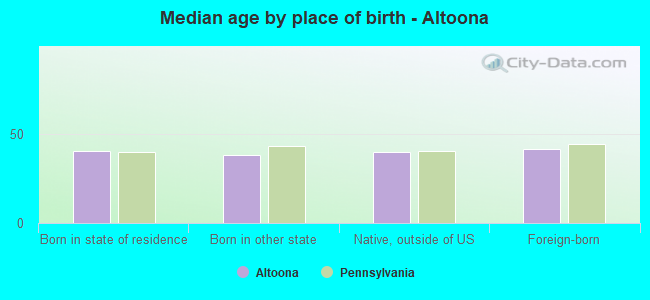
Median age by race in Altoona
- 41.7Median age for White residents
- 40.9Males
- 42.8Females
- 29.7Median age for Black or African American residents
- 37.4Males
- 23.7Females
- 49.6Median age for American Indian / Alaska Native residents
- 55.2Males
- -577,519,379.3Females
- 37.8Median age for Asian residents
- 33.0Males
- 35.4Females
- -666,666,666.0Median age for Native Hawaiian / Pacific Islander residents
- -666,666,666.0Males
- -666,666,666.0Females
- 35.2Median age for Other race residents
- 37.9Males
- 32.4Females
- 24.0Median age for Two or more races residents
- 20.7Males
- 27.0Females
- 41.8Median age for White alone residents
- 41.2Males
- 42.9Females
- 20.7Median age for Hispanic or Latino residents
- 22.6Males
- 17.5Females
Owner/renter occupied households by race in Altoona
- House owners and renters - White residents
- 11,43066.5%Owner occupied
- 5,76633.5%Renter occupied
- House owners and renters - Black or African American residents
- 37940.3%Owner occupied
- 56159.7%Renter occupied
- House owners and renters - American Indian / Alaska Native residents
- 965.9%Owner occupied
- 534.1%Renter occupied
- House owners and renters - Asian residents
- 4169.4%Owner occupied
- 1830.6%Renter occupied
- House owners and renters - Native Hawaiian / Pacific Islander residents
- 25100.0%Owner occupied
- House owners and renters - Other race residents
- 1218.9%Owner occupied
- 5281.1%Renter occupied
- House owners and renters - Two or more races residents
- 19826.8%Owner occupied
- 54173.2%Renter occupied
- House owners and renters - White alone residents
- 11,32366.4%Owner occupied
- 5,73133.6%Renter occupied
- House owners and renters - Hispanic or Latino residents
- 18661.1%Owner occupied
- 11838.9%Renter occupied
Language usage in Altoona
- English speakers - Total
- 97.5% of residents of Altoona speak English at home.
- 0.8% of residents speak Spanish at home
- 20864.6%Speak English very well
- 11435.4%Speak English less than very well
- 1.2% of residents speak other language at home
- 35168.7%Speak English very well
- 16031.3%Speak English less than very well
- English speakers - Born in the United States
- 95.7% of residents of Altoona speak English at home.
- 1.2% of residents speak Spanish at home
- 3873.1%Speak English very well
- 1426.9%Speak English less than very well
- 2.7% of residents speak other language at home
- 121100.0%Speak English very well
All residents speak only English at home
- English speakers - Foreign-born
- 36.3% of residents of Altoona speak English at home.
- 22.6% of residents speak Spanish at home
- 2830.8%Speak English very well
- 6369.2%Speak English less than very well
- 41.0% of residents speak other language at home
- 4627.9%Speak English very well
- 11972.1%Speak English less than very well
White (Caucasian) - Speak only English
| Native: | 98.9% (35,975) |
| Foreign-born: | 39.5% (42) |
White (Caucasian) - Speak another language
| Native: | 1.1% (409) |
| Foreign-born: | 59.3% (62) |
Asian - Speak only English
| Native: | 86.8% (58) |
| Foreign-born: | 51.8% (78) |
Asian - Speak another language
| Native: | 10.5% (7) |
| Foreign-born: | 48.6% (74) |
Other race - Speak another language
| Native: | 38.4% (30) |
| Foreign-born: | 100.0% (80) |
Two or more races - Speak only English
| Native: | 97.5% (2,293) |
| Foreign-born: | 82.8% (7) |
White alone - Speak only English
| Native: | 98.9% (35,722) |
| Foreign-born: | 30.3% (23) |
White alone - Speak another language
| Native: | 1.1% (404) |
| Foreign-born: | 72.1% (55) |
Hispanic or Latino - Speak only English
| Native: | 92.7% (649) |
| Foreign-born: | 14.1% (14) |
Hispanic or Latino - Speak another language
| Native: | 8.4% (59) |
| Foreign-born: | 85.3% (85) |
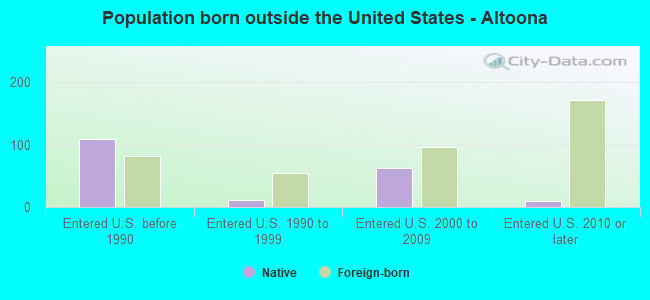
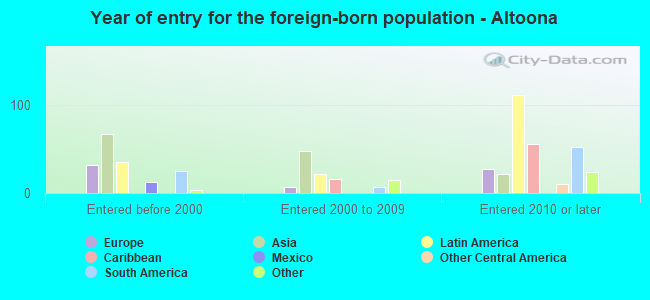
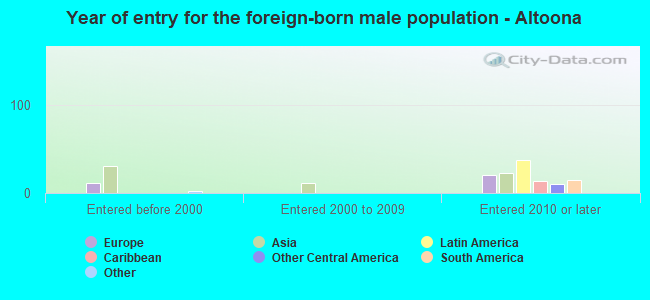
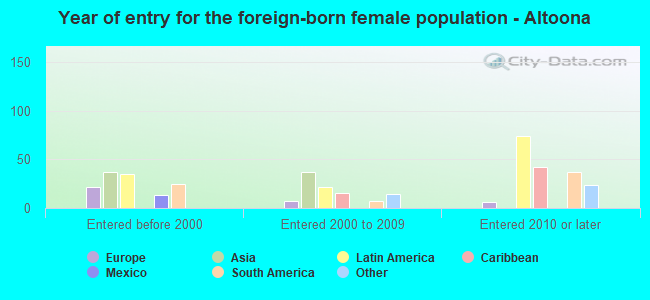
Foreign-born residents in Altoona
401 residents are foreign born
| This city: | 0.9% |
| Pennsylvania: | 7.3% |
Marital status for residents in Altoona
Marital status - White (Caucasian) population 15 years and over
- Males
- 37.9%Never married
- 43.4%Now married
- 3.4%Separated
- 3.1%Widowed
- 12.3%Divorced
- Females
- 31.4%Never married
- 41.2%Now married
- 1.7%Separated
- 11.2%Widowed
- 14.4%Divorced
Women who gave birth in the past 12 months
| Now married: | 62.8% (248) |
| Unmarried: | 37.2% (147) |
Women who did not give birth in the past 12 months
| Now married: | 36.6% (3,051) |
| Unmarried: | 63.4% (5,284) |
Marital status - Black or African American population 15 years and over
- Males
- 55.4%Never married
- 24.9%Now married
- 5.4%Separated
- 2.8%Widowed
- 11.5%Divorced
- Females
- 59.9%Never married
- 12.5%Now married
- 11.6%Separated
- 9.1%Widowed
- 6.8%Divorced
Women who did not give birth in the past 12 months
| Now married: | 16.8% (52) |
| Unmarried: | 83.2% (257) |
Marital status - American Indian / Alaska Native population 15 years and over
- Males
- 23.5%Never married
- 0.0%Now married
- 58.8%Separated
- 17.6%Widowed
- 0.0%Divorced
- Females
- 100.0%Never married
- 0.0%Now married
- 0.0%Separated
- 0.0%Widowed
- 0.0%Divorced
Women who did not give birth in the past 12 months
| Now married: | 0.0% (0) |
| Unmarried: | 100.0% (5) |
Marital status - Asian population 15 years and over
- Males
- 66.7%Never married
- 25.9%Now married
- 0.0%Separated
- 3.7%Widowed
- 3.7%Divorced
- Females
- 34.0%Never married
- 66.0%Now married
- 0.0%Separated
- 0.0%Widowed
- 0.0%Divorced
Women who did not give birth in the past 12 months
| Now married: | 52.0% (40) |
| Unmarried: | 48.0% (37) |
Marital status - Other race population 15 years and over
- Males
- 27.0%Never married
- 29.7%Now married
- 0.0%Separated
- 0.0%Widowed
- 43.2%Divorced
- Females
- 5.4%Never married
- 64.3%Now married
- 0.0%Separated
- 0.0%Widowed
- 30.4%Divorced
Women who did not give birth in the past 12 months
| Now married: | 65.5% (45) |
| Unmarried: | 34.5% (24) |
Marital status - Two or more races population 15 years and over
- Males
- 43.5%Never married
- 27.0%Now married
- 0.0%Separated
- 7.6%Widowed
- 21.9%Divorced
- Females
- 57.3%Never married
- 10.5%Now married
- 1.5%Separated
- 4.7%Widowed
- 26.0%Divorced
Women who did not give birth in the past 12 months
| Now married: | 12.4% (76) |
| Unmarried: | 87.6% (535) |
Marital status - White alone, not Hispanic / Latino population 15 years and over
- Males
- 37.7%Never married
- 43.4%Now married
- 3.4%Separated
- 3.1%Widowed
- 12.4%Divorced
- Females
- 31.2%Never married
- 41.2%Now married
- 1.7%Separated
- 11.3%Widowed
- 14.5%Divorced
Women who gave birth in the past 12 months
| Now married: | 62.8% (249) |
| Unmarried: | 37.2% (148) |
Women who did not give birth in the past 12 months
| Now married: | 36.8% (3,031) |
| Unmarried: | 63.2% (5,215) |
Marital status - Hispanic or Latino population 15 years and over
- Males
- 71.5%Never married
- 28.5%Now married
- 0.0%Separated
- 0.0%Widowed
- 0.0%Divorced
- Females
- 46.8%Never married
- 41.3%Now married
- 0.0%Separated
- 3.0%Widowed
- 8.8%Divorced
Women who did not give birth in the past 12 months
| Now married: | 37.3% (96) |
| Unmarried: | 62.7% (162) |
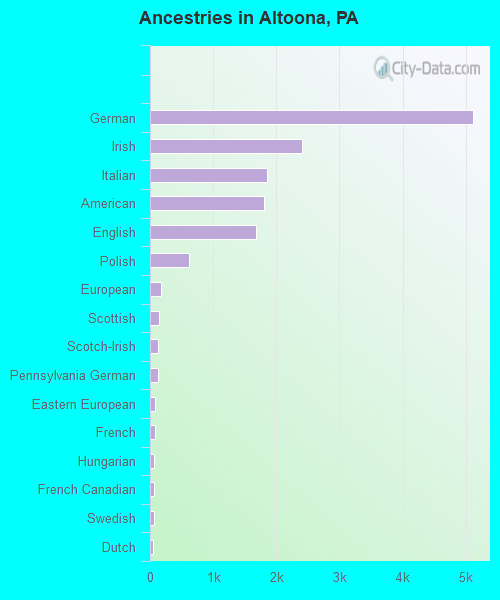
Ancestries in Altoona

- 5,11329.7%German
- 2,40514.0%Irish
- 1,85410.8%Italian
- 1,80110.5%American
- 1,6849.8%English
- 6193.6%Polish
- 1731.0%European
- 1480.9%Scottish
- 1270.7%Scotch-Irish
- 1220.7%Pennsylvania German
- 740.4%Eastern European
- 740.4%French
- 630.4%Hungarian
- 620.4%French Canadian
- 620.4%Swedish
- 550.3%Dutch
- 380.2%Norwegian
- 320.2%Ukrainian
- 290.2%Ethiopian
- 280.2%Slovak
- 260.2%Welsh
- 190.1%Greek
- 180.1%Brazilian
- 160.09%British
- 160.09%Swiss
- 150.09%Croatian
- 150.09%Lithuanian
- 140.08%Albanian
- 130.08%Russian
- 120.07%Portuguese
- 90.05%Canadian
- 90.05%African
- 80.05%Czechoslovakian
- 80.05%Czech
- 50.03%Northern European
- 40.02%Haitian
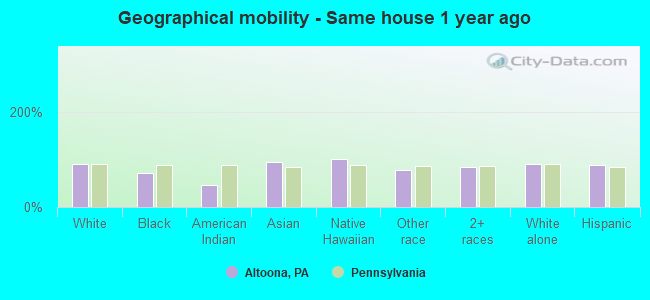
Geographical mobility in Altoona

- Same house 1 year ago
- 34,49390.4%White (Caucasian)
- 1,01071.4%Black or African American
- 2845.8%American Indian / Alaska Native
- 22694.4%Asian
- 23100.0%Native Hawaiian / Pacific Islander
- 13577.4%Other race
- 2,52184.2%Two or more races
- 34,22890.4%White alone, not Hispanic / Latino
- 76988.0%Hispanic or Latino
-
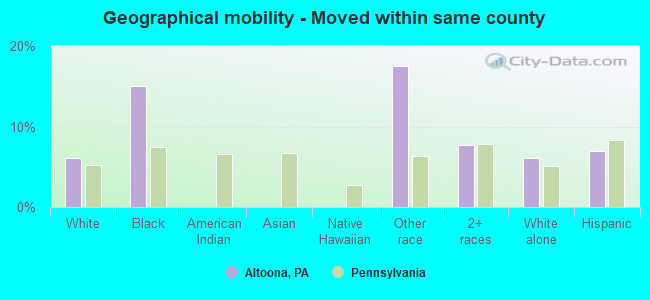
- Moved within same county
- 2,3326.1%White / Caucasian
- 21315.1%Black or African American
- 3117.5%Other race
- 2317.7%Two or more races
- 2,2996.1%White alone, not Hispanic / Latino
- 616.9%Hispanic or Latino
-
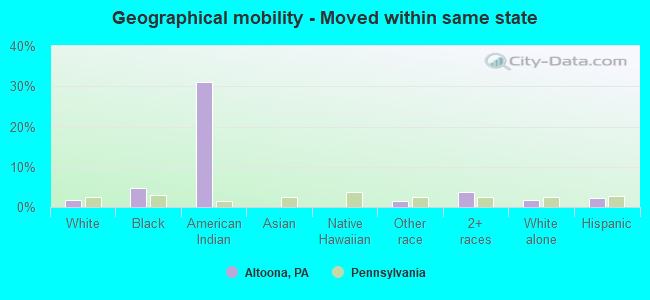
- Moved within same state
- 7031.8%White / Caucasian
- 664.7%Black or African American
- 1931.1%American Indian / Alaska Native
- 31.6%Other race
- 1123.7%Two or more races
- 6961.8%White alone, not Hispanic / Latino
- 202.2%Hispanic or Latino
-
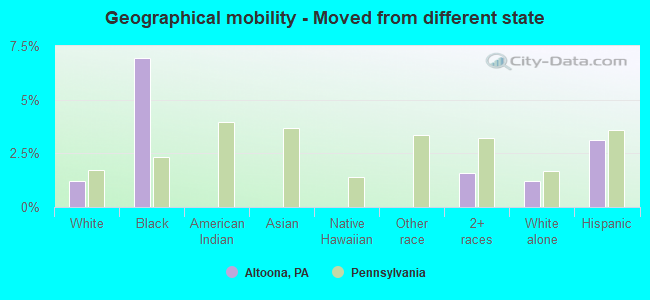
- Moved from different state
- 4621.2%White / Caucasian
- 986.9%Black or African American
- 471.6%Two or more races
- 4561.2%White alone, not Hispanic / Latino
- 273.1%Hispanic or Latino
-
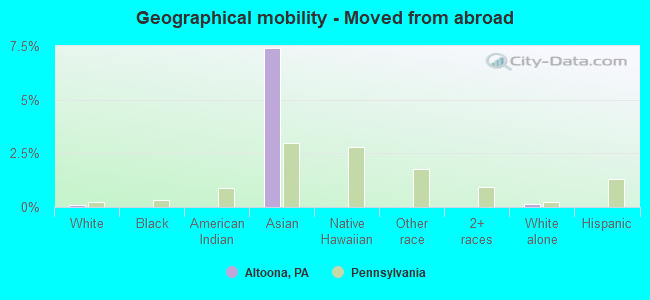
- Moved from abroad
- 430.1%White
- 187.4%Asian
- 440.1%White alone, not Hispanic / Latino
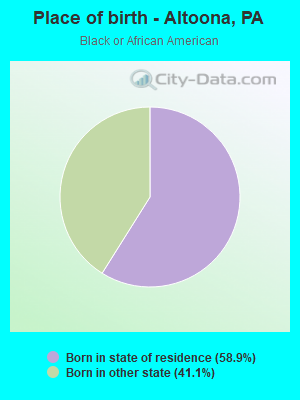
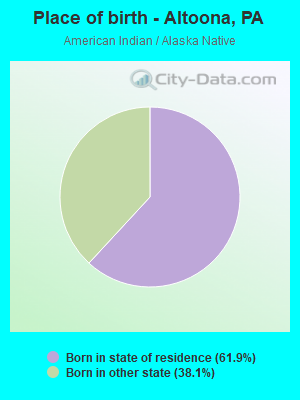
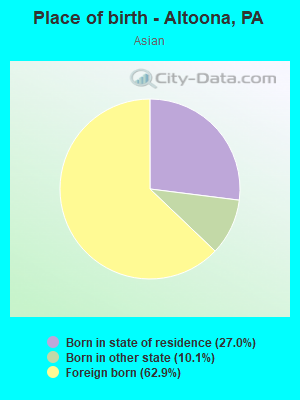
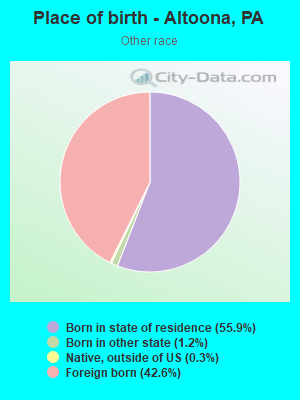
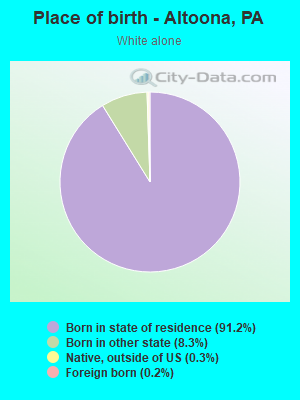
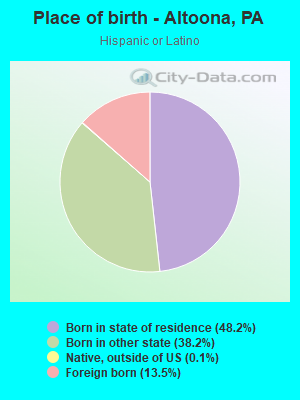
Children Nativity (place of birth) in Altoona
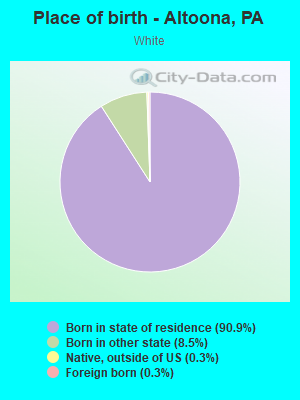
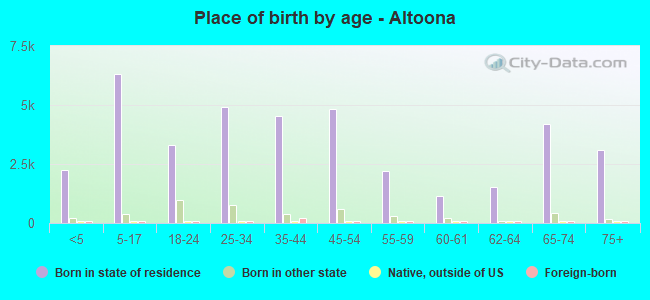
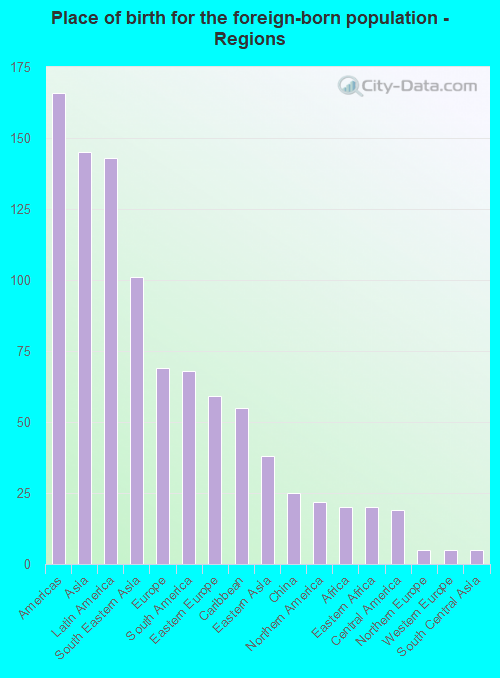
Place of birth for residents in Altoona
![Place of birth for the foreign-born population - Regions]()
- 166Americas
- 145Asia
- 143Latin America
- 101South Eastern Asia
- 69Europe
- 68South America
- 59Eastern Europe
- 55Caribbean
- 38Eastern Asia
- 25China
- 22Northern America
- 20Africa
- 20Eastern Africa
- 19Central America
- 5Northern Europe
- 5Western Europe
- 5South Central Asia
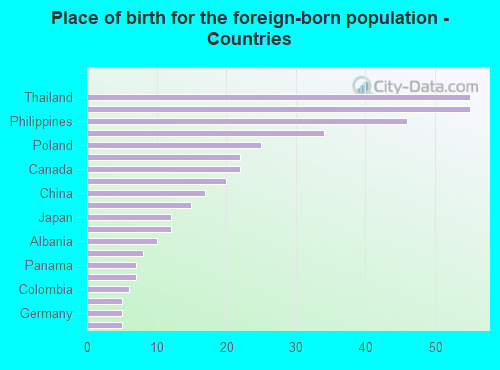
![Place of birth for the foreign-born population - Countries]()
- 55Thailand
- 55Dominican Republic
- 46Philippines
- 34Brazil
- 25Poland
- 22Russia
- 22Canada
- 20Eritrea
- 17China
- 15Guyana
- 12Japan
- 12Mexico
- 10Albania
- 8Taiwan
- 7Panama
- 7Ecuador
- 6Colombia
- 5Sweden
- 5Germany
- 5Pakistan