Albany, GA (Georgia) Houses and Residents
| Albany: | $111,500 |
| Georgia: | $297,400 |
Mean price in 2022:
Detached houses: $165,512
Here: $165,512 State: $376,364 Townhouses or other attached units: $117,159
Here: $117,159 State: $341,709 In 2-unit structures: $43,755
Here: $43,755 State: $269,631 In 3-to-4-unit structures: $102,119
Here: $102,119 State: $250,092 In 5-or-more-unit structures: $121,519
Here: $121,519 State: $370,730 Mobile homes: $49,262
Here: $49,262 State: $102,413
Total population: 75,769 (All urban)
Houses: 33,227 (27,608 occupied: 11,303 owner occupied, 16,305 renter occupied)
| % of renters here: | 59% |
| State: | 34% |
Housing density: 598 houses/condos per square mile
Median price asked for vacant for-sale houses and condos in 2022: $68,116.
Median contract rent in 2022: $624 (lower quartile is $458, upper quartile is $795)
Median rent asked for vacant for-rent units in 2022: $507
Median gross rent in Albany, GA in 2022: $896
Housing units in Albany with a mortgage: 6,201 (1,089 second mortgage, 0 home equity loan, 770 both second mortgage and home equity loan)
Houses without a mortgage: 218
Median household income for houses/condos with a mortgage: $69,994
Median household income for apartments without a mortgage: $44,122
Median monthly housing costs: $852
Compare current foreclosures in Albany, GA:
| Photo | Address | Area | Beds / Baths | Price | Details |
|---|---|---|---|---|---|

|
#1
Oak Haven Dr
Albany, GA 31721
|
1,749 sq. feet
|
2 baths 3 beds |
$31,200
|
show details |

|
#2
W Gordon Ave
Albany, GA 31701
|
1,036 sq. feet
|
1 baths 3 beds |
$110,000
|
show details |

|
#3
Perth Ct
Albany, GA 31721
|
3,675 sq. feet
|
3 baths 4 beds |
$354,000
|
show details |

|
#4
W Highland Ave
Albany, GA 31701
|
2,331 sq. feet
|
2 baths 3 beds |
$69,000
|
show details |

|
#5
Nelson Ave
Albany, GA 31701
|
1,055 sq. feet
|
1 baths 2 beds |
$39,900
|
show details |

|
#6
Keystone Ave
Albany, GA 31705
|
1,393 sq. feet
|
1 baths 3 beds |
$44,900
|
show details |

|
#7
Antioch Rd
Albany, GA 31705
|
1,614 sq. feet
|
1 baths 3 beds |
show details | |

|
#8
Mcarthur St
Albany, GA 31701
|
1,241 sq. feet
|
2 baths 3 beds |
show details | |

|
#9
Moultrie Rd
Albany, GA 31705
|
- sq. feet
|
- baths 4 beds |
$34,900
|
show details |

|
#10
James Dr
Albany, GA 31705
|
2,196 sq. feet
|
1 baths 3 beds |
show details |
| Photo | Address | Area | Beds / Baths | Price | Details |
|---|---|---|---|---|---|

|
#11
Avalon Ave
Albany, GA 31707
|
1,248 sq. feet
|
1 baths 3 beds |
show details | |

|
#12
N Audubon Dr
Albany, GA 31707
|
2,675 sq. feet
|
2 baths 3 beds |
show details | |

|
#13
7th Ave
Albany, GA 31701
|
3,279 sq. feet
|
2 baths 3 beds |
show details | |

|
#14
Melrose Dr
Albany, GA 31707
|
1,219 sq. feet
|
1 baths 3 beds |
show details | |

|
#15
Sharon Dr
Albany, GA 31707
|
2,318 sq. feet
|
1 baths 3 beds |
show details | |

|
#16
Lily Pond Rd
Albany, GA 31701
|
2,038 sq. feet
|
2 baths 4 beds |
show details | |

|
#17
Stagecoach Rd
Albany, GA 31705
|
1,470 sq. feet
|
1 baths 3 beds |
show details | |

|
#18
10th Ave
Albany, GA 31707
|
1,674 sq. feet
|
2 baths 3 beds |
show details | |

|
#19
Vine Ln
Albany, GA 31721
|
3,112 sq. feet
|
2 baths 4 beds |
show details | |

|
#20
Devon Dr
Albany, GA 31721
|
2,172 sq. feet
|
2 baths 3 beds |
show details |
| Photo | Address | Area | Beds / Baths | Price | Details |
|---|---|---|---|---|---|

|
#21
Pembroke Dr
Albany, GA 31707
|
1,402 sq. feet
|
1 baths 3 beds |
show details | |

|
#22
Nichols St
Albany, GA 31705
|
1,425 sq. feet
|
1 baths 3 beds |
show details | |

|
#23
W Gordon Ave
Albany, GA 31707
|
950 sq. feet
|
1 baths 2 beds |
show details | |

|
#24
Lockett Station Rd
Albany, GA 31721
|
1,791 sq. feet
|
2 baths 3 beds |
show details | |

|
#25
W Oglethorpe Ave
Albany, GA 31707
|
1,080 sq. feet
|
1 baths 3 beds |
show details | |

|
#26
W Mercer Ave
Albany, GA 31701
|
676 sq. feet
|
1 baths 2 beds |
show details | |

|
#27
Beachview Dr
Albany, GA 31705
|
1,684 sq. feet
|
2 baths 3 beds |
show details | |

|
#28
Mciver Dr
Albany, GA 31705
|
1,554 sq. feet
|
2 baths 3 beds |
show details | |

|
#29
Larkspur Dr
Albany, GA 31721
|
3,235 sq. feet
|
3 baths 4 beds |
show details | |

|
#30
Newcastle Ln
Albany, GA 31701
|
1,125 sq. feet
|
1 baths 3 beds |
show details |
| Photo | Address | Area | Beds / Baths | Price | Details |
|---|---|---|---|---|---|

|
#31
Twinflower Rd
Albany, GA 31701
|
1,848 sq. feet
|
1 baths 3 beds |
show details | |

|
#32
Saint Andrews Dr
Albany, GA 31707
|
1,551 sq. feet
|
2 baths 3 beds |
show details | |

|
#33
Stuart Ave
Albany, GA 31707
|
1,934 sq. feet
|
2 baths 4 beds |
show details | |

|
#34
Goodall Ave
Albany, GA 31705
|
1,161 sq. feet
|
2 baths 3 beds |
show details | |

|
#35
Somerset Dr
Albany, GA 31721
|
2,123 sq. feet
|
2 baths 3 beds |
show details | |

|
#36
Branch Rd
Albany, GA 31705
|
1,968 sq. feet
|
2 baths 4 beds |
show details | |

|
#37
Hilltop Dr
Albany, GA 31707
|
1,924 sq. feet
|
2 baths 3 beds |
show details | |

|
#38
Raybun Ct
Albany, GA 31721
|
1,484 sq. feet
|
2 baths 3 beds |
show details | |

|
#39
Shelton Dr
Albany, GA 31705
|
1,415 sq. feet
|
2 baths 3 beds |
show details | |

|
#40
Pinyon Dr
Albany, GA 31721
|
1,723 sq. feet
|
2 baths 3 beds |
show details |
| Photo | Address | Area | Beds / Baths | Price | Details |
|---|---|---|---|---|---|

|
#41
W 4th Ave
Albany, GA 31701
|
1,403 sq. feet
|
2 baths 3 beds |
show details | |

|
#42
16th Ave
Albany, GA 31701
|
1,254 sq. feet
|
1 baths 3 beds |
show details | |

|
#43
Vintage Rd
Albany, GA 31705
|
1,404 sq. feet
|
2 baths 3 beds |
show details | |

|
#44
Enterprise Dr
Albany, GA 31705
|
1,690 sq. feet
|
2 baths 4 beds |
show details | |

|
#45
Shelton Dr
Albany, GA 31705
|
1,826 sq. feet
|
2 baths 3 beds |
show details | |

|
#46
Liverpool Ct
Albany, GA 31707
|
2,088 sq. feet
|
2 baths 3 beds |
show details | |

|
#47
Mccoy Ln
Albany, GA 31701
|
1,242 sq. feet
|
2 baths 3 beds |
show details | |

|
#48
Chateau Dr
Albany, GA 31721
|
3,674 sq. feet
|
2 baths 3 beds |
show details | |

|
#49
Woodstone Cir
Albany, GA 31701
|
1,250 sq. feet
|
2 baths 3 beds |
show details | |

|
Check over 1 million property listings on Foreclosure.com!
|
browse all offers | |||

Latest news about housing in Albany, GA collected exclusively by city-data.com from local newspapers, TV, and radio stations

 | Is there any slowdown in housing yet? (76 replies) |
| Assisted living facility in DT Albany could be turned into luxury apartments (1 reply) |
| Albany VS Valdosta (31 replies) |
| Is Albany, GA, a good place to live? (22 replies) |
| Albany vs Valdosta Which is the anchor of SW Georgia? (50 replies) |
| New Job in Albany, GA (20 replies) |

Median year apartment built: 1978
Household type by relationship:
Households: 67,922- Male householders: 10,740 (3,788 living alone), Female householders: 16,868 (5,006 living alone)
6,961 spouses (6,564 opposite-sex spouses), 2,859 unmarried partners, (2,708 opposite-sex unmarried partners), 19,803 children (19,572 natural, 23 adopted, 208 stepchildren), 2,492 grandchildren, 1,211 brothers or sisters, 509 parents, 140 foster children, 2,124 other relatives, 569 non-relatives
- In group quarters: 3,646
Size of family households: 6,822 2-persons, 4,597 3-persons, 3,520 4-persons, 958 5-persons, 849 6-persons, 295 7-or-more-persons.
Size of nonfamily households: 8,794 1-person, 1,726 2-persons, 47 3-persons.
5,126 married couples with children.
9,235 single-parent households (977 men, 8,258 women).
95.8% of residents of Albany speak English at home.
2.4% of residents speak Spanish at home (69% speak English very well, 20% speak English well, 8% speak English not well, 3% don't speak English at all).
0.7% of residents speak other Indo-European language at home (83% speak English very well, 4% speak English well, 12% speak English not well).
0.6% of residents speak Asian or Pacific Island language at home (61% speak English very well, 24% speak English well, 15% speak English not well).
0.3% of residents speak other language at home (95% speak English very well, 5% speak English not well).
Foreign born population: 1,687 (2.5%)
(11.7% of them are naturalized citizens)
| Here: | 6.3 |
| State: | 6.8 |
| Here: | 4.9 |
| State: | 4.6 |

- Bedrooms in owner-occupied houses and condos in Albany, Georgia
- 48no bedroom
- 01 bedroom
- 1,7552 bedrooms
- 6,9553 bedrooms
- 2,3744 bedrooms
- 1715+ bedrooms

- Bedrooms in renter-occupied apartments in Albany, Georgia
- 402no bedroom
- 2,5591 bedroom
- 5,9242 bedrooms
- 7,1983 bedrooms
- 2224 bedrooms
- 05+ bedrooms

- Cars and other vehicles available in Albany in owner-occupied houses/condos
- 270no vehicle
- 4,0061 vehicle
- 4,9432 vehicles
- 1,4513 vehicles
- 4044 vehicles
- 2295+ vehicles

- Cars and other vehicles available in Albany in renter-occupied apartments
- 3,400no vehicle
- 7,9161 vehicle
- 3,7192 vehicles
- 1,1003 vehicles
- 1704 vehicles
- 05+ vehicles

- Rooms in owner-occupied houses in Albany, Georgia
- 01 room
- 482 rooms
- 1123 rooms
- 3064 rooms
- 2,2965 rooms
- 3,6166 rooms
- 1,9707 rooms
- 1,9318 rooms
- 1,0249+ rooms

- Rooms in renter-occupied apartments in Albany, Georgia
- 2151 room
- 1,0222 rooms
- 1,7263 rooms
- 4,0694 rooms
- 2,8795 rooms
- 4,3476 rooms
- 8967 rooms
- 2898 rooms
- 8629+ rooms


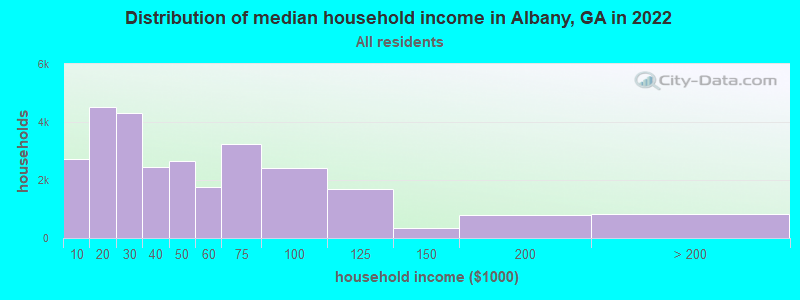
Albany, GA household income distribution

- 2,711Less than $10,000
- 4,515$10,000 to $19,999
- 4,295$20,000 to $29,999
- 2,437$30,000 to $39,999
- 2,646$40,000 to $49,999
- 1,768$50,000 to $59,999
- 3,225$60,000 to $74,999
- 2,398$75,000 to $99,999
- 1,676$100,000 to $124,999
- 338$125,000 to $149,999
- 780$150,000 to $199,999
- 819$200,000 or more
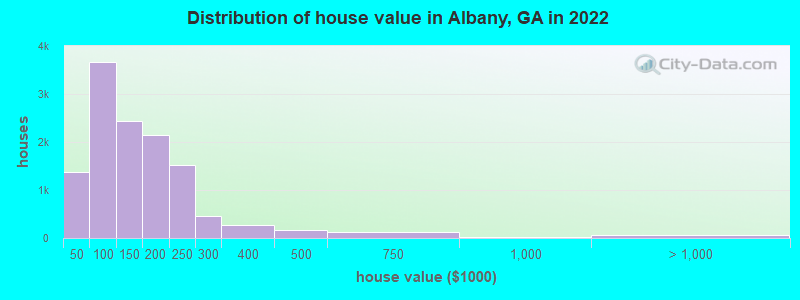
Home value of owner - occupied houses in 2022 in Albany, GA
-
- 93Less than $10,000
- 270$10,000 to $14,999
- 142$15,000 to $19,999
- 224$20,000 to $24,999
- 139$25,000 to $29,999
- 181$30,000 to $34,999
- 92$35,000 to $39,999
- 222$40,000 to $49,999
- 578$50,000 to $59,999
- 759$60,000 to $69,999
- 380$70,000 to $79,999
- 1,081$80,000 to $89,999
- 650$90,000 to $99,999
- 1,671$100,000 to $124,999
- 774$125,000 to $149,999
- 1,238$150,000 to $174,999
- 916$175,000 to $199,999
- 1,515$200,000 to $249,999
- 457$250,000 to $299,999
- 262$300,000 to $399,999
- 157$400,000 to $499,999
- 123$500,000 to $749,999
- 20$750,000 to $999,999
- 31$1,000,000 to $1,499,999
- 36$2,000,000 or more
Rent paid by renters in 2022 in Albany, GA
-
- 410Less than $100
- 24$100 to $149
- 364$200 to $249
- 896$250 to $299
- 559$300 to $349
- 701$350 to $399
- 798$400 to $449
- 1,452$450 to $499
- 1,160$500 to $549
- 1,018$550 to $599
- 1,220$600 to $649
- 819$650 to $699
- 1,656$700 to $749
- 961$750 to $799
- 1,057$800 to $899
- 1,952$900 to $999
- 740$1,000 to $1,249
- 32$1,250 to $1,499
- 116$1,500 to $1,999
- 370No cash rent


Percentage of workers working in this county: 80.8%
Number of people working at home: 1,924 (7.1% of all workers)
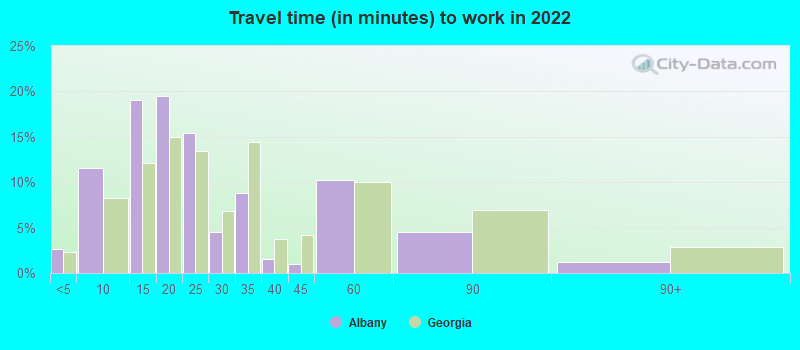
Travel time to work (commute)
- Less than 5 minutes: 806
- 5 to 9 minutes: 3,399
- 10 to 14 minutes: 5,074
- 15 to 19 minutes: 4,880
- 20 to 24 minutes: 4,255
- 25 to 29 minutes: 836
- 30 to 34 minutes: 1,183
- 35 to 39 minutes: 114
- 40 to 44 minutes: 366
- 45 to 59 minutes: 2,088
- 60 to 89 minutes: 830
- 90 or more minutes: 546
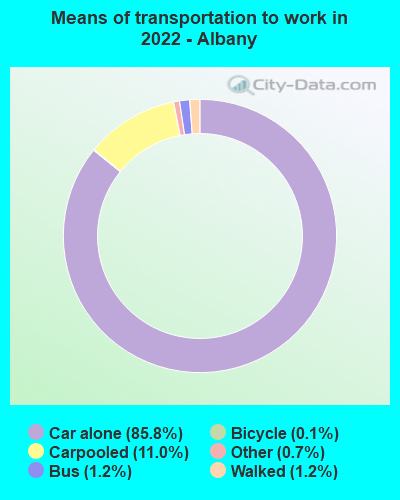
Means of transportation to work:
- Drove a car alone: 31,364 (78.7%)
- Carpooled: 4,188 (10.5%)
- Bus: 351 (0.9%)
- Taxi: 254 (0.6%)
- Bicycle: 54 (0.1%)
- Walked: 445 (1.1%)
- Worked at home: 1,924 (4.8%)

- Unemployment by race in 2022
- Unemployment rate for White non-Hispanic residents
- 11.2%Males
- Unemployment rate for Black residents
- 14.1%Males
- 12.1%Females
- Unemployment rate for two or more race residents
- 0.6%Males
- 5.6%Females
- Unemployment rate for Hispanic or Latino residents
- 2.9%Females

- Year of entry for the foreign-born population in Albany, Georgia
- 5232010 or later
- 3232000 to 2009
- 2421990 to 1999
- 2081980 to 1989
- 1201970 to 1979
- 187Before 1970

First ancestries reported:
- American: 3,415 (7.3%)
- English: 1,512 (3.2%)
- African: 863 (1.8%)
- Irish: 719 (1.5%)
- Haitian: 461 (1.0%)
- German: 435 (0.9%)
- Italian: 214 (0.5%)
- Scotch-Irish: 185 (0.4%)
- Czech: 125 (0.3%)
- Scottish: 122 (0.3%)
- European: 93 (0.2%)
- Polish: 84 (0.2%)
- French: 58 (0.1%)
- British: 51 (0.1%)
- Scandinavian: 47 (0.1%)
- Greek: 45 (0.10%)
- Jamaican: 44 (0.09%)
- Australian: 26 (0.06%)
- Afghan: 24 (0.05%)
- Kenyan: 24 (0.05%)
- Dutch: 18 (0.04%)
- Swedish: 17 (0.04%)
- Lebanese: 17 (0.04%)
- West Indian: 17 (0.04%)
- Nigerian: 15 (0.03%)
- Egyptian: 13 (0.03%)
- Danish: 10 (0.02%)
- Trinidadian and Tobagonian: 10 (0.02%)
- Ethiopian: 9 (0.02%)
- Welsh: 9 (0.02%)
- Norwegian: 8 (0.02%)
- Hungarian: 8 (0.02%)
- Yugoslavian: 8 (0.02%)
- Russian: 6 (0.01%)
- Barbadian: 6 (0.01%)
- U.S. Virgin Islander: 6 (0.01%)
Most common places of birth for foreign-born residents (%):
| Albany: | 18.0% (227) |
| Georgia: | 20.0% (223,400) |
| Albany: | 11.1% (140) |
| Georgia: | 3.6% (39,974) |
| Albany: | 9.6% (121) |
| Georgia: | 3.5% (39,227) |
| Albany: | 5.1% (64) |
| Georgia: | 4.1% (45,797) |
| Albany: | 4.8% (61) |
| Georgia: | 2.5% (27,846) |
| Albany: | 4.5% (57) |
| Georgia: | 0.4% (4,046) |
| Albany: | 4.2% (53) |
| Georgia: | 2.5% (27,794) |
| Albany: | 3.5% (44) |
| Georgia: | 1.1% (11,847) |
| Albany: | 3.3% (42) |
| Georgia: | 0.4% (4,350) |
| Albany: | 3.3% (41) |
| Georgia: | 0.2% (2,278) |
| Albany: | 3.3% (41) |
| Georgia: | 4.6% (51,270) |
| Albany: | 3.1% (39) |
| Georgia: | 0.2% (1,849) |
| Albany: | 3.0% (38) |
| Georgia: | 0.8% (8,613) |
| Albany: | 2.5% (32) |
| Georgia: | 1.7% (18,651) |
| Albany: | 2.5% (31) |
| Georgia: | 1.0% (11,747) |
| Albany: | 2.3% (29) |
| Georgia: | 0.6% (6,963) |
| Albany: | 2.1% (27) |
| Georgia: | 0.4% (5,023) |
| Albany: | 2.1% (26) |
| Georgia: | 3.9% (43,756) |
| Albany: | 2.0% (25) |
| Georgia: | 0.8% (8,684) |
| Albany: | 1.9% (24) |
| Georgia: | 0.8% (9,101) |
| Albany: | 1.8% (23) |
| Georgia: | 1.6% (17,851) |
| Albany: | 1.6% (20) |
| Georgia: | 1.8% (20,700) |
Place of birth for U.S.-born residents:
- This state: 54,858
- Other state: 11,121
- Northeast: 1,564
- Midwest: 1,346
- South: 7,035
- West: 1,176
85.8% of Albany residents lived in the same house 1 years ago.
Out of people who lived in different houses, 34.5% lived in this county.
Out of people who lived in different counties, 80.1% lived in Georgia.
| Albany: | 85.8% |
| State average: | 86.6% |
Education attainment for males 25 years and older:
- No schooling: 290
- Nursery to 4th grade: 197
- 5th and 6th grade: 100
- 7th and 8th grade: 316
- 9th grade: 134
- 10th grade: 633
- 11th grade: 572
- 12th grade, no diploma: 600
- High school graduate (or equivalency): 5,693
- Less than 1 year of college: 1,082
- Some college more than 1 year, no degree: 2,172
- Associate degree: 2,375
- Bachelor's degree: 2,139
- Master's degree: 1,654
- Professional school degree: 75
- Doctorate degree: 418

Education attainment for females 25 years and older:
- No schooling: 199
- Nursery to 4th grade: 181
- 5th and 6th grade: 0
- 7th and 8th grade: 266
- 9th grade: 629
- 10th grade: 553
- 11th grade: 260
- 12th grade, no diploma: 465
- High school graduate (or equivalency): 5,918
- Less than 1 year of college: 1,659
- Some college more than 1 year, no degree: 4,908
- Associate degree: 3,224
- Bachelor's degree: 3,087
- Master's degree: 2,819
- Professional school degree: 634
- Doctorate degree: 393


Housing units in structures:
- One, detached: 18,926
- One, attached: 1,352
- Two: 4,046
- 3 or 4: 2,725
- 5 to 9: 2,900
- 10 to 19: 1,390
- 20 to 49: 253
- 50 or more: 603
- Mobile homes: 1,032
Median worth of mobile homes: $60,684
Housing units lacking complete kitchen facilities in 2022: 10.6%
House/condo owner moved in on average 17 years ago
Renter moved in on average 3 years ago

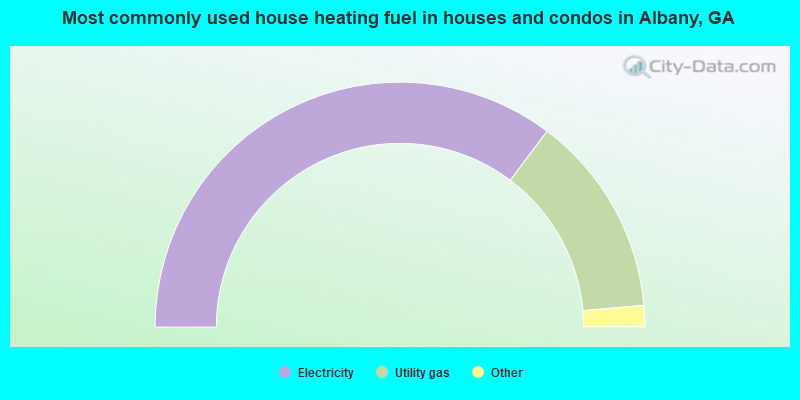
- 70.6%Electricity
- 26.7%Utility gas
- 1.4%No fuel used
- 1.1%Bottled, tank, or LP gas
- 0.3%Other fuel
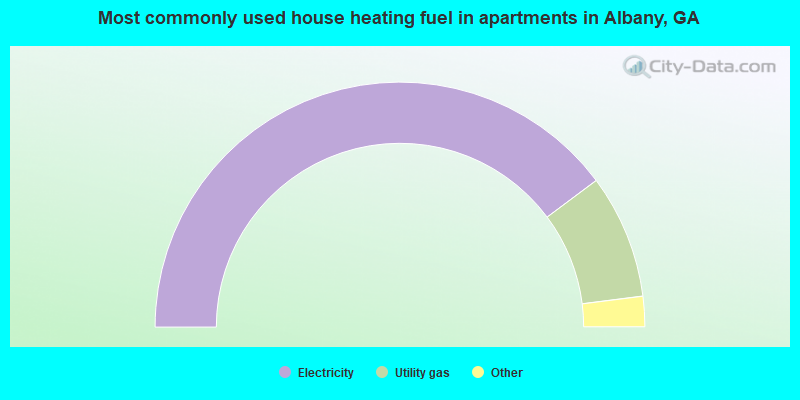
- 79.6%Electricity
- 16.4%Utility gas
- 2.3%Bottled, tank, or LP gas
- 1.6%No fuel used
- 0.2%Other fuel
Private vs. public school enrollment:
| Here: | 13.7% |
| Georgia: | 12.1% |
| Here: | 9.1% |
| Georgia: | 10.8% |
| Here: | 11.2% |
| Georgia: | 17.1% |


