Races in Albany, Georgia (GA) Detailed Stats
Data:
Races - White alone (%)
Races - White alone (% change since 2000)
Races - Black alone (%)
Races - Black alone (% change since 2000)
Races - American Indian alone (%)
Races - American Indian alone (% change since 2000)
Races - Asian alone (%)
Races - Asian alone (% change since 2000)
Races - Hispanic (%)
Races - Hispanic (% change since 2000)
Races - Native Hawaiian and Other Pacific Islander alone (%)
Races - Native Hawaiian and Other Pacific Islander alone (% change since 2000)
Races - Two or more races(%)
Races - Two or more races(% change since 2000)
Races - Other race alone (%)
Races - Other race alone (% change since 2000)
Racial diversity
Place of birth - Born in state of residence (%)
Place of birth - Born in state of residence (%) - White
Place of birth - Born in state of residence (%) - Black or African American
Place of birth - Born in state of residence (%) - Asian
Place of birth - Born in state of residence (%) - Hispanic or Latino
Place of birth - Born in state of residence (%) - American Indian and Alaska Native
Place of birth - Born in state of residence (%) - Multirace
Place of birth - Born in state of residence (%) - Other Race
Place of birth - Born in other state (%)
Place of birth - Born in other state (%) - White
Place of birth - Born in other state (%) - Black or African American
Place of birth - Born in other state (%) - Asian
Place of birth - Born in other state (%) - Hispanic or Latino
Place of birth - Born in other state (%) - American Indian and Alaska Native
Place of birth - Born in other state (%) - Multirace
Place of birth - Born in other state (%) - Other Race
Place of birth - Native, outside of US (%)
Place of birth - Native, outside of US (%) - White
Place of birth - Native, outside of US (%) - Black or African American
Place of birth - Native, outside of US (%) - Asian
Place of birth - Native, outside of US (%) - Hispanic or Latino
Place of birth - Native, outside of US (%) - American Indian and Alaska Native
Place of birth - Native, outside of US (%) - Multirace
Place of birth - Native, outside of US (%) - Other Race
Place of birth - Foreign born (%)
Place of birth - Foreign born (%) - White
Place of birth - Foreign born (%) - Black or African American
Place of birth - Foreign born (%) - Asian
Place of birth - Foreign born (%) - Hispanic or Latino
Place of birth - Foreign born (%) - American Indian and Alaska Native
Place of birth - Foreign born (%) - Multirace
Place of birth - Foreign born (%) - Other Race
Residents speaking English at home (%)
Residents speaking English at home - Born in the United States (%)
Residents speaking English at home - Native, born elsewhere (%)
Residents speaking English at home - Foreign born (%)
Residents speaking Spanish at home (%)
Residents speaking Spanish at home - Born in the United States (%)
Residents speaking Spanish at home - Native, born elsewhere (%)
Residents speaking Spanish at home - Foreign born (%)
Residents speaking other language at home (%)
Residents speaking other language at home - Born in the United States (%)
Residents speaking other language at home - Native, born elsewhere (%)
Residents speaking other language at home - Foreign born (%)
Marital status - Never married (%)
Marital status - Now married (%)
Marital status - Separated (%)
Marital status - Widowed (%)
Marital status - Divorced (%)
Ancestries Reported - Arab (%)
Ancestries Reported - Czech (%)
Ancestries Reported - Danish (%)
Ancestries Reported - Dutch (%)
Ancestries Reported - English (%)
Ancestries Reported - French (%)
Ancestries Reported - French Canadian (%)
Ancestries Reported - German (%)
Ancestries Reported - Greek (%)
Ancestries Reported - Hungarian (%)
Ancestries Reported - Irish (%)
Ancestries Reported - Italian (%)
Ancestries Reported - Lithuanian (%)
Ancestries Reported - Norwegian (%)
Ancestries Reported - Polish (%)
Ancestries Reported - Portuguese (%)
Ancestries Reported - Russian (%)
Ancestries Reported - Scotch-Irish (%)
Ancestries Reported - Scottish (%)
Ancestries Reported - Slovak (%)
Ancestries Reported - Subsaharan African (%)
Ancestries Reported - Swedish (%)
Ancestries Reported - Swiss (%)
Ancestries Reported - Ukrainian (%)
Ancestries Reported - United States (%)
Ancestries Reported - Welsh (%)
Ancestries Reported - West Indian (%)
Ancestries Reported - Other (%)
Geographical mobility - Same house 1 year ago (%)
Geographical mobility - Same house 1 year ago (%) - White
Geographical mobility - Same house 1 year ago (%) - Black or African American
Geographical mobility - Same house 1 year ago (%) - Asian
Geographical mobility - Same house 1 year ago (%) - Hispanic or Latino
Geographical mobility - Same house 1 year ago (%) - American Indian and Alaska Native
Geographical mobility - Same house 1 year ago (%) - Multirace
Geographical mobility - Same house 1 year ago (%) - Other Race
Geographical mobility - Moved within same county (%)
Geographical mobility - Moved within same county (%) - White
Geographical mobility - Moved within same county (%) - Black or African American
Geographical mobility - Moved within same county (%) - Asian
Geographical mobility - Moved within same county (%) - Hispanic or Latino
Geographical mobility - Moved within same county (%) - American Indian and Alaska Native
Geographical mobility - Moved within same county (%) - Multirace
Geographical mobility - Moved within same county (%) - Other Race
Geographical mobility - Moved from different county within same state (%)
Geographical mobility - Moved from different county within same state (%) - White
Geographical mobility - Moved from different county within same state (%) - Black or African American
Geographical mobility - Moved from different county within same state (%) - Asian
Geographical mobility - Moved from different county within same state (%) - Hispanic or Latino
Geographical mobility - Moved from different county within same state (%) - American Indian and Alaska Native
Geographical mobility - Moved from different county within same state (%) - Multirace
Geographical mobility - Moved from different county within same state (%) - Other Race
Geographical mobility - Moved from different state (%)
Geographical mobility - Moved from different state (%) - White
Geographical mobility - Moved from different state (%) - Black or African American
Geographical mobility - Moved from different state (%) - Asian
Geographical mobility - Moved from different state (%) - Hispanic or Latino
Geographical mobility - Moved from different state (%) - American Indian and Alaska Native
Geographical mobility - Moved from different state (%) - Multirace
Geographical mobility - Moved from different state (%) - Other Race
Geographical mobility - Moved from abroad (%)
Geographical mobility - Moved from abroad (%) - White
Geographical mobility - Moved from abroad (%) - Black or African American
Geographical mobility - Moved from abroad (%) - Asian
Geographical mobility - Moved from abroad (%) - Hispanic or Latino
Geographical mobility - Moved from abroad (%) - American Indian and Alaska Native
Geographical mobility - Moved from abroad (%) - Multirace
Geographical mobility - Moved from abroad (%) - Other Race
Place of birth for the foreign-born population - Ireland (%)
Place of birth for the foreign-born population - Denmark (%)
Place of birth for the foreign-born population - Norway (%)
Place of birth for the foreign-born population - Sweden (%)
Place of birth for the foreign-born population - United Kingdom (%)
Place of birth for the foreign-born population - England (%)
Place of birth for the foreign-born population - Scotland (%)
Place of birth for the foreign-born population - Other Northern Europe (%)
Place of birth for the foreign-born population - Austria (%)
Place of birth for the foreign-born population - Belgium (%)
Place of birth for the foreign-born population - France (%)
Place of birth for the foreign-born population - Germany (%)
Place of birth for the foreign-born population - Netherlands (%)
Place of birth for the foreign-born population - Switzerland (%)
Place of birth for the foreign-born population - Other Western Europe (%)
Place of birth for the foreign-born population - Greece (%)
Place of birth for the foreign-born population - Italy (%)
Place of birth for the foreign-born population - Portugal (%)
Place of birth for the foreign-born population - Spain (%)
Place of birth for the foreign-born population - Other Southern Europe (%)
Place of birth for the foreign-born population - Albania (%)
Place of birth for the foreign-born population - Belarus (%)
Place of birth for the foreign-born population - Bosnia and Herzegovina (%)
Place of birth for the foreign-born population - Bulgaria (%)
Place of birth for the foreign-born population - Croatia (%)
Place of birth for the foreign-born population - Czechoslovakia (%)
Place of birth for the foreign-born population - Hungary (%)
Place of birth for the foreign-born population - Latvia (%)
Place of birth for the foreign-born population - Lithuania (%)
Place of birth for the foreign-born population - North Macedonia (Macedonia) (%)
Place of birth for the foreign-born population - Moldova (%)
Place of birth for the foreign-born population - Poland (%)
Place of birth for the foreign-born population - Romania (%)
Place of birth for the foreign-born population - Russia (%)
Place of birth for the foreign-born population - Serbia (%)
Place of birth for the foreign-born population - Ukraine (%)
Place of birth for the foreign-born population - Other Eastern Europe (%)
Place of birth for the foreign-born population - China (%)
Place of birth for the foreign-born population - Hong Kong (%)
Place of birth for the foreign-born population - Taiwan (%)
Place of birth for the foreign-born population - Japan (%)
Place of birth for the foreign-born population - Korea (%)
Place of birth for the foreign-born population - Other Eastern Asia (%)
Place of birth for the foreign-born population - Afghanistan (%)
Place of birth for the foreign-born population - Bangladesh (%)
Place of birth for the foreign-born population - India (%)
Place of birth for the foreign-born population - Iran (%)
Place of birth for the foreign-born population - Kazakhstan (%)
Place of birth for the foreign-born population - Nepal (%)
Place of birth for the foreign-born population - Pakistan (%)
Place of birth for the foreign-born population - Sri Lanka (%)
Place of birth for the foreign-born population - Uzbekistan (%)
Place of birth for the foreign-born population - Other South Central Asia (%)
Place of birth for the foreign-born population - Burma (%)
Place of birth for the foreign-born population - Cambodia (%)
Place of birth for the foreign-born population - Indonesia (%)
Place of birth for the foreign-born population - Laos (%)
Place of birth for the foreign-born population - Malaysia (%)
Place of birth for the foreign-born population - Philippines (%)
Place of birth for the foreign-born population - Singapore (%)
Place of birth for the foreign-born population - Thailand (%)
Place of birth for the foreign-born population - Vietnam (%)
Place of birth for the foreign-born population - Other South Eastern Asia (%)
Place of birth for the foreign-born population - Armenia (%)
Place of birth for the foreign-born population - Iraq (%)
Place of birth for the foreign-born population - Israel (%)
Place of birth for the foreign-born population - Jordan (%)
Place of birth for the foreign-born population - Kuwait (%)
Place of birth for the foreign-born population - Lebanon (%)
Place of birth for the foreign-born population - Saudi Arabia (%)
Place of birth for the foreign-born population - Syria (%)
Place of birth for the foreign-born population - Turkey (%)
Place of birth for the foreign-born population - Yemen (%)
Place of birth for the foreign-born population - Other Western Asia (%)
Place of birth for the foreign-born population - Eritrea (%)
Place of birth for the foreign-born population - Ethiopia (%)
Place of birth for the foreign-born population - Kenya (%)
Place of birth for the foreign-born population - Somalia (%)
Place of birth for the foreign-born population - Uganda (%)
Place of birth for the foreign-born population - Zimbabwe (%)
Place of birth for the foreign-born population - Other Eastern Africa (%)
Place of birth for the foreign-born population - Cameroon (%)
Place of birth for the foreign-born population - Congo (%)
Place of birth for the foreign-born population - Democratic Republic of Congo (Zaire) (%)
Place of birth for the foreign-born population - Other Middle Africa (%)
Place of birth for the foreign-born population - Egypt (%)
Place of birth for the foreign-born population - Morocco (%)
Place of birth for the foreign-born population - Sudan (%)
Place of birth for the foreign-born population - Other Northern Africa (%)
Place of birth for the foreign-born population - South Africa (%)
Place of birth for the foreign-born population - Other Southern Africa (%)
Place of birth for the foreign-born population - Cabo Verde (%)
Place of birth for the foreign-born population - Ghana (%)
Place of birth for the foreign-born population - Liberia (%)
Place of birth for the foreign-born population - Nigeria (%)
Place of birth for the foreign-born population - Senegal (%)
Place of birth for the foreign-born population - Sierra Leone (%)
Place of birth for the foreign-born population - Other Western Africa (%)
Place of birth for the foreign-born population - Australia (%)
Place of birth for the foreign-born population - New Zealand (%)
Place of birth for the foreign-born population - Fiji (%)
Place of birth for the foreign-born population - Micronesia (%)
Place of birth for the foreign-born population - Bahamas (%)
Place of birth for the foreign-born population - Barbados (%)
Place of birth for the foreign-born population - Cuba (%)
Place of birth for the foreign-born population - Dominica (%)
Place of birth for the foreign-born population - Dominican Republic (%)
Place of birth for the foreign-born population - Grenada (%)
Place of birth for the foreign-born population - Haiti (%)
Place of birth for the foreign-born population - Jamaica (%)
Place of birth for the foreign-born population - St. Vincent and the Grenadines (%)
Place of birth for the foreign-born population - Trinidad and Tobago (%)
Place of birth for the foreign-born population - West Indies (%)
Place of birth for the foreign-born population - Other Caribbean (%)
Place of birth for the foreign-born population - Belize (%)
Place of birth for the foreign-born population - Costa Rica (%)
Place of birth for the foreign-born population - El Salvador (%)
Place of birth for the foreign-born population - Guatemala (%)
Place of birth for the foreign-born population - Honduras (%)
Place of birth for the foreign-born population - Mexico (%)
Place of birth for the foreign-born population - Nicaragua (%)
Place of birth for the foreign-born population - Panama (%)
Place of birth for the foreign-born population - Other Central America (%)
Place of birth for the foreign-born population - Argentina (%)
Place of birth for the foreign-born population - Bolivia (%)
Place of birth for the foreign-born population - Brazil (%)
Place of birth for the foreign-born population - Chile (%)
Place of birth for the foreign-born population - Colombia (%)
Place of birth for the foreign-born population - Ecuador (%)
Place of birth for the foreign-born population - Guyana (%)
Place of birth for the foreign-born population - Peru (%)
Place of birth for the foreign-born population - Uruguay (%)
Place of birth for the foreign-born population - Venezuela (%)
Place of birth for the foreign-born population - Other South America (%)
Place of birth for the foreign-born population - Canada (%)
Place of birth for the foreign-born population - Other Northern America (%)
Place of birth for the foreign-born population - Other (%)
Latest news about races in Albany, GA collected exclusively by city-data.com from local newspapers, TV, and radio stations
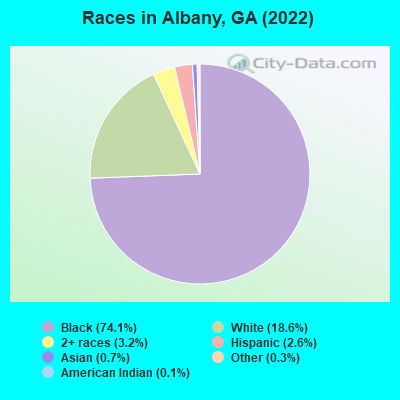
According to 2022 data, the most numerous races in Albany, GA are White alone (13,037 residents), Black alone (52,012 residents), and Hispanic (1,806 residents). 95.8% of Albany residents speak English at home. 1.9% of Albany, GA residents are foreign-born , which is 434.1% less than the foreign-born rate of 10.0% across the entire state of Georgia.
Race distribution in Albany
2000 2022
5,128,661 62.6% White alone 2,331,465 28.5% Black alone 435,227 5.3% Hispanic 171,513 2.1% Asian alone 87,364 1.1% Two or more races 17,670 0.2% American Indian alone 11,275 0.1% Other race alone 3,278 0.04% Native Hawaiian and Other
5,415,657 49.6% White alone 3,349,240 30.7% Black alone 1,132,604 10.4% Hispanic 479,156 4.4% Asian alone 462,923 4.2% Two or more races 54,416 0.5% Other race alone 11,923 0.1% American Indian alone 6,957 0.06% Native Hawaiian and Other
Income and house value in Albany Median household income in 2022 $51,928 White non-Hispanic householders$33,196 Black householders$17,073 Some other race householders$68,850 Two or more races householders$28,679 Hispanic or Latino race householdersMedian 2022 house value $138,247 White Non-Hispanic householders$89,264 Black or African American householders$136,958 American Indian or Alaska Native householders $290,673 Asian householders$135,669 Some other race householders$166,122 Two or more races householders$181,268 Hispanic or Latino householders
Median age by race in Albany
54.7 Median age for White residents52.6 56.8 31.9 Median age for Black or African American residents27.0 34.7 47.2 Median age for American Indian / Alaska Native residents-666,666,666.0 -666,666,666.0 62.1 Median age for Asian residents-666,666,666.0 -666,666,666.0 -666,666,666.0 Median age for Native Hawaiian / Pacific Islander residents-666,666,666.0 -666,666,666.0 32.4 Median age for Other race residents29.3 33.8 31.8 Median age for Two or more races residents42.0 19.1 55.1 Median age for White alone residents53.0 58.5 31.0 Median age for Hispanic or Latino residents29.5 32.9
Owner/renter occupied households by race in Albany
House owners and renters - White residents 3,436 64.7% Owner occupied1,872 35.3% Renter occupiedHouse owners and renters - Black or African American residents 7,574 36.5% Owner occupied13,183 63.5% Renter occupiedHouse owners and renters - American Indian / Alaska Native residents 6 9.7% Owner occupied54 90.3% Renter occupiedHouse owners and renters - Asian residents 90 34.5% Owner occupied171 65.5% Renter occupiedHouse owners and renters - Native Hawaiian / Pacific Islander residents 33 100.0% Owner occupiedHouse owners and renters - Other race residents 95 28.4% Owner occupied238 71.6% Renter occupiedHouse owners and renters - Two or more races residents 202 27.9% Owner occupied522 72.1% Renter occupiedHouse owners and renters - White alone residents 3,383 64.4% Owner occupied1,872 35.6% Renter occupiedHouse owners and renters - Hispanic or Latino residents 58 13.9% Owner occupied361 86.1% Renter occupied
Language usage in Albany
English speakers - Total 95.8% of residents of Albany speak English at home.
2.3% of residents speak Spanish at home 1,065 69.3% Speak English very well472 30.7% Speak English less than very well1.5% of residents speak other language at home 774 76.6% Speak English very well236 23.4% Speak English less than very well
English speakers - Born in the United States 94.4% of residents of Albany speak English at home.
2.7% of residents speak Spanish at home 241 67.3% Speak English very well117 32.7% Speak English less than very well3.0% of residents speak other language at home 334 84.6% Speak English very well61 15.4% Speak English less than very well
English speakers - Native, born elsewhere 74.2% of residents of Albany speak English at home.
5.8% of residents speak Spanish at home 19 100.0% Speak English very well18.4% of residents speak other language at home 45 75.0% Speak English very well15 25.0% Speak English less than very well
English speakers - Foreign-born 26.1% of residents of Albany speak English at home.
44.0% of residents speak Spanish at home 294 53.1% Speak English very well260 46.9% Speak English less than very well29.4% of residents speak other language at home 227 61.4% Speak English very well143 38.6% Speak English less than very well
White (Caucasian) - Speak only English Native:
100.0% (12,386)Foreign-born:
59.8% (58)
White (Caucasian) - Speak another language Native:
0.6% (74)Foreign-born:
49.4% (47)
Black or African American - Speak only English Native:
98.0% (47,100)Foreign-born:
58.2% (176)
Black or African American - Speak another language Native:
2.0% (960)Foreign-born:
41.3% (125)
American Indian / Alaska Native - Speak only English Native:
95.0% (71)Foreign-born:
23.9% (42)
Asian - Speak only English Native:
34.1% (94)Foreign-born:
4.5% (11)
Asian - Speak another language Native:
66.8% (184)Foreign-born:
96.2% (237)
Other race - Speak another language Native:
29.8% (139)Foreign-born:
90.6% (406)
Two or more races - Speak only English Native:
86.0% (1,913)Foreign-born:
30.0% (77)
Two or more races - Speak another language Native:
14.2% (316)Foreign-born:
70.7% (181)
White alone - Speak only English Native:
99.3% (12,304)Foreign-born:
74.9% (63)
White alone - Speak another language Native:
0.8% (96)Foreign-born:
25.4% (22)
Hispanic or Latino - Speak another language Native:
56.7% (411)Foreign-born:
100.0% (900)
Foreign-born residents in Albany 1,259 residents are foreign born
This city:
1.9%Georgia:
10.4%
Marital status for residents in Albany Marital status - White (Caucasian) population 15 years and over
Males 32.3% Never married54.4% Now married0.8% Separated2.7% Widowed9.8% DivorcedFemales 9.5% Never married50.1% Now married0.0% Separated17.1% Widowed23.2% DivorcedWomen who gave birth in the past 12 months Now married:
53.9% (52)Unmarried:
46.1% (45)
Women who did not give birth in the past 12 months Now married:
42.7% (839)Unmarried:
57.3% (1,124)
Marital status - Black or African American population 15 years and over
Males 51.6% Never married30.4% Now married3.3% Separated3.9% Widowed10.9% DivorcedFemales 42.7% Never married22.6% Now married5.7% Separated11.4% Widowed17.6% DivorcedWomen who gave birth in the past 12 months Now married:
51.8% (606)Unmarried:
48.2% (565)
Women who did not give birth in the past 12 months Now married:
23.2% (3,180)Unmarried:
76.8% (10,554)
Marital status - American Indian / Alaska Native population 15 years and over
Males 47.2% Never married49.4% Now married0.0% Separated0.0% Widowed3.4% DivorcedFemales 40.6% Never married0.0% Now married53.6% Separated0.0% Widowed5.8% DivorcedWomen who gave birth in the past 12 months Now married:
100.0% (21)Unmarried:
0.0% (0)
Women who did not give birth in the past 12 months Now married:
50.0% (38)Unmarried:
50.0% (38)
Marital status - Asian population 15 years and over
Males 58.9% Never married15.0% Now married0.0% Separated0.0% Widowed26.2% DivorcedFemales 64.0% Never married25.8% Now married0.0% Separated0.4% Widowed9.8% DivorcedWomen who did not give birth in the past 12 months Now married:
6.2% (11)Unmarried:
93.8% (172)
Marital status - Native Hawaiian / Pacific Islander population 15 years and over
Males 0.0% Never married100.0% Now married0.0% Separated0.0% Widowed0.0% DivorcedFemales 0.0% Never married66.7% Now married0.0% Separated0.0% Widowed33.3% DivorcedMarital status - Other race population 15 years and over
Males 44.5% Never married19.2% Now married19.6% Separated0.0% Widowed16.7% DivorcedFemales 46.7% Never married36.1% Now married6.6% Separated0.0% Widowed10.6% DivorcedWomen who did not give birth in the past 12 months Now married:
34.7% (89)Unmarried:
65.3% (169)
Marital status - Two or more races population 15 years and over
Males 52.7% Never married40.3% Now married0.0% Separated3.9% Widowed3.1% DivorcedFemales 59.6% Never married21.5% Now married4.9% Separated4.2% Widowed9.9% DivorcedWomen who gave birth in the past 12 months Now married:
0.0% (0)Unmarried:
100.0% (70)
Women who did not give birth in the past 12 months Now married:
26.6% (189)Unmarried:
73.4% (524)
Marital status - White alone, not Hispanic / Latino population 15 years and over
Males 30.7% Never married55.7% Now married0.8% Separated2.7% Widowed10.0% DivorcedFemales 9.6% Never married49.6% Now married0.0% Separated17.3% Widowed23.4% DivorcedWomen who gave birth in the past 12 months Now married:
53.9% (54)Unmarried:
46.1% (46)
Women who did not give birth in the past 12 months Now married:
41.7% (828)Unmarried:
58.3% (1,159)
Marital status - Hispanic or Latino population 15 years and over
Males 59.7% Never married22.0% Now married0.0% Separated0.0% Widowed18.2% DivorcedFemales 55.5% Never married29.0% Now married9.0% Separated0.0% Widowed6.4% DivorcedWomen who gave birth in the past 12 months Now married:
15.7% (14)Unmarried:
84.3% (75)
Women who did not give birth in the past 12 months Now married:
42.4% (147)Unmarried:
57.6% (199)
Ancestries in Albany
3,415 7.3% American1,512 3.2% English863 1.8% African719 1.5% Irish461 1.0% Haitian435 0.9% German214 0.5% Italian185 0.4% Scotch-Irish125 0.3% Czech122 0.3% Scottish93 0.2% European84 0.2% Polish58 0.1% French51 0.1% British47 0.1% Scandinavian45 0.10% Greek44 0.09% Jamaican26 0.06% Australian24 0.05% Afghan24 0.05% Kenyan18 0.04% Dutch17 0.04% Swedish17 0.04% Lebanese17 0.04% West Indian15 0.03% Nigerian13 0.03% Egyptian10 0.02% Danish10 0.02% Trinidadian and Tobagonian9 0.02% Ethiopian9 0.02% Welsh8 0.02% Norwegian8 0.02% Hungarian8 0.02% Yugoslavian6 0.01% Russian6 0.01% Barbadian6 0.01% U.S. Virgin Islander
Geographical mobility in Albany Same house 1 year ago 10,629 87.2% White (Caucasian)44,148 86.2% Black or African American111 48.5% American Indian / Alaska Native459 90.3% Asian43 100.0% Native Hawaiian / Pacific Islander706 76.3% Other race1,788 66.0% Two or more races10,437 87.2% White alone, not Hispanic / Latino974 57.7% Hispanic or LatinoMoved within same county 744 6.1% White / Caucasian3,373 6.6% Black or African American59 25.9% American Indian / Alaska Native69 7.4% Other race212 7.8% Two or more races736 6.1% White alone, not Hispanic / Latino139 8.2% Hispanic or LatinoMoved within same state 440 3.6% White / Caucasian3,302 6.4% Black or African American58 25.3% American Indian / Alaska Native5 1.0% Asian20 2.1% Other race315 11.6% Two or more races406 3.4% White alone, not Hispanic / Latino343 20.4% Hispanic or LatinoMoved from different state 214 1.8% White / Caucasian381 0.7% Black or African American5 2.0% American Indian / Alaska Native26 5.2% Asian43 4.7% Other race331 12.2% Two or more races223 1.9% White alone, not Hispanic / Latino196 11.6% Hispanic or LatinoMoved from abroad 43 0.4% White24 4.7% Asian75 8.1% Other race54 2.0% Two or more races52 0.4% White alone, not Hispanic / Latino83 4.9% Hispanic or Latino
Children Nativity (place of birth) in Albany
Children under 6 years - Living with two parents Both parents native 1,305 100.0% NativeBoth parents foreign-born 50 100.0% NativeOne native, one foreign-born parent 58 100.0% NativeChildren under 6 years - Living with one parent Native parent 3,517 100.0% NativeForeign-born parent 113 100.0% NativeChildren 6 to 17 years - Living with two parents Both parents native 2,354 100.0% NativeBoth parents foreign-born 47 100.0% NativeOne native, one foreign-born parent 221 94.1% Native14 5.9% Foreign-bornChildren 6 to 17 years - Living with one parent Native parent 7,165 100.0% NativeForeign-born parent 178 60.7% Native116 39.3% Foreign-born
Grandparents responsible for own grandchildren in Albany
Grandparents (30 to 59 years) White / Caucasian 73 66.3% Responsible for grandchildren37 33.7% Not responsible for grandchildrenBlack or African American 349 54.2% Responsible for grandchildren295 45.8% Not responsible for grandchildrenTwo or more races 15 100.0% Responsible for grandchildrenWhite alone, not Hispanic / Latino 74 65.5% Responsible for grandchildren39 34.5% Not responsible for grandchildrenGrandparents (60 years and over) White / Caucasian 36 45.2% Responsible for grandchildren44 54.8% Not responsible for grandchildrenBlack or African American 286 45.8% Responsible for grandchildren339 54.2% Not responsible for grandchildrenTwo or more races 7 15.4% Responsible for grandchildren41 84.6% Not responsible for grandchildrenWhite alone, not Hispanic / Latino 36 44.0% Responsible for grandchildren46 56.0% Not responsible for grandchildren