Woodinville: Fire Incidents, Washington (WA)
Where are fire incidents reported in Woodinville, WA
Something went wrong! Please refresh the page.
|
| |||||||||||||||||||||||||||||||||||||||||||||||||||||||||||||||||||||||||||||||||||||||||||||||||||||||||||||
2002 - 2018 National Fire Incident Reporting System (NFIRS) incidents
- Incident types reported to NFIRS in Woodinville, WA
- 3,26655.3%Rescue & EMS
- 86314.6%Good Intent Call
- 59910.1%Fire
- 4788.1%False Alarm
- 3706.3%Hazardous Condition
- 2524.3%Service Call
- 711.2%Special Incident
- Fire incident types reported to NFIRS in Woodinville, WA
- 29148.6%Structure Fires
- 14424.0%Outside Fires
- 9616.0%Mobile Property/Vehicle Fires
- 6811.4%Other
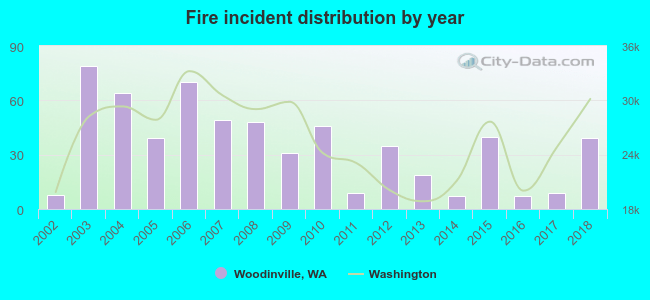 According to the data from the years 2002 - 2018 the average number of fires per year is 35. The highest number of fires - 79 took place in 2003, and the least - 7 in 2014. The data has a rising trend.
The average number of yearly fire incidents per 10k residents in Woodinville, WA compared to nearest cities:
(Note: Based on data for the last 3 years, including only cities with population 5,000 and above)
| Woodinville: | 16.1 |
| Bothell: | 32.5 |
| Kenmore: | 14.5 |
| Kirkland: | 6.4 |
| Redmond: | 21.2 |
| Brier: | 10.4 |
| Lake Forest Park: | 12.6 |
| Mountlake Terrace: | 14.9 |
| Mill Creek: | 10.8 |
 The median response time based on all reported fire incidents is 7 minutes. This is comparable to the Washington median value.
The median response time in Woodinville, WA compared to nearest cities:
(Note: Based on data for all years, including only cities with at least 500 fire incidents)
| Woodinville: | 7 minutes |
| Bothell: | 6 minutes |
| Kenmore: | 6 minutes |
| Kirkland: | 6 minutes |
| Redmond: | 6 minutes |
| Mountlake Terrace: | 7 minutes |
| Shoreline: | 7 minutes |
| Lynnwood: | 7 minutes |
| Edmonds: | 7 minutes |
 38.1% incidents where reported in the morning and 61.9% in the evening. The most fires (16.2%) took place on Thursday, and the least (10.2%) on Monday.
 According to the 599 fire incidents from years 2002 - 2018 most fires (17.9%) took place during July, and the least (4.5%) in February.
 Out of all 5,907 cases reported during the years 2002 - 2018, the most belonged to the categories: Rescue & EMS (55.3%), Good Intent Call (14.6%), and Fire (10.1%).
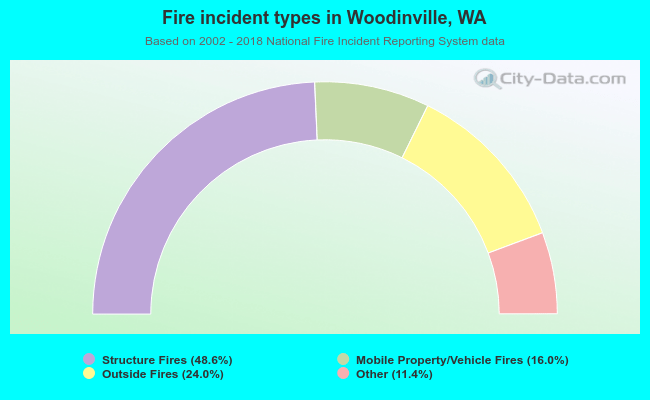 When looking into fire subcategories, the most incidents belonged to: Structure Fires (48.6%), and Outside Fires (24.0%).