Edmonds: Fire Incidents, Washington (WA)
Where are fire incidents reported in Edmonds, WA
Something went wrong! Please refresh the page.
| Fire incidents reported | |
|---|---|
| Sreet name | Count |
| EDMONDS WAY | 102 |
| 76 AVE | 90 |
| 99 HWY | 84 |
| MAIN ST | 84 |
| HWY 99 | 74 |
| 224 ST | 70 |
| 212 ST | 56 |
| 236 ST | 52 |
| 220 ST | 50 |
| 84 AVE | 50 |
| 5 AVE | 36 |
| 80 AVE | 36 |
| PICNIC POINT RD | 36 |
| 244 ST | 32 |
| DAYTON ST | 28 |
| LAKE BALLINGER WAY | 28 |
| 100 AVE | 26 |
| 93 PL | 26 |
| ADMIRAL WAY | 26 |
| PINE ST | 24 |
| RAILROAD AVE | 24 |
| 238 ST | 22 |
| 72 AVE | 22 |
| HIGHWAY 99 | 22 |
| 140 ST | 20 |
| 208 ST | 20 |
| 213 PL | 20 |
| 230 ST | 20 |
| 74 AVE | 20 |
| 196 ST | 18 |
| Other | 227 |
2002 - 2018 National Fire Incident Reporting System (NFIRS) incidents
- Incident types reported to NFIRS in Edmonds, WA
- 18,24170.4%Rescue & EMS
- 2,3108.9%Good Intent Call
- 1,4975.8%Service Call
- 1,4455.6%Fire
- 1,3495.2%Hazardous Condition
- 9983.9%False Alarm
- Fire incident types reported to NFIRS in Edmonds, WA
- 70048.4%Structure Fires
- 52836.5%Outside Fires
- 14810.2%Mobile Property/Vehicle Fires
- 694.8%Other
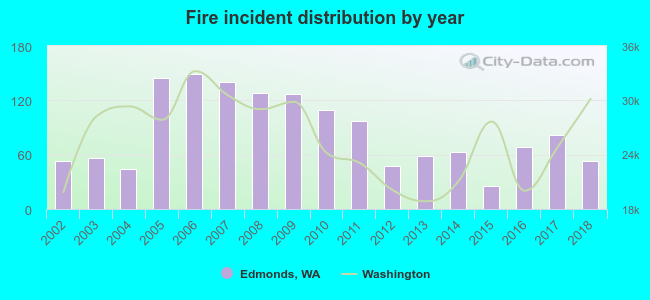 Based on the data from the years 2002 - 2018 the average number of fires per year is 85. The highest number of fire incidents - 149 took place in 2006, and the least - 25 in 2015. The data has a constant trend.
The average number of yearly fire incidents per 10k residents in Edmonds, WA compared to nearest cities:
(Note: Based on data for the last 3 years, including only cities with population 5,000 and above)
| Edmonds: | 16.5 |
| Mountlake Terrace: | 14.9 |
| Lynnwood: | 56.1 |
| Shoreline: | 23.4 |
| Brier: | 10.4 |
| Lake Forest Park: | 12.6 |
| Kenmore: | 14.5 |
| Bothell: | 32.5 |
| Mukilteo: | 18.9 |
 The median response time based on all reported fire incidents is 7 minutes. This is close to the state median value.
The median response time in Edmonds, WA compared to nearest cities:
(Note: Based on data for all years, including only cities with at least 500 fire incidents)
| Edmonds: | 7 minutes |
| Mountlake Terrace: | 7 minutes |
| Lynnwood: | 7 minutes |
| Shoreline: | 7 minutes |
| Kenmore: | 6 minutes |
| Bothell: | 6 minutes |
| Mukilteo: | 6 minutes |
| Woodinville: | 7 minutes |
| Kirkland: | 6 minutes |
 According to the reports from the years 2002 - 2018 the average number of fire-related fatalities per year is 0. The highest number of reported deaths - 2 took place in 2010, and the lowest - 0 in 2002. The data has a constant trend.
 Based on the data from the years 2002 - 2018 the average number of fire-related casualties per year is 1. The highest number of casualties - 4 took place in 2007, and the lowest - 0 in 2002. The data has an increasing trend.
The average number of injuries per 1,000 fire incidents is 10. This indicator was the highest - 36 in 2003, and the lowest 0 in 2002. The trend for injuries per 1,000 fires is rising. Compared to the state value the number of casualties per 1,000 incidents is higher.
Based on the data from the years 2002 - 2018 the average number of fire-related casualties per year is 1. The highest number of casualties - 4 took place in 2007, and the lowest - 0 in 2002. The data has an increasing trend.
The average number of injuries per 1,000 fire incidents is 10. This indicator was the highest - 36 in 2003, and the lowest 0 in 2002. The trend for injuries per 1,000 fires is rising. Compared to the state value the number of casualties per 1,000 incidents is higher.Casualties per 1,000 incidents in Edmonds, WA compared to nearest cities:
(Note: Based on data for all years, including only cities with at least 500 fire incidents)
| Edmonds: | 13.1 |
| Mountlake Terrace: | 13.9 |
| Lynnwood: | 7.8 |
| Shoreline: | 19.2 |
| Kenmore: | 7.4 |
| Bothell: | 10.0 |
| Mukilteo: | 19.2 |
| Woodinville: | 3.3 |
| Kirkland: | 2.5 |
 34.8% incidents where reported in the morning and 65.2% in the evening. The most fires (16.5%) took place on Tuesday, and the least (11.9%) on Monday.
 According to the 1,445 fire incidents from years 2002 - 2018 most fires (18.1%) took place during July, and the least (5.3%) in April.
 Out of all 25,894 cases reported during the years 2002 - 2018, the most belonged to the categories: Rescue & EMS (70.4%), Good Intent Call (8.9%), and Service Call (5.8%).
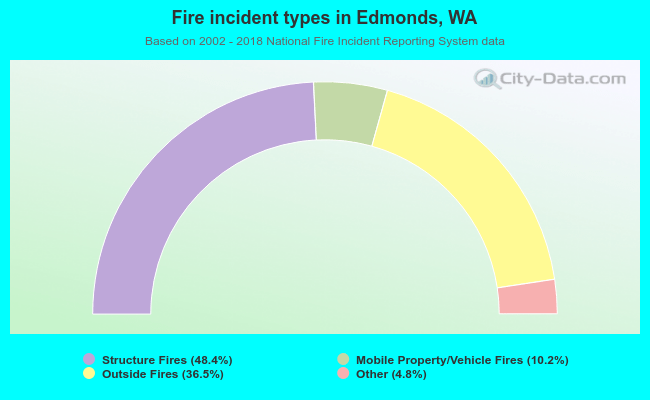 When looking into fire subcategories, the most incidents belonged to: Structure Fires (48.4%), and Outside Fires (36.5%).