Winsted: Fire Incidents, Connecticut (CT)
Where are fire incidents reported in Winsted, CT
Something went wrong! Please refresh the page.
|
| |||||||||||||||||||||||||||||||||||||||||||||||||||||||||||||||||||||||||||||||||||||||||||||||||||||||||||||
| Other | 41 | |||||||||||||||||||||||||||||||||||||||||||||||||||||||||||||||||||||||||||||||||||||||||||||||||||||||||||||
2002 - 2018 National Fire Incident Reporting System (NFIRS) incidents
- Incident types reported to NFIRS in Winsted, CT
- 1,37042.9%Hazardous Condition
- 69321.7%Fire
- 44714.0%Service Call
- 32410.1%False Alarm
- 1815.7%Good Intent Call
- 1484.6%Rescue & EMS
- 280.9%Severe Weather
- 40.1%Special Incident
- Fire incident types reported to NFIRS in Winsted, CT
- 39557.0%Structure Fires
- 18326.4%Outside Fires
- 598.5%Mobile Property/Vehicle Fires
- 568.1%Other
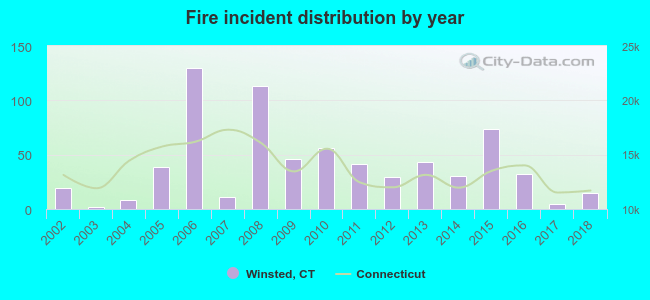 Based on the data from the years 2002 - 2018 the average number of fire incidents per year is 41. The highest number of fires - 130 took place in 2006, and the least - 2 in 2003. The data has a dropping trend.
The average number of yearly fire incidents per 10k residents in Winsted, CT compared to nearest cities:
(Note: Based on data for the last 3 years, including only cities with population 5,000 and above)
| Winsted: | 22.5 |
| Winchester: | 10.7 |
| New Hartford: | 41.6 |
| Torrington: | 26.8 |
| Canton: | 38.2 |
| Harwinton: | 42.5 |
| Burlington: | 28.7 |
| Simsbury: | 16.0 |
| Granby: | 28.4 |
 The median response time based on all reported fire incidents is 6 minutes. This is about the same as the Connecticut median value.
The median response time in Winsted, CT compared to nearest cities:
(Note: Based on data for all years, including only cities with at least 500 fire incidents)
| Winsted: | 6 minutes |
| Torrington: | 5 minutes |
| Harwinton: | 7 minutes |
| Simsbury: | 5 minutes |
| Granby: | 7 minutes |
| Avon: | 7 minutes |
| East Granby: | 7 minutes |
| Farmington: | 7 minutes |
| Bristol: | 4 minutes |
 29.1% incidents where reported in the morning and 70.9% in the evening. The most fires (16.2%) took place on Sunday, and the least (10.8%) on Tuesday.
 Based on the 693 reports from years 2002 - 2018 most fires (13.3%) took place during April, and the least (4.9%) in September.
 Out of all 3,197 cases reported during the years 2002 - 2018, the most belonged to the categories: Hazardous Condition (42.9%), Fire (21.7%), and Service Call (14.0%).
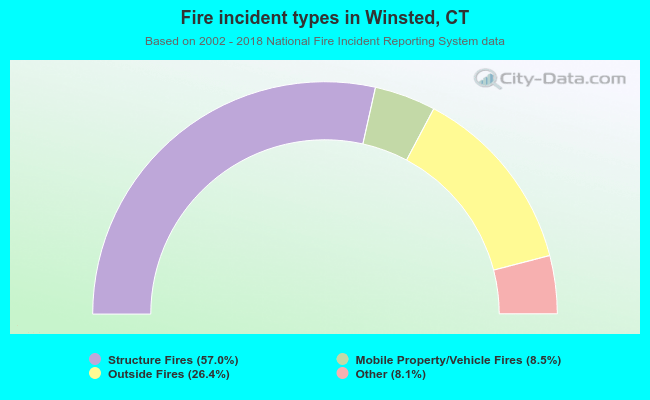 When looking into fire subcategories, the most incidents belonged to: Structure Fires (57.0%), and Outside Fires (26.4%).