Windsor: Fire Incidents, California (CA)
Where are fire incidents reported in Windsor, CA
Something went wrong! Please refresh the page.
| Fire incidents reported | |
|---|---|
| Sreet name | Count |
| OLD REDWOOD HWY | 88 |
| HWY 101 NB | 80 |
| HWY 101 SB | 68 |
| OLD REDWOOD HWY | 48 |
| STARR RD | 38 |
| HEMBREE LANE | 34 |
| BELL RD | 32 |
| STARR RD | 32 |
| WINDSOR RD | 32 |
| WINDSOR RIVER RD | 32 |
| BROOKS RD | 28 |
| BROOKS RD S | 26 |
| HEMBREE LN | 26 |
| BELL RD | 24 |
| HWY 101 | 24 |
| LAKEWOOD DR | 24 |
| WALTEN WY | 22 |
| WINDSOR RD | 22 |
| COLLEEN DR | 20 |
| EASTSIDE RD | 20 |
| WINDSOR RIVER RD | 20 |
| CONDE LN | 18 |
| ARATA LN | 16 |
| CHALK HILL RD | 16 |
| DECANTER CI | 16 |
| EASTSIDE RD | 16 |
| HEMBREE LN | 16 |
| MARK WEST STATION RD | 16 |
| SHILOH RD | 16 |
| COCK ROBIN AV | 14 |
| Other | 181 |
2005 - 2018 National Fire Incident Reporting System (NFIRS) incidents
- Incident types reported to NFIRS in Windsor, CA
- 3,56449.9%Rescue & EMS
- 1,06514.9%Fire
- 76310.7%Good Intent Call
- 72910.2%Hazardous Condition
- 6959.7%Service Call
- 3224.5%False Alarm
- Fire incident types reported to NFIRS in Windsor, CA
- 49546.5%Outside Fires
- 37635.3%Structure Fires
- 16515.5%Mobile Property/Vehicle Fires
- 292.7%Other
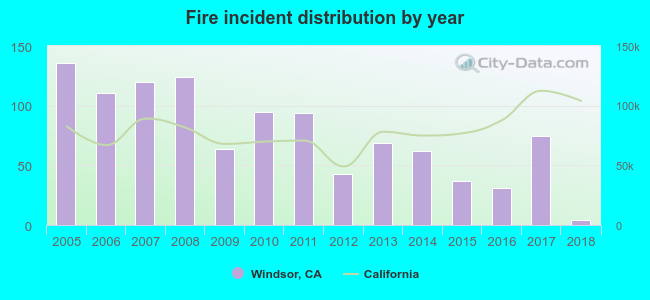 According to the data from the years 2005 - 2018 the average number of fires per year is 76. The highest number of reported fire incidents - 136 took place in 2005, and the least - 4 in 2018. The data has a dropping trend.
The average number of yearly fire incidents per 10k residents in Windsor, CA compared to nearest cities:
(Note: Based on data for the last 3 years, including only cities with population 5,000 and above)
| Windsor: | 13.4 |
| Healdsburg: | 46.6 |
| Santa Rosa: | 17.5 |
| Roseland: | 18.2 |
| Sebastopol: | 88.3 |
| Calistoga: | 9.4 |
| Rohnert Park: | 6.6 |
| Cotati: | 39.0 |
| Cloverdale: | 44.7 |
 The median response time based on all reported fire incidents is 6 minutes. This is similar to the state median value.
The median response time in Windsor, CA compared to nearest cities:
(Note: Based on data for all years, including only cities with at least 500 fire incidents)
| Windsor: | 6 minutes |
| Healdsburg: | 8 minutes |
| Forestville: | 9 minutes |
| Santa Rosa: | 6 minutes |
| Sebastopol: | 9 minutes |
| Cotati: | 6 minutes |
| Petaluma: | 7 minutes |
| Sonoma: | 8 minutes |
| Lower Lake: | 3 minutes |
 According to the reports from the years 2005 - 2018 the average number of fire-related yearly deaths is 0. The highest number of deaths - 1 took place in 2008, and the lowest - 0 in 2005. The data has a growing trend.
 Based on the reports from the years 2005 - 2018 the average number of fire-related yearly casualties is 0. The highest number of reported injuries - 1 took place in 2005, and the lowest - 0 in 2009. The data has a decreasing trend.
The average number of injuries per 1,000 fires is 4. This indicator was the highest - 23 in 2012, and the lowest 0 in 2009. The trend for casualties per 1,000 fire incidents is decreasing. Compared to the California value the number of injuries per 1,000 fires is lower.
Based on the reports from the years 2005 - 2018 the average number of fire-related yearly casualties is 0. The highest number of reported injuries - 1 took place in 2005, and the lowest - 0 in 2009. The data has a decreasing trend.
The average number of injuries per 1,000 fires is 4. This indicator was the highest - 23 in 2012, and the lowest 0 in 2009. The trend for casualties per 1,000 fire incidents is decreasing. Compared to the California value the number of injuries per 1,000 fires is lower.Casualties per 1,000 incidents in Windsor, CA compared to nearest cities:
(Note: Based on data for all years, including only cities with at least 500 fire incidents)
| Windsor: | 4.7 |
| Healdsburg: | 1.1 |
| Forestville: | 1.1 |
| Santa Rosa: | 14.9 |
| Sebastopol: | 0.0 |
| Cotati: | 6.9 |
| Petaluma: | 6.6 |
| Sonoma: | 2.9 |
| Lower Lake: | 0.0 |
 27.0% incidents where reported in the morning and 73.0% in the evening. The most fires (16.2%) took place on Wednesday, and the least (12.3%) on Friday.
 Based on the 1,065 fires from years 2005 - 2018 most fires (13.4%) took place during June, and the least (5.3%) in November.
 Out of all 7,144 cases reported during the years 2005 - 2018, the most belonged to the categories: Rescue & EMS (49.9%), Fire (14.9%), and Good Intent Call (10.7%).
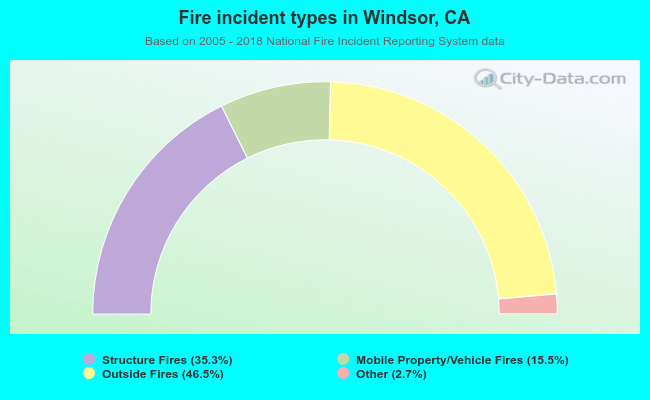 When looking into fire subcategories, the most incidents belonged to: Outside Fires (46.5%), and Structure Fires (35.3%).