Wilmington: Fire Incidents, North Carolina (NC)
Where are fire incidents reported in Wilmington, NC
Something went wrong! Please refresh the page.
| Fire incidents reported | |
|---|---|
| Sreet name | Count |
| COLLEGE RD | 850 |
| MARKET ST | 834 |
| CAROLINA BEACH RD | 614 |
| KERR AVE | 386 |
| OLEANDER DR | 384 |
| 17TH ST | 332 |
| US HWY 421 | 280 |
| RIVER RD | 198 |
| CASTLE HAYNE RD | 192 |
| FRONT ST | 190 |
| GORDON RD | 184 |
| WRIGHTSVILLE AVE | 182 |
| RACINE DR | 180 |
| 3RD ST | 174 |
| HALYBURTON MEMORIAL PKY | 158 |
| EASTWOOD RD | 154 |
| CAROLINA BEACH RD | 152 |
| 2ND ST | 150 |
| 13TH ST | 144 |
| CASTLE ST | 140 |
| MURRAYVILLE RD | 138 |
| NEW CENTRE DR | 134 |
| 5TH AVE | 132 |
| 7TH ST | 132 |
| 12TH ST | 128 |
| 16TH ST | 128 |
| 8TH ST | 126 |
| 30TH ST | 122 |
| 23RD ST | 120 |
| CHESTNUT ST | 114 |
| Other | 5,565 |
2002 - 2018 National Fire Incident Reporting System (NFIRS) incidents
- Incident types reported to NFIRS in Wilmington, NC
- 51,69741.9%Rescue & EMS
- 23,93719.4%Hazardous Condition
- 16,01013.0%Good Intent Call
- 12,71710.3%Fire
- 12,0149.7%False Alarm
- 6,5025.3%Service Call
- 2090.2%Special Incident
- 1980.2%Overpressure Rupture
- 1620.1%Severe Weather
- Fire incident types reported to NFIRS in Wilmington, NC
- 5,90846.5%Outside Fires
- 4,73637.2%Structure Fires
- 1,79314.1%Mobile Property/Vehicle Fires
- 2802.2%Other
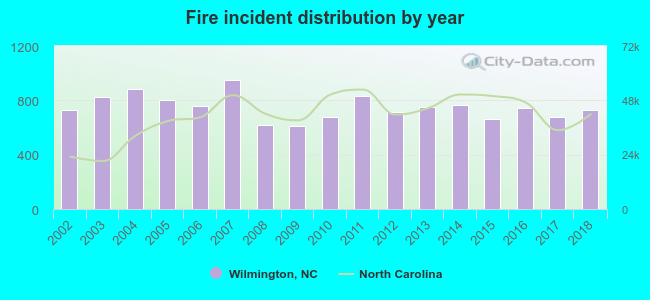 Based on the data from the years 2002 - 2018 the average number of fires per year is 748. The highest number of fire incidents - 949 took place in 2007, and the least - 611 in 2009. The data has a growing trend.
The average number of yearly fire incidents per 10k residents in Wilmington, NC compared to nearest cities:
(Note: Based on data for the last 3 years, including only cities with population 5,000 and above)
| Wilmington: | 62.9 |
| Leland: | 86.8 |
| Myrtle Grove: | 1.1 |
| Ogden: | 1.5 |
| Carolina Beach: | 69.0 |
| Boiling Spring Lakes: | 58.0 |
| Oak Island: | 64.9 |
| Whiteville: | 263.6 |
| Jacksonville: | 37.7 |
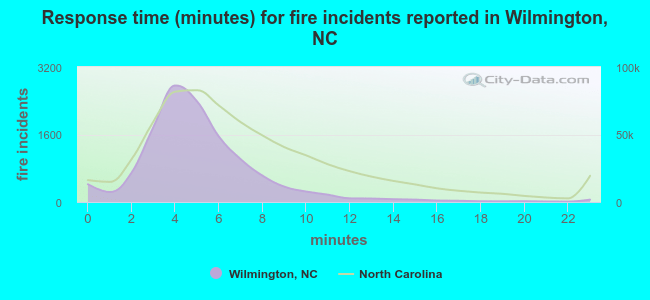 The median response time based on all reported fire incidents is 5 minutes. This is lower than the state median value.
The median response time in Wilmington, NC compared to nearest cities:
(Note: Based on data for all years, including only cities with at least 500 fire incidents)
| Wilmington: | 5 minutes |
| Leland: | 10 minutes |
| Castle Hayne: | 6 minutes |
| Carolina Beach: | 6 minutes |
| Rocky Point: | 11 minutes |
| Boiling Spring Lakes: | 9 minutes |
| Bolivia: | 11 minutes |
| Burgaw: | 11 minutes |
| Oak Island: | 9 minutes |
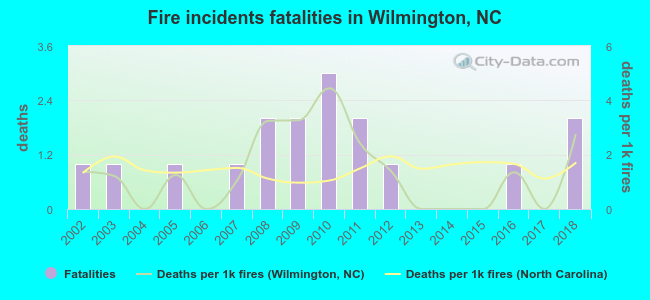 According to the reports from the years 2002 - 2018 the average number of fire-related yearly deaths is 1. The highest number of reported deaths - 3 took place in 2010, and the lowest - 0 in 2004. The data has an increasing trend.
The average number of fatalities per 1,000 fires is 1. This indicator was the highest - 4 in 2010, and the lowest 0 in 2004. The trend for deaths per 1,000 fires is growing. Compared to the North Carolina value the number of deaths per 1,000 fire incidents is about the same.
According to the reports from the years 2002 - 2018 the average number of fire-related yearly deaths is 1. The highest number of reported deaths - 3 took place in 2010, and the lowest - 0 in 2004. The data has an increasing trend.
The average number of fatalities per 1,000 fires is 1. This indicator was the highest - 4 in 2010, and the lowest 0 in 2004. The trend for deaths per 1,000 fires is growing. Compared to the North Carolina value the number of deaths per 1,000 fire incidents is about the same.Deaths per 1,000 incidents in Wilmington, NC compared to nearest cities:
(Note: Based on data for all years, including only cities with at least 2,500 fire incidents)
| Wilmington: | 1.3 |
| Jacksonville: | 1.1 |
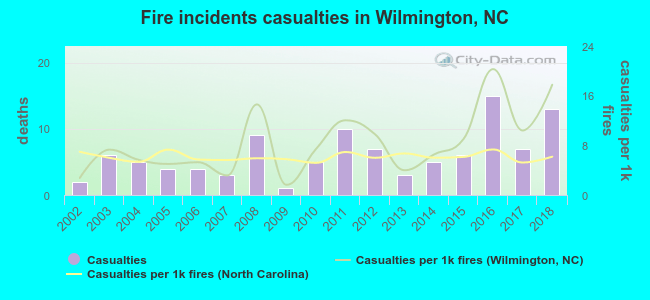 According to the data from the years 2002 - 2018 the average number of fire-related casualties per year is 6. The highest number of reported injuries - 15 took place in 2016, and the lowest - 1 in 2009. The data has a rising trend.
The average number of injuries per 1,000 fire incidents is 8. This indicator was the highest - 20 in 2016, and the lowest 2 in 2009. The trend for casualties per 1,000 incidents is growing. Compared to the state value the number of injuries per 1,000 fires is higher.
According to the data from the years 2002 - 2018 the average number of fire-related casualties per year is 6. The highest number of reported injuries - 15 took place in 2016, and the lowest - 1 in 2009. The data has a rising trend.
The average number of injuries per 1,000 fire incidents is 8. This indicator was the highest - 20 in 2016, and the lowest 2 in 2009. The trend for casualties per 1,000 incidents is growing. Compared to the state value the number of injuries per 1,000 fires is higher.Casualties per 1,000 incidents in Wilmington, NC compared to nearest cities:
(Note: Based on data for all years, including only cities with at least 500 fire incidents)
| Wilmington: | 8.3 |
| Leland: | 2.7 |
| Castle Hayne: | 13.1 |
| Carolina Beach: | 0.0 |
| Rocky Point: | 2.2 |
| Boiling Spring Lakes: | 5.0 |
| Bolivia: | 1.0 |
| Burgaw: | 1.1 |
| Oak Island: | 5.1 |
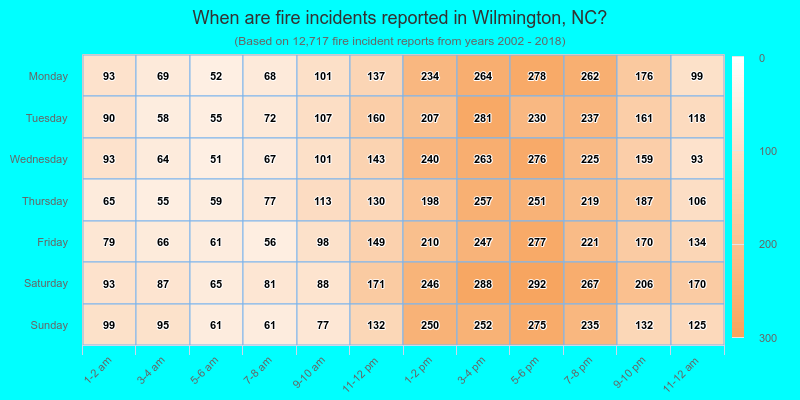
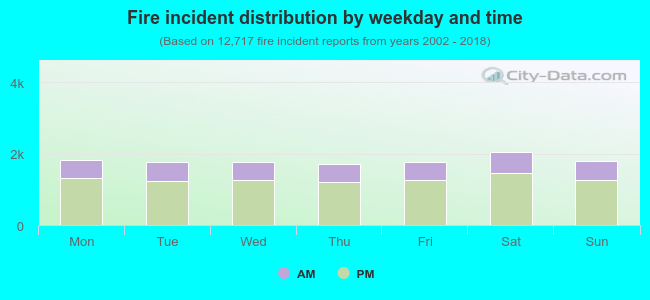 29.1% incidents where reported in the morning and 70.9% in the evening. The most fires (16.2%) took place on Saturday, and the least (13.5%) on Thursday.
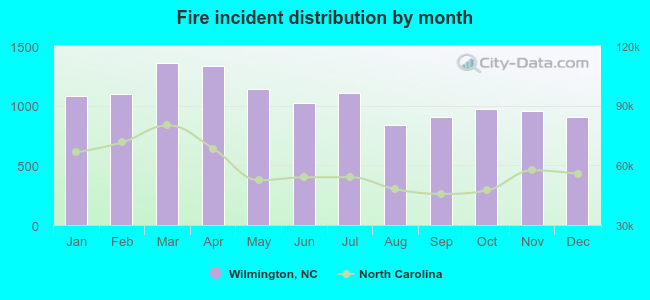 According to the 12,717 incident reports from years 2002 - 2018 most fires (10.7%) took place during March, and the least (6.6%) in August.
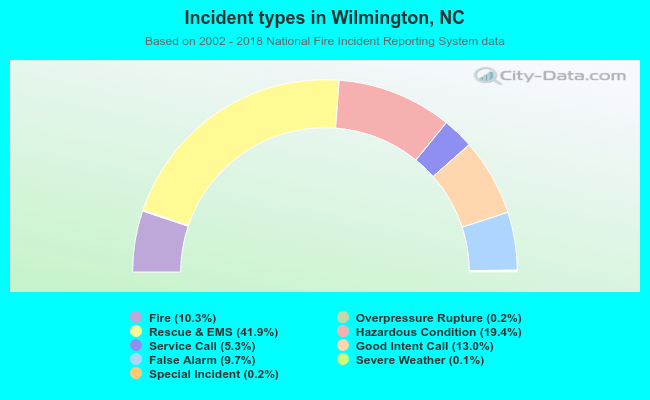 Out of all 123,446 cases reported during the years 2002 - 2018, the most belonged to the categories: Rescue & EMS (41.9%), Hazardous Condition (19.4%), and Good Intent Call (13.0%).
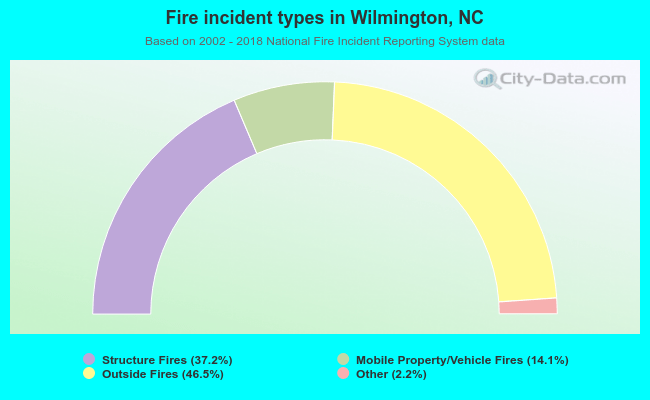 When looking into fire subcategories, the most incidents belonged to: Outside Fires (46.5%), and Structure Fires (37.2%).