Leland: Fire Incidents, North Carolina (NC)
Where are fire incidents reported in Leland, NC
Something went wrong! Please refresh the page.
| Fire incidents reported | |
|---|---|
| Sreet name | Count |
| VILLAGE RD | 146 |
| MACO RD | 128 |
| ANDREW JACKSON HWY | 68 |
| OLD FAYETTEVILLE RD | 68 |
| OCEAN HWY | 64 |
| LANVALE RD | 62 |
| BLUE BANKS LOOP RD | 58 |
| NEW POINTE BLVD | 56 |
| MISERY RD MT | 50 |
| HOOPER RD | 46 |
| BLACKWELL RD | 44 |
| LINCOLN RD | 44 |
| TOWN CREEK RD | 40 |
| COLON MINTZ RD | 32 |
| MT MISERY RD | 32 |
| NAVASSA RD | 30 |
| GREEN LOOP RD | 26 |
| HUNTERSTONE DR | 26 |
| LEAPFROG LN | 26 |
| MALMO LOOP RD | 26 |
| SANDY RIDGE WAY | 26 |
| MT. MISERY RD | 24 |
| RIVER RD | 24 |
| CHAPPELL LOOP RD | 22 |
| DOGWOOD RD | 22 |
| EVANGELINE DR | 22 |
| GRANDIFLORA DR | 22 |
| MAPLE TREE DR | 22 |
| MOUNT MISERY RD | 22 |
| PARSLEY LN | 20 |
| Other | 576 |
2002 - 2018 National Fire Incident Reporting System (NFIRS) incidents
- Incident types reported to NFIRS in Leland, NC
- 5,20546.3%Rescue & EMS
- 1,94717.3%Good Intent Call
- 1,87416.7%Fire
- 8237.3%False Alarm
- 7827.0%Hazardous Condition
- 5444.8%Service Call
- 560.5%Severe Weather
- Fire incident types reported to NFIRS in Leland, NC
- 1,01454.1%Structure Fires
- 61332.7%Outside Fires
- 1769.4%Mobile Property/Vehicle Fires
- 713.8%Other
 According to the data from the years 2002 - 2018 the average number of fire incidents per year is 110. The highest number of reported fire incidents - 182 took place in 2011, and the least - 7 in 2006. The data has an increasing trend.
The average number of yearly fire incidents per 10k residents in Leland, NC compared to nearest cities:
(Note: Based on data for the last 3 years, including only cities with population 5,000 and above)
| Leland: | 86.8 |
| Wilmington: | 62.9 |
| Myrtle Grove: | 1.1 |
| Ogden: | 1.5 |
| Boiling Spring Lakes: | 58.0 |
| Carolina Beach: | 69.0 |
| Oak Island: | 64.9 |
| Whiteville: | 263.6 |
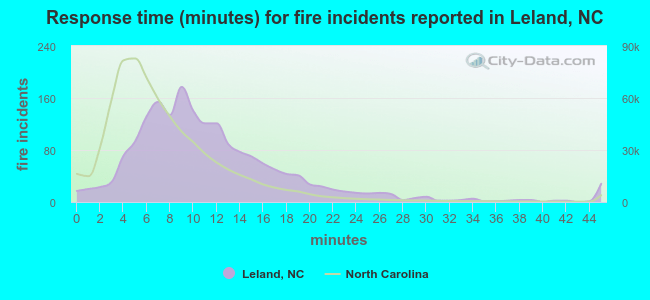 The median response time based on all reported fire incidents is 10 minutes. This is higher compared to the state median value.
The median response time in Leland, NC compared to nearest cities:
(Note: Based on data for all years, including only cities with at least 500 fire incidents)
| Leland: | 10 minutes |
| Wilmington: | 5 minutes |
| Castle Hayne: | 6 minutes |
| Bolivia: | 11 minutes |
| Boiling Spring Lakes: | 9 minutes |
| Carolina Beach: | 6 minutes |
| Rocky Point: | 11 minutes |
| Burgaw: | 11 minutes |
| Oak Island: | 9 minutes |
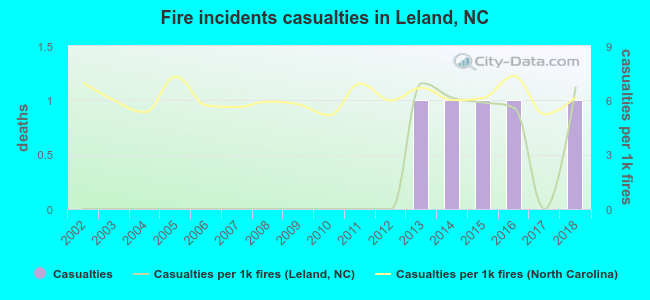 Based on the data from the years 2002 - 2018 the average number of fire-related casualties per year is 0. The highest number of injuries - 1 took place in 2013, and the lowest - 0 in 2002. The data has a rising trend.
The average number of injuries per 1,000 fire incidents is 2. This indicator was the highest - 7 in 2013, and the lowest 0 in 2002. The trend for injuries per 1,000 incidents is increasing. Compared to the state value the number of injuries per 1,000 fires is much lower.
Based on the data from the years 2002 - 2018 the average number of fire-related casualties per year is 0. The highest number of injuries - 1 took place in 2013, and the lowest - 0 in 2002. The data has a rising trend.
The average number of injuries per 1,000 fire incidents is 2. This indicator was the highest - 7 in 2013, and the lowest 0 in 2002. The trend for injuries per 1,000 incidents is increasing. Compared to the state value the number of injuries per 1,000 fires is much lower.Casualties per 1,000 incidents in Leland, NC compared to nearest cities:
(Note: Based on data for all years, including only cities with at least 500 fire incidents)
| Leland: | 2.7 |
| Wilmington: | 8.3 |
| Castle Hayne: | 13.1 |
| Bolivia: | 1.0 |
| Boiling Spring Lakes: | 5.0 |
| Carolina Beach: | 0.0 |
| Rocky Point: | 2.2 |
| Burgaw: | 1.1 |
| Oak Island: | 5.1 |
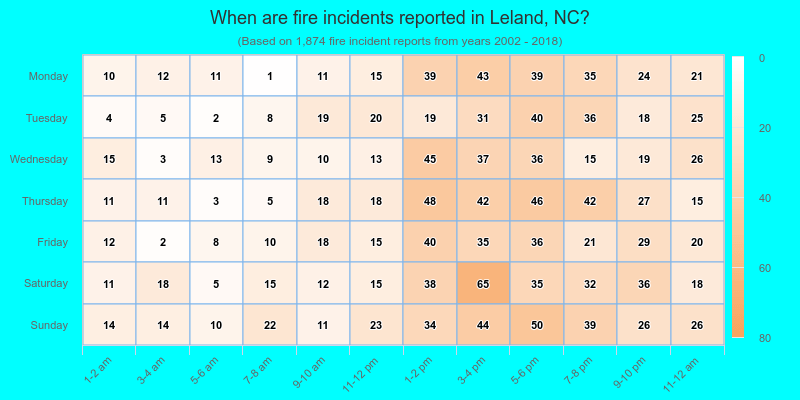
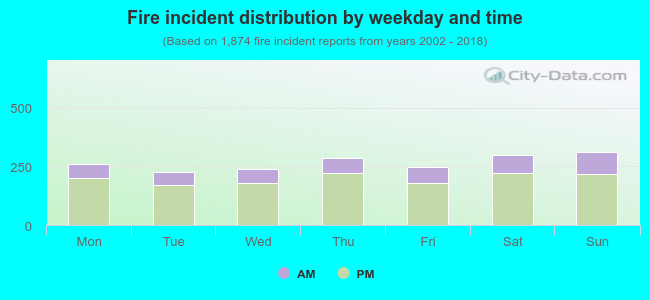 25.7% incidents where reported in the morning and 74.3% in the evening. The most fires (16.7%) took place on Sunday, and the least (12.1%) on Tuesday.
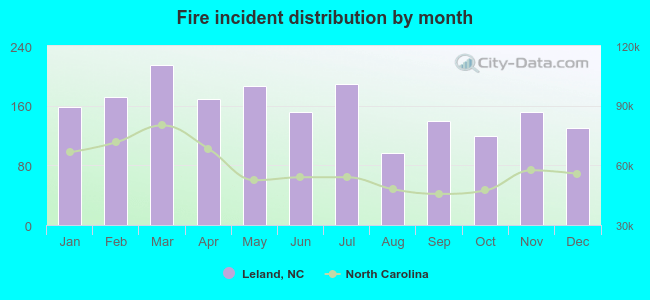 According to the 1,874 fire incident reports from years 2002 - 2018 most fires (11.4%) took place during March, and the least (5.1%) in August.
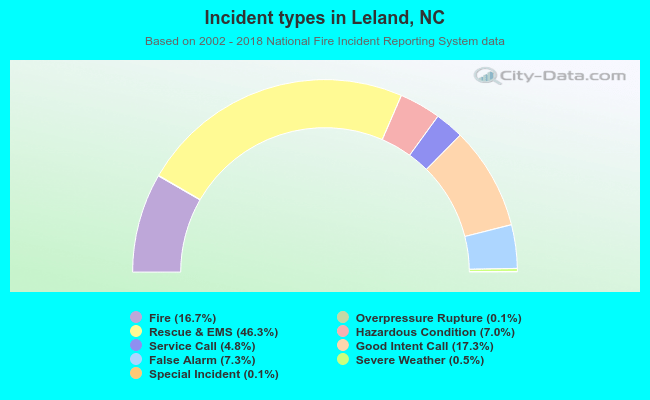 Out of all 11,250 cases reported during the years 2002 - 2018, the most belonged to the categories: Rescue & EMS (46.3%), Good Intent Call (17.3%), and Fire (16.7%).
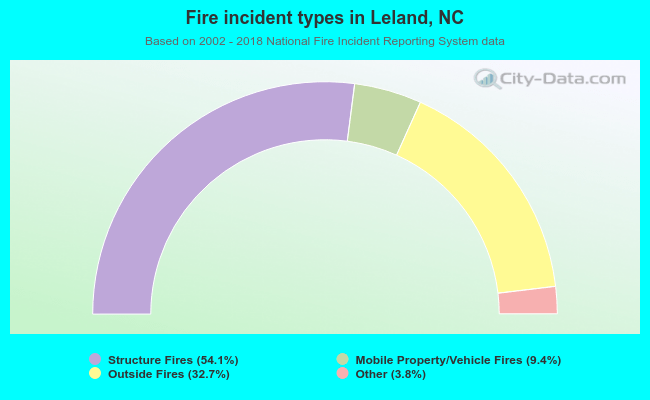 When looking into fire subcategories, the most reports belonged to: Structure Fires (54.1%), and Outside Fires (32.7%).