Washington: Fire Incidents, Pennsylvania (PA)
Where are fire incidents reported in Washington, PA
Something went wrong! Please refresh the page.
|
| |||||||||||||||||||||||||||||||||||||||||||||||||||||||||||||||||||||||||||||||||||||||||||||||||||||||||||||
| Other | 155 | |||||||||||||||||||||||||||||||||||||||||||||||||||||||||||||||||||||||||||||||||||||||||||||||||||||||||||||
2006 - 2018 National Fire Incident Reporting System (NFIRS) incidents
- Incident types reported to NFIRS in Washington, PA
- 2,01635.5%Rescue & EMS
- 94816.7%False Alarm
- 74113.0%Fire
- 68612.1%Hazardous Condition
- 56910.0%Good Intent Call
- 5028.8%Service Call
- 1683.0%Severe Weather
- 490.9%Special Incident
- Fire incident types reported to NFIRS in Washington, PA
- 44660.2%Structure Fires
- 12516.9%Outside Fires
- 10213.8%Mobile Property/Vehicle Fires
- 689.2%Other
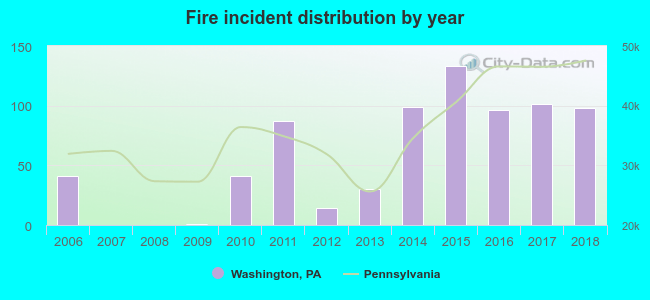 According to the data from the years 2006 - 2018 the average number of fires per year is 57. The highest number of fire incidents - 133 took place in 2015, and the least - 0 in 2007. The data has a rising trend.
The average number of yearly fire incidents per 10k residents in Washington, PA compared to nearest cities:
(Note: Based on data for the last 3 years, including only cities with population 5,000 and above)
| Washington: | 72.6 |
| Canonsburg: | 35.1 |
| Bridgeville: | 110.1 |
| Bethel Park: | 12.3 |
| Scott Township: | 10.7 |
| Castle Shannon: | 2.8 |
| Carnegie: | 28.2 |
| Jefferson Hills: | 17.2 |
| Pleasant Hills: | 3.0 |
 The median response time based on all reported fire incidents is 8 minutes. This is higher than the Pennsylvania median value.
The median response time in Washington, PA compared to nearest cities:
(Note: Based on data for all years, including only cities with at least 500 fire incidents)
| Washington: | 8 minutes |
| Bridgeville: | 7 minutes |
 Based on the reports from the years 2006 - 2018 the average number of fire-related yearly deaths is 0. The highest number of deaths - 2 took place in 2017, and the lowest - 0 in 2006. The data has a rising trend.
 29.3% incidents where reported in the morning and 70.7% in the evening. The most fires (18.6%) took place on Saturday, and the least (12.0%) on Sunday.
 Based on the 741 incident reports from years 2006 - 2018 most fires (10.9%) took place during March, and the least (6.2%) in October.
 Out of all 5,680 cases reported during the years 2006 - 2018, the most belonged to the categories: Rescue & EMS (35.5%), False Alarm (16.7%), and Fire (13.0%).
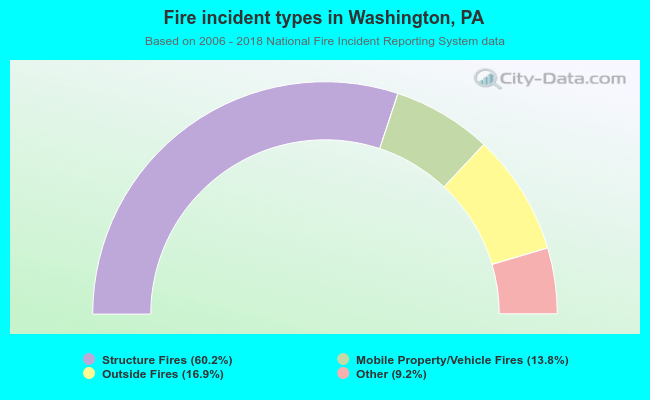 When looking into fire subcategories, the most reports belonged to: Structure Fires (60.2%), and Outside Fires (16.9%).