Bethel Park: Fire Incidents, Pennsylvania (PA)
Where are fire incidents reported in Bethel Park, PA
Something went wrong! Please refresh the page.
|
| |||||||||||||||||||||||||||||||||||||||||||||||||||||||||||||||||||||||||||||||||||||||||||||||||||||||||||||
2004 - 2018 National Fire Incident Reporting System (NFIRS) incidents
- Incident types reported to NFIRS in Bethel Park, PA
- 70133.0%False Alarm
- 66331.2%Hazardous Condition
- 35916.9%Fire
- 1838.6%Good Intent Call
- 994.7%Service Call
- 693.2%Rescue & EMS
- 432.0%Severe Weather
- 100.5%Overpressure Rupture
- Fire incident types reported to NFIRS in Bethel Park, PA
- 20657.4%Structure Fires
- 10027.9%Outside Fires
- 4913.6%Mobile Property/Vehicle Fires
- 41.1%Other
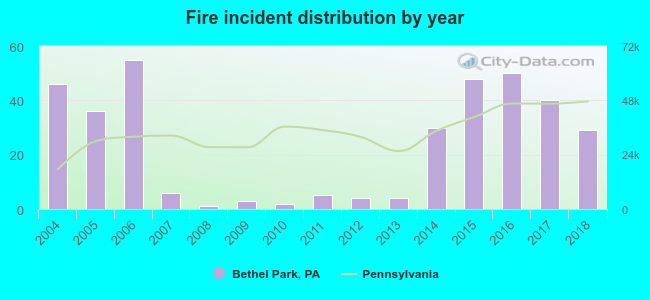 According to the data from the years 2004 - 2018 the average number of fire incidents per year is 24. The highest number of fires - 55 took place in 2006, and the least - 1 in 2008. The data has a declining trend.
The average number of yearly fire incidents per 10k residents in Bethel Park, PA compared to nearest cities:
(Note: Based on data for the last 3 years, including only cities with population 5,000 and above)
| Bethel Park: | 12.3 |
| Castle Shannon: | 2.8 |
| Whitehall: | 1.8 |
| Pleasant Hills: | 3.0 |
| Baldwin: | 16.5 |
| Bridgeville: | 110.1 |
| Brentwood: | 24.4 |
| Dormont: | 26.6 |
| Scott Township: | 10.7 |

 31.8% incidents where reported in the morning and 68.2% in the evening. The most fires (17.0%) took place on Monday, and the least (10.3%) on Thursday.
 According to the 359 incident reports from years 2004 - 2018 most fires (13.4%) took place during May, and the least (3.6%) in November.
 Out of all 2,127 cases reported during the years 2004 - 2018, the most belonged to the categories: False Alarm (33.0%), Hazardous Condition (31.2%), and Fire (16.9%).
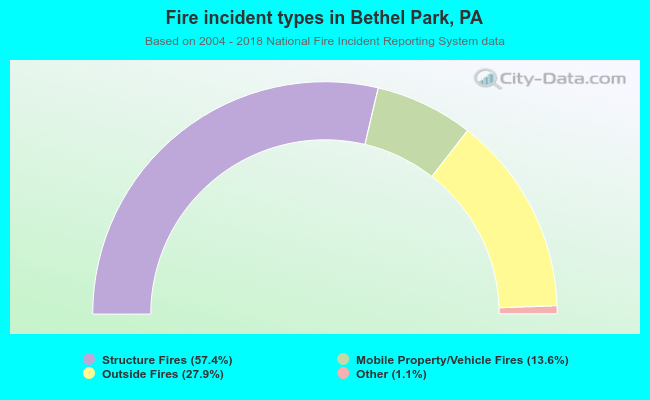 When looking into fire subcategories, the most incidents belonged to: Structure Fires (57.4%), and Outside Fires (27.9%).