Vail: Fire Incidents, Arizona (AZ)
Where are fire incidents reported in Vail, AZ
Something went wrong! Please refresh the page.
|
| |||||||||||||||||||||||||||||||||||||||||||||||||||||||||||||||||||||||||||||||||||||||||||||||||||||||||||||
| Other | 201 | |||||||||||||||||||||||||||||||||||||||||||||||||||||||||||||||||||||||||||||||||||||||||||||||||||||||||||||
2004 - 2018 National Fire Incident Reporting System (NFIRS) incidents
- Incident types reported to NFIRS in Vail, AZ
- 5,23251.9%Rescue & EMS
- 2,36423.4%Service Call
- 9979.9%Fire
- 8238.2%Good Intent Call
- 3783.7%False Alarm
- 2712.7%Hazardous Condition
- 200.2%Special Incident
- Fire incident types reported to NFIRS in Vail, AZ
- 38338.4%Other
- 37237.3%Outside Fires
- 13413.4%Mobile Property/Vehicle Fires
- 10810.8%Structure Fires
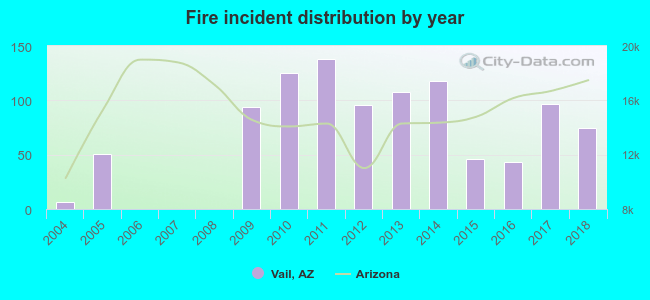 Based on the data from the years 2004 - 2018 the average number of fire incidents per year is 66. The highest number of fire incidents - 138 took place in 2011, and the least - 0 in 2006. The data has a rising trend.
The average number of yearly fire incidents per 10k residents in Vail, AZ compared to nearest cities:
(Note: Based on data for the last 3 years, including only cities with population 5,000 and above)
| Vail: | 70.2 |
| Corona de Tucson: | 2.6 |
| Sahuarita: | 10.8 |
| Tucson: | 43.3 |
| Green Valley: | 23.5 |
| South Tucson: | 40.1 |
| Arivaca: | 2.6 |
| Oro Valley: | 12.5 |
| Marana: | 20.6 |
 The median response time based on all reported fire incidents is 9 minutes. This is higher compared to the Arizona median value.
The median response time in Vail, AZ compared to nearest cities:
(Note: Based on data for all years, including only cities with at least 500 fire incidents)
| Vail: | 9 minutes |
| Tucson: | 5 minutes |
| Benson: | 12 minutes |
| Marana: | 7 minutes |
| Sierra Vista: | 6 minutes |
| Nogales: | 5 minutes |
 Based on the reports from the years 2004 - 2018 the average number of fire-related fatalities per year is 0. The highest number of reported deaths - 3 took place in 2011, and the lowest - 0 in 2004. The data has a constant trend.
 33.7% incidents where reported in the morning and 66.3% in the evening. The most fires (15.6%) took place on Sunday, and the least (13.2%) on Monday.
 Based on the 997 fire incident reports from years 2004 - 2018 most fires (12.8%) took place during May, and the least (5.8%) in October.
 Out of all 10,088 cases reported during the years 2004 - 2018, the most belonged to the categories: Rescue & EMS (51.9%), Service Call (23.4%), and Fire (9.9%).
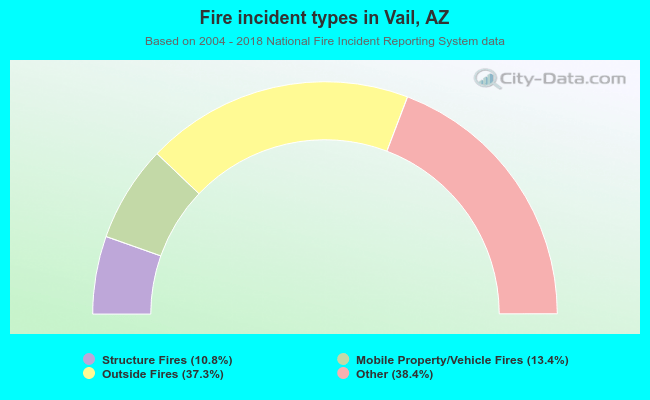 When looking into fire subcategories, the most incidents belonged to: Other (38.4%), and Outside Fires (37.3%).