Marana: Fire Incidents, Arizona (AZ)
Where are fire incidents reported in Marana, AZ
Something went wrong! Please refresh the page.
| Fire incidents reported | |
|---|---|
| Sreet name | Count |
| I10 | 250 |
| I-10 | 218 |
| INA RD | 106 |
| I10E | 94 |
| AVRA VALLEY RD | 76 |
| CORTARO RD | 76 |
| I10W | 64 |
| SILVERBELL RD | 64 |
| SANDARIO RD | 62 |
| TWIN PEAKS RD | 62 |
| TANGERINE RD | 60 |
| ORANGE GROVE RD | 58 |
| GRIER RD | 48 |
| THORNYDALE RD | 48 |
| SANDERS RD | 38 |
| I10 FRONTAGE RD | 36 |
| DERRINGER | 30 |
| MOORE RD | 30 |
| SANDARIO | 30 |
| INTERSTATE 10 | 28 |
| WARFIELD | 28 |
| ANWAY | 26 |
| WARFIELD CI | 24 |
| ARIZONA PAVILIONS DR | 20 |
| BARNETT RD | 20 |
| CORTARO FARMS RD | 20 |
| MARANA RD | 20 |
| VOLK | 20 |
| COSTCO DR | 18 |
| SANDY | 18 |
| Other | 101 |
2003 - 2018 National Fire Incident Reporting System (NFIRS) incidents
- Incident types reported to NFIRS in Marana, AZ
- 4,74841.6%Rescue & EMS
- 2,34820.6%Service Call
- 1,79315.7%Fire
- 1,0649.3%Good Intent Call
- 7926.9%False Alarm
- 6465.7%Hazardous Condition
- 130.1%Overpressure Rupture
- Fire incident types reported to NFIRS in Marana, AZ
- 87148.6%Outside Fires
- 47026.2%Mobile Property/Vehicle Fires
- 32418.1%Structure Fires
- 1287.1%Other
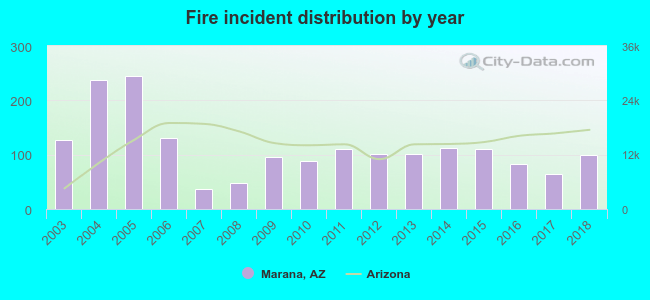 According to the data from the years 2003 - 2018 the average number of fires per year is 112. The highest number of reported fires - 244 took place in 2005, and the least - 37 in 2007. The data has a declining trend.
The average number of yearly fire incidents per 10k residents in Marana, AZ compared to nearest cities:
(Note: Based on data for the last 3 years, including only cities with population 5,000 and above)
| Marana: | 20.6 |
| Oro Valley: | 12.5 |
| South Tucson: | 40.1 |
| Tucson: | 43.3 |
| Saddlebrooke: | 19.4 |
| Sahuarita: | 10.8 |
| Arivaca: | 2.6 |
| Corona de Tucson: | 2.6 |
| Vail: | 70.2 |
 The median response time based on all reported fire incidents is 7 minutes. This is higher compared to the Arizona median value.
 Based on the reports from the years 2003 - 2018 the average number of fire-related yearly casualties is 0. The highest number of reported injuries - 2 took place in 2014, and the lowest - 0 in 2003. The data has a constant trend.
The average number of casualties per 1,000 fire incidents is 3. This indicator was the highest - 18 in 2014, and the lowest 0 in 2003. The trend for casualties per 1,000 fires is constant. Compared to the Arizona value the number of injuries per 1,000 incidents is lower.
Based on the reports from the years 2003 - 2018 the average number of fire-related yearly casualties is 0. The highest number of reported injuries - 2 took place in 2014, and the lowest - 0 in 2003. The data has a constant trend.
The average number of casualties per 1,000 fire incidents is 3. This indicator was the highest - 18 in 2014, and the lowest 0 in 2003. The trend for casualties per 1,000 fires is constant. Compared to the Arizona value the number of injuries per 1,000 incidents is lower.
 32.3% incidents where reported in the morning and 67.7% in the evening. The most fires (14.9%) took place on Tuesday, and the least (13.3%) on Monday.
 According to the 1,793 fire incidents from years 2003 - 2018 most fires (10.4%) took place during May, and the least (6.0%) in December.
 Out of all 11,414 cases reported during the years 2003 - 2018, the most belonged to the categories: Rescue & EMS (41.6%), Service Call (20.6%), and Fire (15.7%).
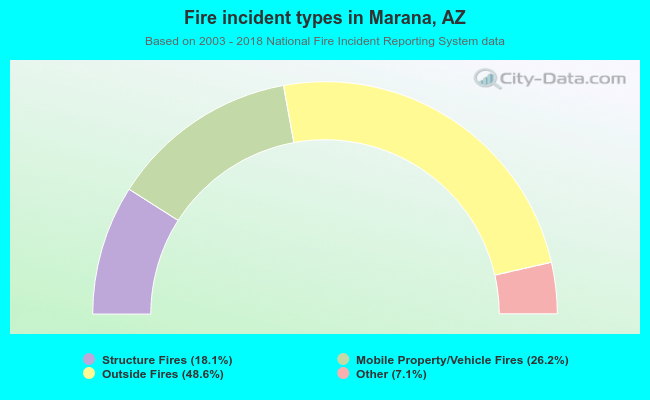 When looking into fire subcategories, the most reports belonged to: Outside Fires (48.6%), and Mobile Property/Vehicle Fires (26.2%).