Urbana: Fire Incidents, Illinois (IL)
Where are fire incidents reported in Urbana, IL
Something went wrong! Please refresh the page.
| Fire incidents reported | |
|---|---|
| Sreet name | Count |
| LINCOLN AVE | 280 |
| CUNNINGHAM AVE | 212 |
| GREEN ST | 204 |
| UNIVERSITY AVE | 190 |
| FLORIDA AVE | 162 |
| MAIN ST | 134 |
| PHILO RD | 124 |
| PRAIRIE GREEN DR | 122 |
| KERR AVE | 118 |
| PARK ST | 118 |
| GUARDIAN DR | 106 |
| ILLINOIS ST | 98 |
| BROADWAY AVE | 92 |
| GOODWIN AVE | 92 |
| HARDING DR | 92 |
| COLORADO AVE | 88 |
| MICHIGAN AVE | 84 |
| WASHINGTON ST | 82 |
| PENNSYLVANIA AVE | 80 |
| PERKINS RD | 80 |
| LIERMAN AVE | 76 |
| VINE ST | 74 |
| OREGON ST | 72 |
| GREGORY DR | 70 |
| MATHEWS AVE | 68 |
| COTTAGE GROVE AVE | 66 |
| ELM ST | 66 |
| RACE ST | 62 |
| BROWNFIELD RD | 60 |
| SILVER ST | 58 |
| Other | 103 |
2002 - 2018 National Fire Incident Reporting System (NFIRS) incidents
- Incident types reported to NFIRS in Urbana, IL
- 12,97042.4%Rescue & EMS
- 4,12913.5%False Alarm
- 3,63711.9%Service Call
- 3,37011.0%Hazardous Condition
- 3,33310.9%Fire
- 3,05010.0%Good Intent Call
- 720.2%Overpressure Rupture
- Fire incident types reported to NFIRS in Urbana, IL
- 1,74252.3%Structure Fires
- 1,08732.6%Outside Fires
- 3319.9%Mobile Property/Vehicle Fires
- 1735.2%Other
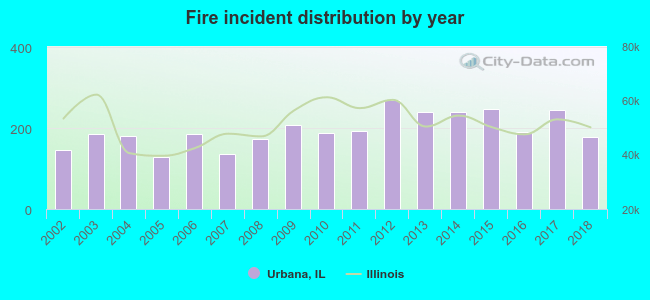 According to the data from the years 2002 - 2018 the average number of fire incidents per year is 196. The highest number of reported fires - 269 took place in 2012, and the least - 128 in 2005. The data has an increasing trend.
 The median response time based on all reported fire incidents is 5 minutes. This is similar to the Illinois median value.
The median response time in Urbana, IL compared to nearest cities:
(Note: Based on data for all years, including only cities with at least 500 fire incidents)
| Urbana: | 5 minutes |
| Champaign: | 5 minutes |
| Savoy: | 7 minutes |
| Mahomet: | 9 minutes |
| Rantoul: | 5 minutes |
| Westville: | 10 minutes |
| Danville: | 5 minutes |
| Georgetown: | 10 minutes |
 Based on the data from the years 2002 - 2018 the average number of fire-related yearly deaths is 0. The highest number of reported deaths - 1 took place in 2010, and the lowest - 0 in 2002. The data has a constant trend.
The average number of deaths per 1,000 fire incidents is 1. This indicator was the highest - 5 in 2010, and the lowest 0 in 2002. The trend for deaths per 1,000 incidents is constant. Compared to the Illinois value the number of deaths per 1,000 incidents is lower.
Based on the data from the years 2002 - 2018 the average number of fire-related yearly deaths is 0. The highest number of reported deaths - 1 took place in 2010, and the lowest - 0 in 2002. The data has a constant trend.
The average number of deaths per 1,000 fire incidents is 1. This indicator was the highest - 5 in 2010, and the lowest 0 in 2002. The trend for deaths per 1,000 incidents is constant. Compared to the Illinois value the number of deaths per 1,000 incidents is lower.
 Based on the reports from the years 2002 - 2018 the average number of fire-related casualties per year is 1. The highest number of casualties - 4 took place in 2002, and the lowest - 0 in 2004. The data has a dropping trend.
The average number of injuries per 1,000 fire incidents is 8. This indicator was the highest - 31 in 2005, and the lowest 0 in 2004. The trend for casualties per 1,000 fires is declining. Compared to the state value the number of casualties per 1,000 fire incidents is lower.
Based on the reports from the years 2002 - 2018 the average number of fire-related casualties per year is 1. The highest number of casualties - 4 took place in 2002, and the lowest - 0 in 2004. The data has a dropping trend.
The average number of injuries per 1,000 fire incidents is 8. This indicator was the highest - 31 in 2005, and the lowest 0 in 2004. The trend for casualties per 1,000 fires is declining. Compared to the state value the number of casualties per 1,000 fire incidents is lower.
 31.7% incidents where reported in the morning and 68.3% in the evening. The most fires (15.9%) took place on Saturday, and the least (12.8%) on Monday.
 Based on the 3,333 fires from years 2002 - 2018 most fires (11.8%) took place during April, and the least (5.8%) in December.
 Out of all 30,608 cases reported during the years 2002 - 2018, the most belonged to the categories: Rescue & EMS (42.4%), False Alarm (13.5%), and Service Call (11.9%).
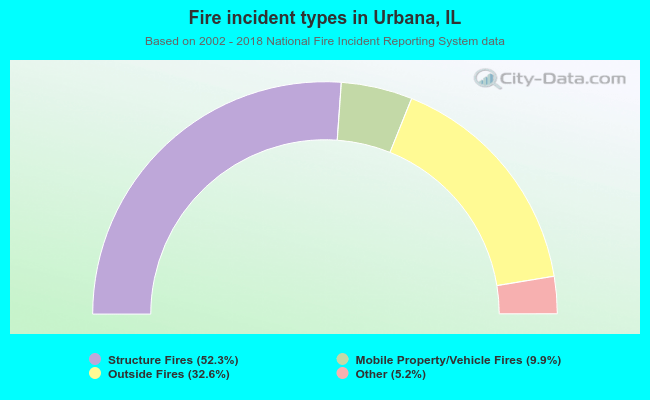 When looking into fire subcategories, the most reports belonged to: Structure Fires (52.3%), and Outside Fires (32.6%).