Rantoul: Fire Incidents, Illinois (IL)
Where are fire incidents reported in Rantoul, IL
Something went wrong! Please refresh the page.
|
| |||||||||||||||||||||||||||||||||||||||||||||||||||||||||||||||||||||||||||||||||||||||||||||||||||||||||||||
| Other | 78 | |||||||||||||||||||||||||||||||||||||||||||||||||||||||||||||||||||||||||||||||||||||||||||||||||||||||||||||
2002 - 2018 National Fire Incident Reporting System (NFIRS) incidents
- Incident types reported to NFIRS in Rantoul, IL
- 1,00233.6%Hazardous Condition
- 79026.5%Fire
- 57819.4%Good Intent Call
- 34611.6%False Alarm
- 1474.9%Rescue & EMS
- 1093.7%Service Call
- 80.3%Special Incident
- Fire incident types reported to NFIRS in Rantoul, IL
- 41252.2%Structure Fires
- 20926.5%Outside Fires
- 16020.3%Mobile Property/Vehicle Fires
- 91.1%Other
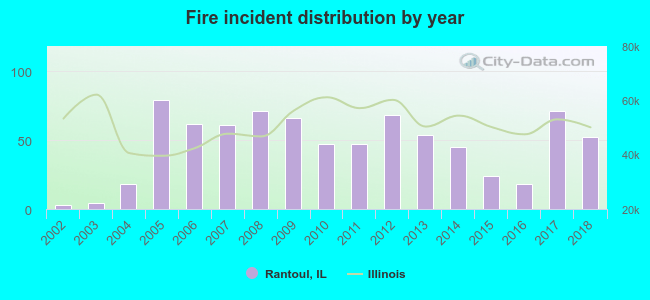 According to the data from the years 2002 - 2018 the average number of fire incidents per year is 46. The highest number of fire incidents - 79 took place in 2005, and the least - 3 in 2002. The data has a growing trend.
The average number of yearly fire incidents per 10k residents in Rantoul, IL compared to nearest cities:
(Note: Based on data for the last 3 years, including only cities with population 5,000 and above)
| Rantoul: | 35.9 |
| Urbana: | 48.7 |
| Champaign: | 36.1 |
| Mahomet: | 62.0 |
| Savoy: | 92.7 |
| Hoopeston: | 63.4 |
| Monticello: | 35.0 |
| Danville: | 69.1 |
 The median response time based on all reported fire incidents is 5 minutes. This is comparable to the state median value.
 Based on the data from the years 2002 - 2018 the average number of fire-related yearly deaths is 0. The highest number of deaths - 1 took place in 2005, and the lowest - 0 in 2002. The data has a constant trend.
 33.7% incidents where reported in the morning and 66.3% in the evening. The most fires (15.8%) took place on Tuesday, and the least (12.8%) on Wednesday.
 According to the 790 reports from years 2002 - 2018 most fires (12.5%) took place during May, and the least (5.1%) in February.
 Out of all 2,981 cases reported during the years 2002 - 2018, the most belonged to the categories: Hazardous Condition (33.6%), Fire (26.5%), and Good Intent Call (19.4%).
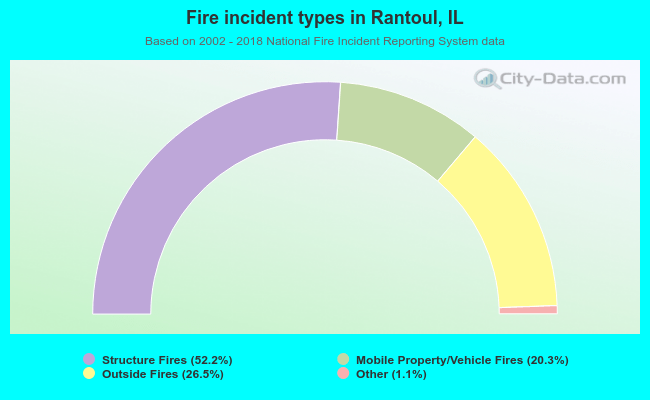 When looking into fire subcategories, the most reports belonged to: Structure Fires (52.2%), and Outside Fires (26.5%).