Tuscumbia: Fire Incidents, Alabama (AL)
Where are fire incidents reported in Tuscumbia, AL
Something went wrong! Please refresh the page.
|
| |||||||||||||||||||||||||||||||||||||||||||||||||||||||||||||||||||||||||||||||||||||||||||||||||||||||||||||
2003 - 2018 National Fire Incident Reporting System (NFIRS) incidents
- Incident types reported to NFIRS in Tuscumbia, AL
- 2,54272.7%Rescue & EMS
- 49214.1%Fire
- 1654.7%False Alarm
- 962.7%Service Call
- 752.1%Hazardous Condition
- 641.8%Good Intent Call
- 591.7%Special Incident
- Fire incident types reported to NFIRS in Tuscumbia, AL
- 20842.3%Outside Fires
- 11824.0%Structure Fires
- 11723.8%Other
- 4910.0%Mobile Property/Vehicle Fires
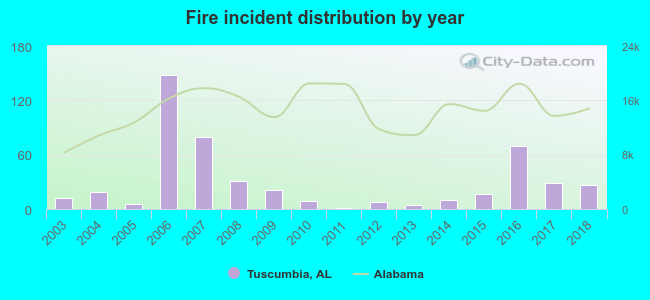 Based on the data from the years 2003 - 2018 the average number of fire incidents per year is 31. The highest number of reported fire incidents - 148 took place in 2006, and the least - 1 in 2011. The data has an increasing trend.
The average number of yearly fire incidents per 10k residents in Tuscumbia, AL compared to nearest cities:
(Note: Based on data for the last 3 years, including only cities with population 5,000 and above)
| Tuscumbia: | 49.2 |
| Muscle Shoals: | 21.1 |
| Florence: | 64.9 |
| Russellville: | 71.0 |
| Cloverdale: | 1.6 |
| Athens: | 38.1 |
| Decatur: | 46.8 |
| Danville: | 1.6 |
| Hamilton: | 4.4 |
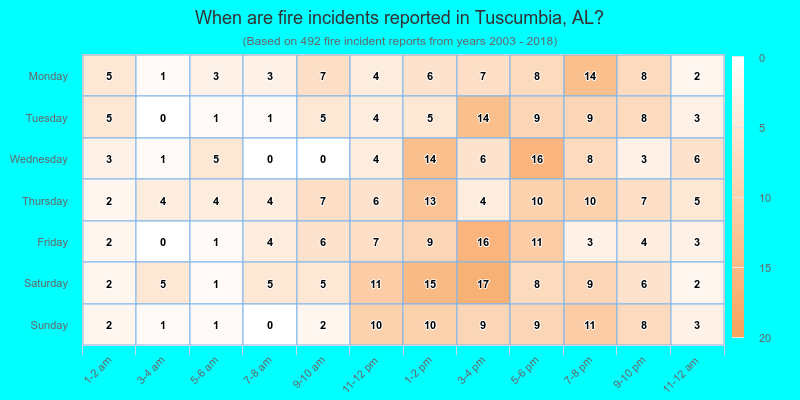
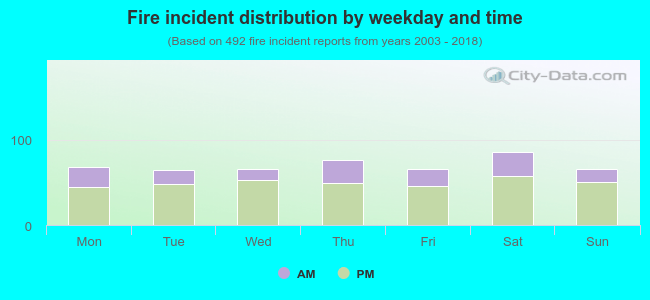 29.3% incidents where reported in the morning and 70.7% in the evening. The most fires (17.5%) took place on Saturday, and the least (13.0%) on Tuesday.
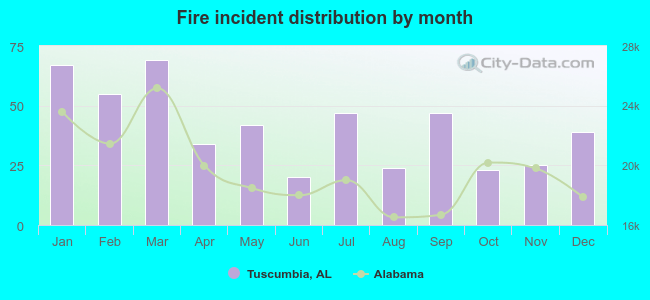 According to the 492 fires from years 2003 - 2018 most fires (14.0%) took place during March, and the least (4.1%) in June.
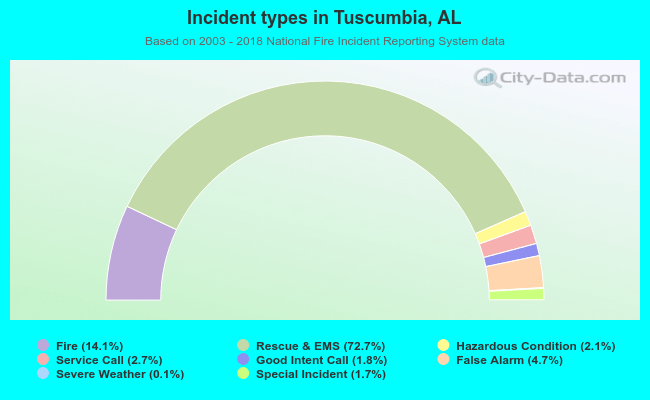 Out of all 3,496 cases reported during the years 2003 - 2018, the most belonged to the categories: Overpressure Rupture (72.7%), Fire (14.1%), and Good Intent Call (4.7%).
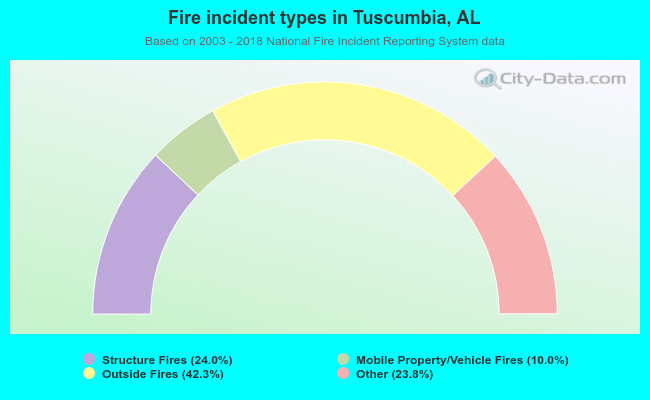 When looking into fire subcategories, the most reports belonged to: Outside Fires (42.3%), and Structure Fires (24.0%).