Hamilton: Fire Incidents, Alabama (AL)
Where are fire incidents reported in Hamilton, AL
Something went wrong! Please refresh the page.
|
| |||||||||||||||||||||||||||||||||||||||||||||||||||||||||||||||||||||||||||||||||||||||||||||||||||||||||||||
2003 - 2017 National Fire Incident Reporting System (NFIRS) incidents
- Incident types reported to NFIRS in Hamilton, AL
- 62371.1%Fire
- 14216.2%Rescue & EMS
- 788.9%Hazardous Condition
- 192.2%Good Intent Call
- 50.6%Service Call
- 50.6%Severe Weather
- 40.5%False Alarm
- Fire incident types reported to NFIRS in Hamilton, AL
- 34154.7%Outside Fires
- 18229.2%Structure Fires
- 7512.0%Mobile Property/Vehicle Fires
- 254.0%Other
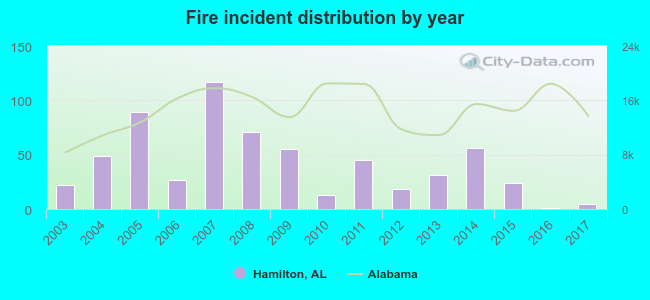 Based on the data from the years 2003 - 2017 the average number of fire incidents per year is 42. The highest number of fire incidents - 117 took place in 2007, and the least - 1 in 2016. The data has a declining trend.
The average number of yearly fire incidents per 10k residents in Hamilton, AL compared to nearest cities:
(Note: Based on data for the last 3 years, including only cities with population 5,000 and above)
| Hamilton: | 4.4 |
| Russellville: | 71.0 |
| Tuscumbia: | 49.2 |
| Jasper: | 56.9 |
| Muscle Shoals: | 21.1 |
 The median response time based on all reported fire incidents is 8 minutes. This is higher than the state median value.
The median response time in Hamilton, AL compared to nearest cities:
(Note: Based on data for all years, including only cities with at least 500 fire incidents)
| Hamilton: | 8 minutes |
| Haleyville: | 6 minutes |
| Russellville: | 5 minutes |
| Nauvoo: | 11 minutes |
| Fayette: | 6 minutes |
| Jasper: | 9 minutes |
| Muscle Shoals: | 4 minutes |
| Moulton: | 9 minutes |
| Parrish: | 10 minutes |
 28.3% incidents where reported in the morning and 71.7% in the evening. The most fires (20.1%) took place on Saturday, and the least (11.7%) on Friday.
 Based on the 623 fire incident reports from years 2003 - 2017 most fires (17.3%) took place during March, and the least (5.3%) in September.
 Out of all 876 cases reported during the years 2003 - 2017, the most belonged to the categories: Fire (71.1%), Overpressure Rupture (16.2%), and Rescue & EMS (8.9%).
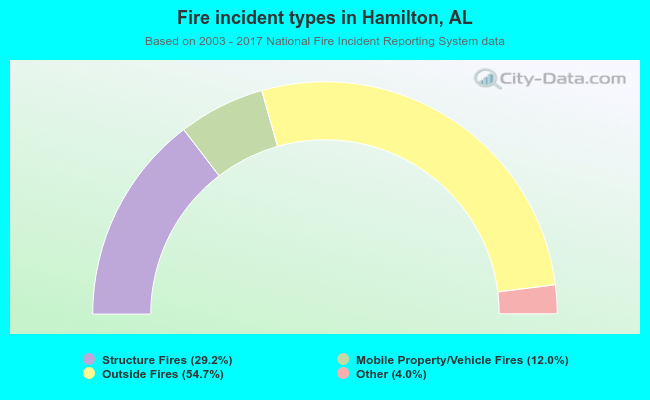 When looking into fire subcategories, the most reports belonged to: Outside Fires (54.7%), and Structure Fires (29.2%).