Telford: Fire Incidents, Tennessee (TN)
Where are fire incidents reported in Telford, TN
Something went wrong! Please refresh the page.
|
| |||||||||||||||||||||||||||||||||||||||||||||||||||||||||||||||||||||||||||||||||||||||||||||||||||||||||||||
2002 - 2018 National Fire Incident Reporting System (NFIRS) incidents
- Incident types reported to NFIRS in Telford, TN
- 16051.6%Fire
- 5818.7%Hazardous Condition
- 4815.5%Good Intent Call
- 268.4%Rescue & EMS
- 103.2%False Alarm
- 82.6%Service Call
- Fire incident types reported to NFIRS in Telford, TN
- 9961.9%Structure Fires
- 4226.3%Outside Fires
- 1710.6%Mobile Property/Vehicle Fires
- 21.3%Other
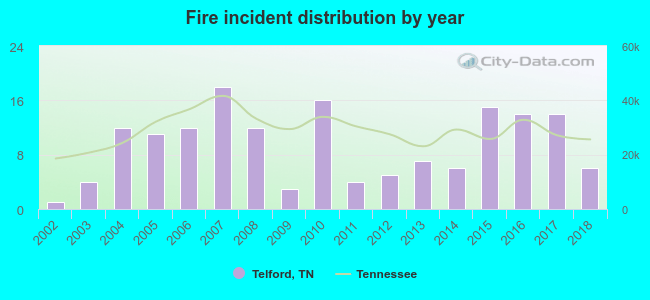 Based on the data from the years 2002 - 2018 the average number of fire incidents per year is 9. The highest number of fires - 18 took place in 2007, and the least - 1 in 2002. The data has a rising trend.
The average number of yearly fire incidents per 10k residents in Telford, TN compared to nearest cities:
(Note: Based on data for the last 3 years, including only cities with population 5,000 and above)
| Telford: | 10.5 |
| Jonesborough: | 178.8 |
| Erwin: | 5.0 |
| Greeneville: | 133.0 |
| Johnson City: | 41.4 |
| Colonial Heights: | 2.2 |
| Elizabethton: | 92.5 |
| Kingsport: | 67.3 |
| Church Hill: | 52.3 |

 35.6% incidents where reported in the morning and 64.4% in the evening. The most fires (19.4%) took place on Monday, and the least (9.4%) on Wednesday.
 According to the 160 reports from years 2002 - 2018 most fires (11.9%) took place during January, and the least (3.8%) in July.
 Out of all 310 cases reported during the years 2002 - 2018, the most belonged to the categories: Fire (51.6%), Rescue & EMS (18.7%), and Service Call (15.5%).
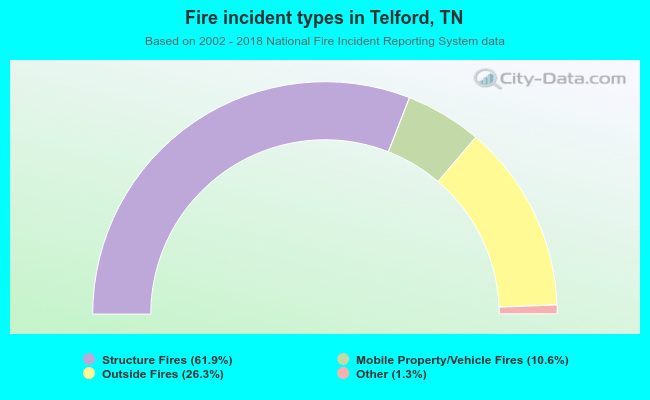 When looking into fire subcategories, the most reports belonged to: Structure Fires (61.9%), and Outside Fires (26.3%).