Kingsport: Fire Incidents, Tennessee (TN)
Where are fire incidents reported in Kingsport, TN
Something went wrong! Please refresh the page.
| Fire incidents reported | |
|---|---|
| Sreet name | Count |
| STONE DR | 608 |
| FORT HENRY DR | 314 |
| STONEGATE RD | 252 |
| CENTER ST | 194 |
| LYNN GARDEN DR | 154 |
| MEMORIAL BLVD | 154 |
| SEVIER AVE | 148 |
| EASTMAN RD | 136 |
| JOHN B DENNIS HWY | 122 |
| BLOOMINGDALE PIKE | 116 |
| OAK ST | 110 |
| SULLIVAN ST | 100 |
| ROBERTSON ST | 98 |
| BLOOMINGDALE RD | 84 |
| BARNETT DR | 82 |
| MORELAND DR | 82 |
| ROCK SPRINGS RD | 78 |
| DALE ST | 74 |
| I 26 | 74 |
| I 81 | 70 |
| RAVINE RD | 66 |
| COOKS VALLEY RD | 64 |
| INDUSTRY DR | 64 |
| I 181 | 62 |
| FAIRVIEW AVE | 60 |
| VIRGIL AVE | 54 |
| GRANBY RD | 52 |
| UNIVERSITY BLVD | 52 |
| FORDTOWN RD | 50 |
| BANCROFT CHAPEL RD | 46 |
| Other | 2,890 |
2002 - 2018 National Fire Incident Reporting System (NFIRS) incidents
- Incident types reported to NFIRS in Kingsport, TN
- 37,67265.9%Rescue & EMS
- 6,51011.4%Fire
- 5,2379.2%Good Intent Call
- 3,4836.1%False Alarm
- 2,3014.0%Hazardous Condition
- 1,8813.3%Service Call
- 720.1%Overpressure Rupture
- Fire incident types reported to NFIRS in Kingsport, TN
- 2,75942.4%Outside Fires
- 2,27434.9%Structure Fires
- 1,04916.1%Mobile Property/Vehicle Fires
- 4286.6%Other
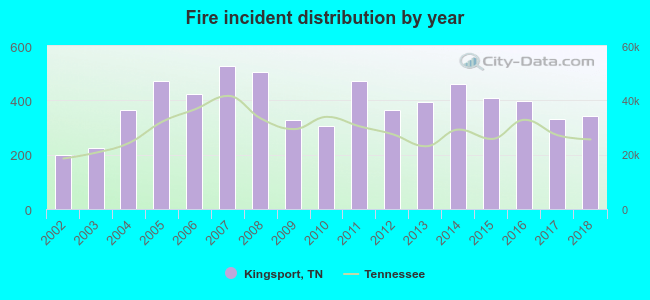 According to the data from the years 2002 - 2018 the average number of fires per year is 383. The highest number of reported fires - 525 took place in 2007, and the least - 198 in 2002. The data has a rising trend.
The average number of yearly fire incidents per 10k residents in Kingsport, TN compared to nearest cities:
(Note: Based on data for the last 3 years, including only cities with population 5,000 and above)
| Kingsport: | 67.3 |
| Bloomingdale: | 1.0 |
| Colonial Heights: | 2.2 |
| Mount Carmel: | 44.6 |
| Church Hill: | 52.3 |
| Johnson City: | 41.4 |
| Jonesborough: | 178.8 |
| Bristol: | 54.5 |
| Elizabethton: | 92.5 |
 The median response time based on all reported fire incidents is 7 minutes. This is close to the Tennessee median value.
The median response time in Kingsport, TN compared to nearest cities:
(Note: Based on data for all years, including only cities with at least 500 fire incidents)
| Kingsport: | 7 minutes |
| Gray: | 10 minutes |
| Church Hill: | 9 minutes |
| Blountville: | 11 minutes |
| Bluff City: | 8 minutes |
| Johnson City: | 4 minutes |
| Jonesborough: | 9 minutes |
| Bristol: | 6 minutes |
| Elizabethton: | 8 minutes |
 According to the reports from the years 2002 - 2018 the average number of fire-related yearly deaths is 1. The highest number of reported deaths - 6 took place in 2006, and the lowest - 0 in 2002. The data has an increasing trend.
The average number of fatalities per 1,000 fire incidents is 3. This indicator was the highest - 14 in 2006, and the lowest 0 in 2002. The trend for deaths per 1,000 fires is increasing. Compared to the state value the number of deaths per 1,000 incidents is similar.
According to the reports from the years 2002 - 2018 the average number of fire-related yearly deaths is 1. The highest number of reported deaths - 6 took place in 2006, and the lowest - 0 in 2002. The data has an increasing trend.
The average number of fatalities per 1,000 fire incidents is 3. This indicator was the highest - 14 in 2006, and the lowest 0 in 2002. The trend for deaths per 1,000 fires is increasing. Compared to the state value the number of deaths per 1,000 incidents is similar.Deaths per 1,000 incidents in Kingsport, TN compared to nearest cities:
(Note: Based on data for all years, including only cities with at least 2,500 fire incidents)
| Kingsport: | 3.4 |
| Johnson City: | 4.7 |
| Elizabethton: | 2.2 |
| Greeneville: | 3.6 |
 According to the reports from the years 2002 - 2018 the average number of fire-related casualties per year is 5. The highest number of casualties - 11 took place in 2006, and the lowest - 1 in 2002. The data has a rising trend.
The average number of injuries per 1,000 fire incidents is 13. This indicator was the highest - 31 in 2009, and the lowest 4 in 2014. The trend for injuries per 1,000 fire incidents is rising. Compared to the Tennessee value the number of injuries per 1,000 fires is higher.
According to the reports from the years 2002 - 2018 the average number of fire-related casualties per year is 5. The highest number of casualties - 11 took place in 2006, and the lowest - 1 in 2002. The data has a rising trend.
The average number of injuries per 1,000 fire incidents is 13. This indicator was the highest - 31 in 2009, and the lowest 4 in 2014. The trend for injuries per 1,000 fire incidents is rising. Compared to the Tennessee value the number of injuries per 1,000 fires is higher.Casualties per 1,000 incidents in Kingsport, TN compared to nearest cities:
(Note: Based on data for all years, including only cities with at least 500 fire incidents)
| Kingsport: | 13.7 |
| Gray: | 1.6 |
| Church Hill: | 4.2 |
| Blountville: | 4.1 |
| Bluff City: | 6.0 |
| Johnson City: | 19.1 |
| Jonesborough: | 2.9 |
| Bristol: | 6.9 |
| Elizabethton: | 14.3 |
 29.6% incidents where reported in the morning and 70.4% in the evening. The most fires (15.6%) took place on Saturday, and the least (13.3%) on Tuesday.
 According to the 6,510 fires from years 2002 - 2018 most fires (10.7%) took place during April, and the least (6.8%) in February.
 Out of all 57,204 cases reported during the years 2002 - 2018, the most belonged to the categories: Rescue & EMS (65.9%), Fire (11.4%), and Good Intent Call (9.2%).
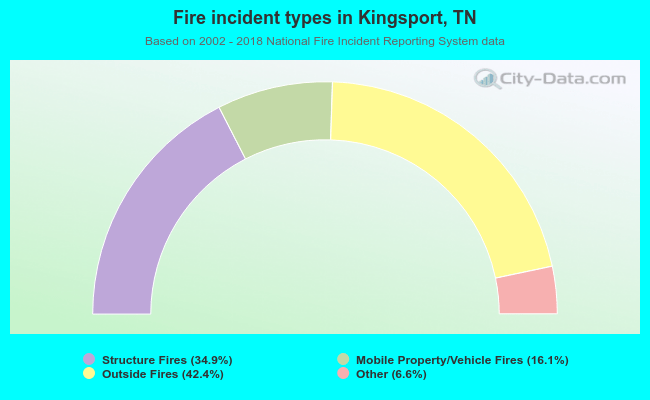 When looking into fire subcategories, the most reports belonged to: Outside Fires (42.4%), and Structure Fires (34.9%).