Springfield: Fire Incidents, Virginia (VA)
Where are fire incidents reported in Springfield, VA
Something went wrong! Please refresh the page.
| Fire incidents reported | |
|---|---|
| Sreet name | Count |
| BACKLICK RD | 94 |
| OLD KEENE MILL RD | 68 |
| COMMERCE ST | 56 |
| ROLLING RD | 50 |
| METROPOLITAN CENTER DR | 48 |
| FRONTIER DR | 36 |
| OLD KEENE MILL RD EB TO I95 NB | 34 |
| FULLERTON RD | 28 |
| I95 SB RAMP TO I95 HOV SB | 28 |
| I95 NB RAMP TO I95 NB | 26 |
| RHODEN CT | 26 |
| GREELEY BLVD | 24 |
| OLD KEENE MILL RD | 24 |
| ROLLING RD | 22 |
| SPRINGFIELD PLZ | 22 |
| FRANCONIA RD | 20 |
| LOISDALE RD | 20 |
| SKYLES WAY | 20 |
| SPRING VILLAGE DR | 20 |
| BRANDON AVE | 18 |
| EXPRESS LANE SB | 18 |
| I95 NB RAMP TO I95 HOV NB | 18 |
| COMMERCE ST | 16 |
| HEMING AVE | 16 |
| I95 SB RAMP TO I95 SB | 16 |
| PORT ROYAL RD | 16 |
| SPRING GARDEN DR | 16 |
| ACCOTINK PARK RD | 14 |
| BURKE LAKE RD | 14 |
| ELECTRONIC DR | 14 |
| Other | 638 |
2009 - 2018 National Fire Incident Reporting System (NFIRS) incidents
- Incident types reported to NFIRS in Springfield, VA
- 25,45972.6%Rescue & EMS
- 2,1986.3%Service Call
- 2,1656.2%Good Intent Call
- 1,9335.5%False Alarm
- 1,7354.9%Hazardous Condition
- 1,4804.2%Fire
- 470.1%Special Incident
- Fire incident types reported to NFIRS in Springfield, VA
- 58739.7%Structure Fires
- 52635.5%Outside Fires
- 30620.7%Mobile Property/Vehicle Fires
- 614.1%Other
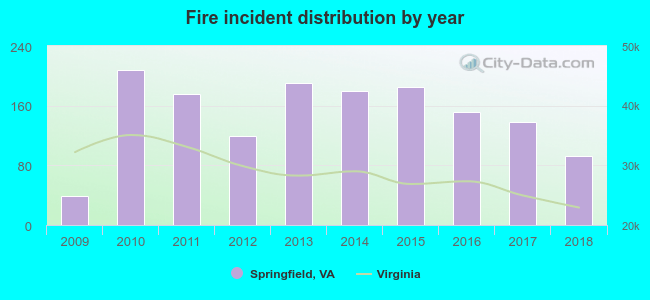 Based on the data from the years 2009 - 2018 the average number of fires per year is 148. The highest number of reported fires - 208 took place in 2010, and the least - 39 in 2009. The data has a rising trend.
The average number of yearly fire incidents per 10k residents in Springfield, VA compared to nearest cities:
(Note: Based on data for the last 3 years, including only cities with population 5,000 and above)
| Springfield: | 41.9 |
| North Springfield: | 22.0 |
| West Springfield: | 11.6 |
| Annandale: | 25.5 |
| Rose Hill: | 4.1 |
| Burke: | 11.0 |
| Fort Belvoir: | 8.5 |
| Jefferson: | 1.1 |
| Seven Corners: | 15.1 |
 The median response time based on all reported fire incidents is 6 minutes. This is comparable to the Virginia median value.
The median response time in Springfield, VA compared to nearest cities:
(Note: Based on data for all years, including only cities with at least 500 fire incidents)
| Springfield: | 6 minutes |
| Annandale: | 5 minutes |
| Alexandria: | 5 minutes |
| Lorton: | 6 minutes |
| Falls Church: | 5 minutes |
| Arlington: | 5 minutes |
| Fairfax: | 6 minutes |
| Vienna: | 5 minutes |
| Fort Washington: | 8 minutes |
 Based on the data from the years 2009 - 2018 the average number of fire-related yearly casualties is 0. The highest number of reported casualties - 1 took place in 2010, and the lowest - 0 in 2009. The data has a constant trend.
The average number of injuries per 1,000 fires is 2. This indicator was the highest - 6 in 2014, and the lowest 0 in 2009. The trend for injuries per 1,000 fires is constant. Compared to the state value the number of casualties per 1,000 incidents is much lower.
Based on the data from the years 2009 - 2018 the average number of fire-related yearly casualties is 0. The highest number of reported casualties - 1 took place in 2010, and the lowest - 0 in 2009. The data has a constant trend.
The average number of injuries per 1,000 fires is 2. This indicator was the highest - 6 in 2014, and the lowest 0 in 2009. The trend for injuries per 1,000 fires is constant. Compared to the state value the number of casualties per 1,000 incidents is much lower.Casualties per 1,000 incidents in Springfield, VA compared to nearest cities:
(Note: Based on data for all years, including only cities with at least 500 fire incidents)
| Springfield: | 2.0 |
| Annandale: | 6.0 |
| Alexandria: | 6.6 |
| Lorton: | 0.0 |
| Falls Church: | 0.4 |
| Arlington: | 2.3 |
| Fairfax: | 1.2 |
| Vienna: | 0.0 |
| Fort Washington: | 8.6 |
 28.4% incidents where reported in the morning and 71.6% in the evening. The most fires (17.0%) took place on Saturday, and the least (10.9%) on Wednesday.
 Based on the 1,480 fire incidents from years 2009 - 2018 most fires (12.4%) took place during April, and the least (6.1%) in August.
 Out of all 35,061 cases reported during the years 2009 - 2018, the most belonged to the categories: Rescue & EMS (72.6%), Service Call (6.3%), and Good Intent Call (6.2%).
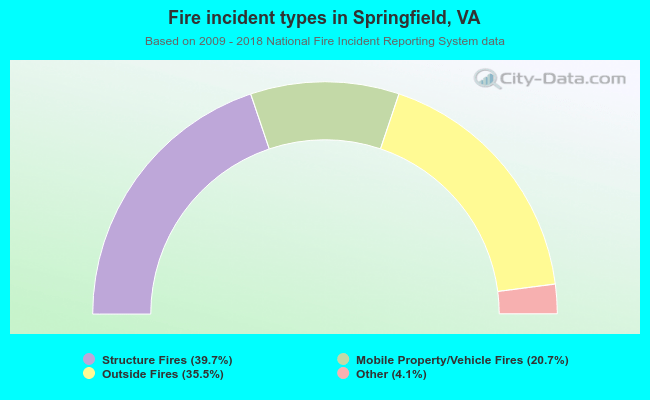 When looking into fire subcategories, the most incidents belonged to: Structure Fires (39.7%), and Outside Fires (35.5%).