Fairfax: Fire Incidents, Virginia (VA)
Where are fire incidents reported in Fairfax, VA
Something went wrong! Please refresh the page.
| Fire incidents reported | |
|---|---|
| Sreet name | Count |
| LEE HWY | 242 |
| MAIN ST | 196 |
| FAIRFAX BLVD | 192 |
| WILLOW CRESCENT DR | 86 |
| BRADDOCK RD | 76 |
| CHAIN BRIDGE RD | 74 |
| LEE JACKSON MEMORIAL HWY | 74 |
| WEST OX RD | 62 |
| PERSIMMON DR | 60 |
| AQUIA CREEK LN | 50 |
| FAIR LAKES SHOPPING CTR | 46 |
| I66 EB THRU RAMP | 42 |
| LEE HWY | 42 |
| OLD LEE HWY | 42 |
| ARLINGTON BLVD | 40 |
| FAIR OAKS SHOPPING CTR | 38 |
| PICKETT RD | 38 |
| UNIVERSITY DR | 38 |
| OLLEY LN | 36 |
| DIXIE HILL RD | 34 |
| DORR AVE | 34 |
| LEE JACKSON MEMORIAL HWY | 34 |
| NUTLEY ST | 34 |
| PROSPERITY AVE | 34 |
| SEMINARY RD | 34 |
| MOSBY WOODS DR | 32 |
| BLAKE LN | 30 |
| BRADDOCK RD | 30 |
| FAIR RIDGE DR | 30 |
| MONUMENT DR | 30 |
| Other | 1,627 |
2002 - 2018 National Fire Incident Reporting System (NFIRS) incidents
- Incident types reported to NFIRS in Fairfax, VA
- 45,85964.5%Rescue & EMS
- 7,92711.1%Good Intent Call
- 5,3127.5%False Alarm
- 4,3386.1%Hazardous Condition
- 4,1125.8%Service Call
- 3,4574.9%Fire
- Fire incident types reported to NFIRS in Fairfax, VA
- 1,91855.5%Structure Fires
- 87625.3%Outside Fires
- 48113.9%Mobile Property/Vehicle Fires
- 1825.3%Other
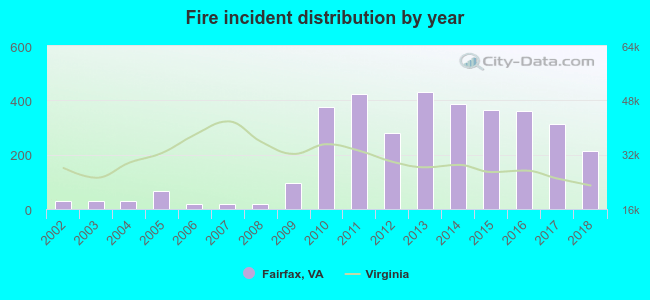 Based on the data from the years 2002 - 2018 the average number of fires per year is 203. The highest number of reported fires - 429 took place in 2013, and the least - 20 in 2006. The data has a growing trend.
The average number of yearly fire incidents per 10k residents in Fairfax, VA compared to nearest cities:
(Note: Based on data for the last 3 years, including only cities with population 5,000 and above)
| Fairfax: | 120.5 |
| Oakton: | 10.0 |
| Merrifield: | 1.1 |
| Fairfax Station: | 26.3 |
| Vienna: | 45.6 |
| Dunn Loring: | 5.7 |
| Annandale: | 25.5 |
| Burke: | 11.0 |
| Chantilly: | 39.8 |
 The median response time based on all reported fire incidents is 6 minutes. This is close to the Virginia median value.
The median response time in Fairfax, VA compared to nearest cities:
(Note: Based on data for all years, including only cities with at least 500 fire incidents)
| Fairfax: | 6 minutes |
| Vienna: | 5 minutes |
| Annandale: | 5 minutes |
| Chantilly: | 6 minutes |
| Falls Church: | 5 minutes |
| Reston: | 5 minutes |
| Centreville: | 6 minutes |
| Springfield: | 6 minutes |
| McLean: | 6 minutes |
 According to the reports from the years 2002 - 2018 the average number of fire-related yearly deaths is 0. The highest number of deaths - 2 took place in 2016, and the lowest - 0 in 2002. The data has a constant trend.
The average number of fatalities per 1,000 fire incidents is 1. This indicator was the highest - 10 in 2009, and the lowest 0 in 2002. The trend for deaths per 1,000 fires is rising. Compared to the state value the number of fatalities per 1,000 fire incidents is lower.
According to the reports from the years 2002 - 2018 the average number of fire-related yearly deaths is 0. The highest number of deaths - 2 took place in 2016, and the lowest - 0 in 2002. The data has a constant trend.
The average number of fatalities per 1,000 fire incidents is 1. This indicator was the highest - 10 in 2009, and the lowest 0 in 2002. The trend for deaths per 1,000 fires is rising. Compared to the state value the number of fatalities per 1,000 fire incidents is lower.Deaths per 1,000 incidents in Fairfax, VA compared to nearest cities:
(Note: Based on data for all years, including only cities with at least 2,500 fire incidents)
| Fairfax: | 1.2 |
| Falls Church: | 1.1 |
| Arlington: | 0.0 |
| Manassas: | 0.2 |
| Sterling: | 0.7 |
| Alexandria: | 0.4 |
 According to the data from the years 2002 - 2018 the average number of fire-related casualties per year is 0. The highest number of reported casualties - 1 took place in 2010, and the lowest - 0 in 2002. The data has a constant trend.
The average number of injuries per 1,000 fires is 1. This indicator was the highest - 3 in 2016, and the lowest 0 in 2002. The trend for casualties per 1,000 incidents is constant. Compared to the state value the number of casualties per 1,000 fire incidents is much lower.
According to the data from the years 2002 - 2018 the average number of fire-related casualties per year is 0. The highest number of reported casualties - 1 took place in 2010, and the lowest - 0 in 2002. The data has a constant trend.
The average number of injuries per 1,000 fires is 1. This indicator was the highest - 3 in 2016, and the lowest 0 in 2002. The trend for casualties per 1,000 incidents is constant. Compared to the state value the number of casualties per 1,000 fire incidents is much lower.Casualties per 1,000 incidents in Fairfax, VA compared to nearest cities:
(Note: Based on data for all years, including only cities with at least 500 fire incidents)
| Fairfax: | 1.2 |
| Vienna: | 0.0 |
| Annandale: | 6.0 |
| Chantilly: | 4.3 |
| Falls Church: | 0.4 |
| Reston: | 1.1 |
| Centreville: | 0.0 |
| Springfield: | 2.0 |
| McLean: | 1.0 |
 32.1% incidents where reported in the morning and 67.9% in the evening. The most fires (15.3%) took place on Saturday, and the least (13.6%) on Thursday.
 Based on the 3,457 fire incidents from years 2002 - 2018 most fires (10.6%) took place during April, and the least (6.3%) in August.
 Out of all 71,144 cases reported during the years 2002 - 2018, the most belonged to the categories: Rescue & EMS (64.5%), Good Intent Call (11.1%), and False Alarm (7.5%).
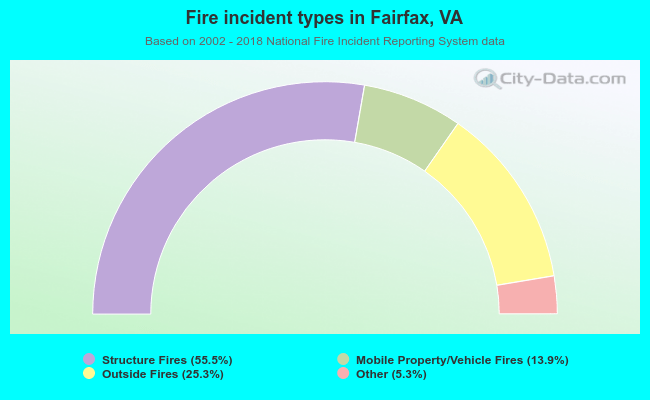 When looking into fire subcategories, the most incidents belonged to: Structure Fires (55.5%), and Outside Fires (25.3%).