Siler City: Fire Incidents, North Carolina (NC)
Where are fire incidents reported in Siler City, NC
Something went wrong! Please refresh the page.
|
| |||||||||||||||||||||||||||||||||||||||||||||||||||||||||||||||||||||||||||||||||||||||||||||||||||||||||||||
| Other | 499 | |||||||||||||||||||||||||||||||||||||||||||||||||||||||||||||||||||||||||||||||||||||||||||||||||||||||||||||
2003 - 2018 National Fire Incident Reporting System (NFIRS) incidents
- Incident types reported to NFIRS in Siler City, NC
- 1,40729.7%Rescue & EMS
- 1,34128.3%Fire
- 60112.7%Hazardous Condition
- 52411.1%False Alarm
- 48010.1%Good Intent Call
- 3587.6%Service Call
- 250.5%Severe Weather
- Fire incident types reported to NFIRS in Siler City, NC
- 63847.6%Structure Fires
- 36627.3%Outside Fires
- 19314.4%Mobile Property/Vehicle Fires
- 14410.7%Other
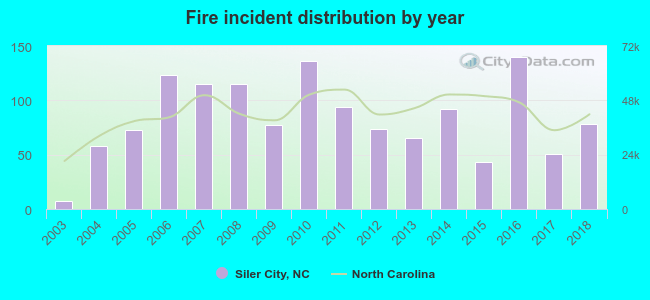 Based on the data from the years 2003 - 2018 the average number of fires per year is 84. The highest number of reported fire incidents - 140 took place in 2016, and the least - 7 in 2003. The data has a rising trend.
The average number of yearly fire incidents per 10k residents in Siler City, NC compared to nearest cities:
(Note: Based on data for the last 3 years, including only cities with population 5,000 and above)
| Siler City: | 108.4 |
| Asheboro: | 63.9 |
| Sanford: | 128.7 |
| Graham: | 45.8 |
| Carrboro: | 29.5 |
| Burlington: | 55.4 |
| Elon: | 49.2 |
| Gibsonville: | 135.9 |
| Chapel Hill: | 39.1 |
 The median response time based on all reported fire incidents is 7 minutes. This is comparable to the state median value.
The median response time in Siler City, NC compared to nearest cities:
(Note: Based on data for all years, including only cities with at least 500 fire incidents)
| Siler City: | 7 minutes |
| Liberty: | 8 minutes |
| Ramseur: | 7 minutes |
| Pittsboro: | 8 minutes |
| Asheboro: | 6 minutes |
| Randleman: | 6 minutes |
| Robbins: | 9 minutes |
| Seagrove: | 10 minutes |
| Pleasant Garden: | 6 minutes |
 28.3% incidents where reported in the morning and 71.7% in the evening. The most fires (16.1%) took place on Sunday, and the least (11.3%) on Monday.
 Based on the 1,341 fire incident reports from years 2003 - 2018 most fires (10.9%) took place during March, and the least (5.3%) in October.
 Out of all 4,738 cases reported during the years 2003 - 2018, the most belonged to the categories: Rescue & EMS (29.7%), Fire (28.3%), and Hazardous Condition (12.7%).
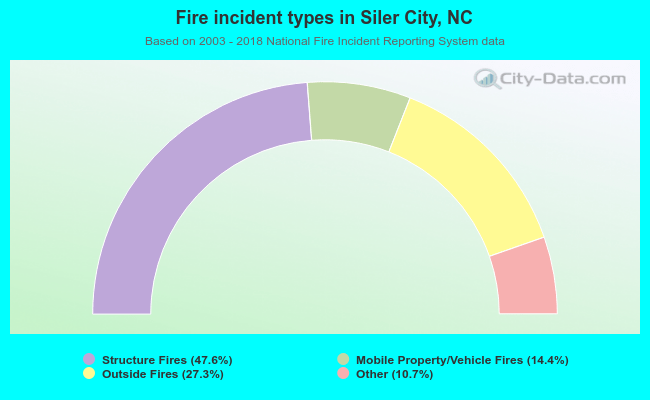 When looking into fire subcategories, the most incidents belonged to: Structure Fires (47.6%), and Outside Fires (27.3%).